

Sac Metro Real Estate Update – 2022 04
The Forces that affect real estate have begun. But Swing is back in favor of “up”.
Sac Metro Real Estate Update – 2022 04 Read More »
Data-driven charts, trends or statistics
The Forces that affect real estate have begun. But Swing is back in favor of “up”.
Sac Metro Real Estate Update – 2022 04 Read More »

When a market changes, it is rarely abrupt.
Sac Metro Real Estate Update – 2022 03 Read More »

The ‘swing’ has started.
Sac Metro Real Estate Update 2022 02 Read More »

Our local Supply is slowly recovering. The winter months don’t offer any historical improvement to Supply or Demand.
Sac Metro Real Estate Update 2021 12 Read More »
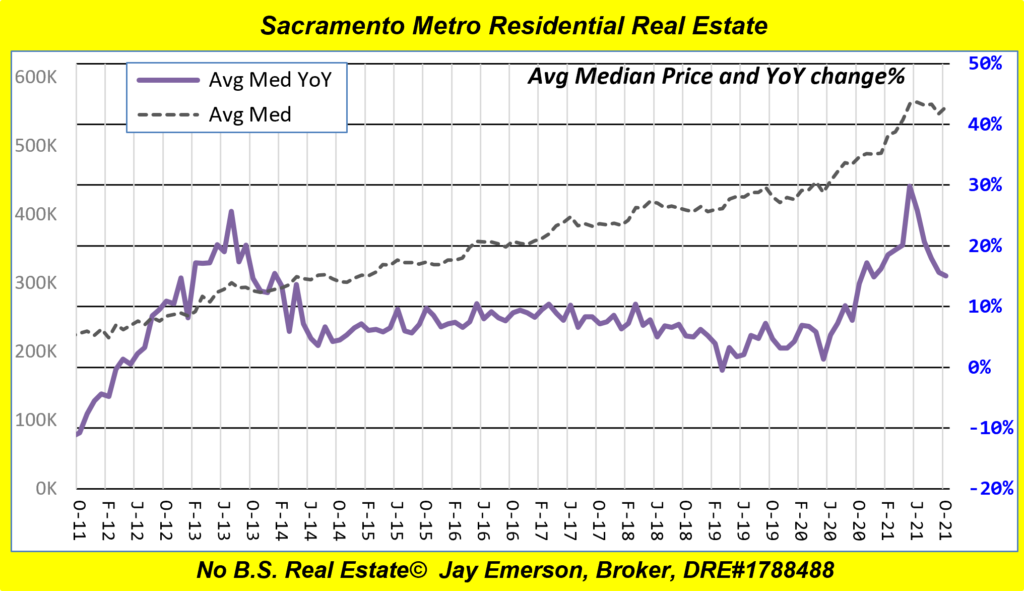
The elephant in the room is our national debt, not masks and mandates.
Sac Metro Real Estate Update 2021 11 Read More »

And the exodus FROM our region is creating demand surges in other states (TN, FL, TX, TX, TX, et al.).
Sac Metro Real Estate Update 2021 10 Read More »
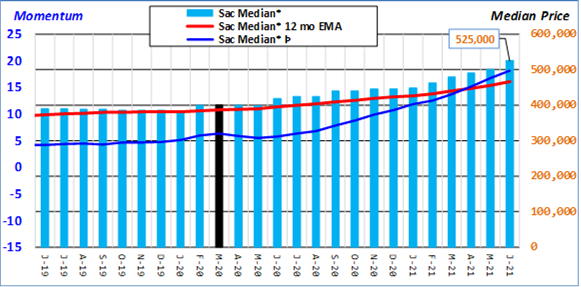
My composite depiction of “consumption” shows when “bonkers” started. (The beginning of the Scamdemic is marked in March 2020.)
Evidence of Bonkers Read More »

July 2021 – Sacramento Metro Real Estate Market Update Wondering if there’s a sign of slowing? Me too. But it’s hard to tell. The Average Median went up again. Momentum is still way above zero and hasn’t been below zero for 9+ years. Composite Average Median Price and Momentum And Cumulative Days on Market (CDOM)
Sac Metro Real Estate Update 2021 07 Read More »
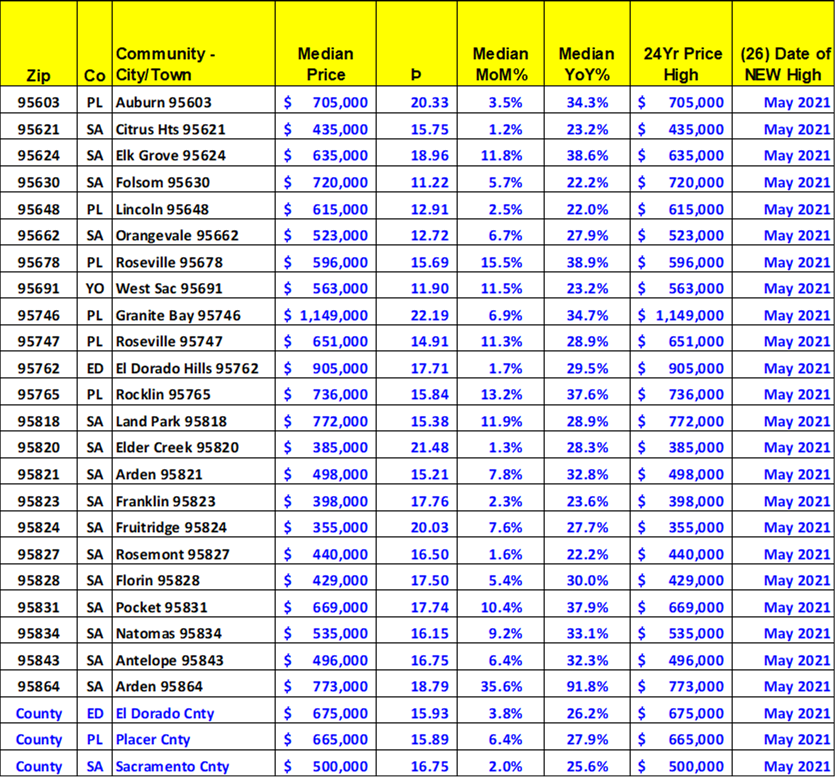
June 2021 – Supplemental Real Estate Market Update When 1 or just several Highs are achieved for local zip codes, it is normal. When 23 zip codes and 3 counties “hit” new highs in a given month (May 2021), it is not normal. Supply and Demand did this. But there are market forces that influence
Supplement – Real Estate Update 2021 06 Read More »