Sacramento Metro Real Estate Update - November 2021
[responsivevoice]
The elephant in the room is our national debt. We want to focus on inflation, home prices, interest rates, or masks and mandates. But our national debt can be our downfall. While our attention is directed to the decreasing INDIVIDUAL debt, we fail to see how it has all moved to the government balance sheet. I can’t pretend. Believing B.S. will not make it true.
Our real estate appreciation of 20%+ may soon mean nothing as the drunken stupor comes to an end. When all economic systems get corrupted and create a public euphoria, the needed remedy to the hangover gets pushed out. Getting pushed out gives the government more opportunity to divert our attention again.
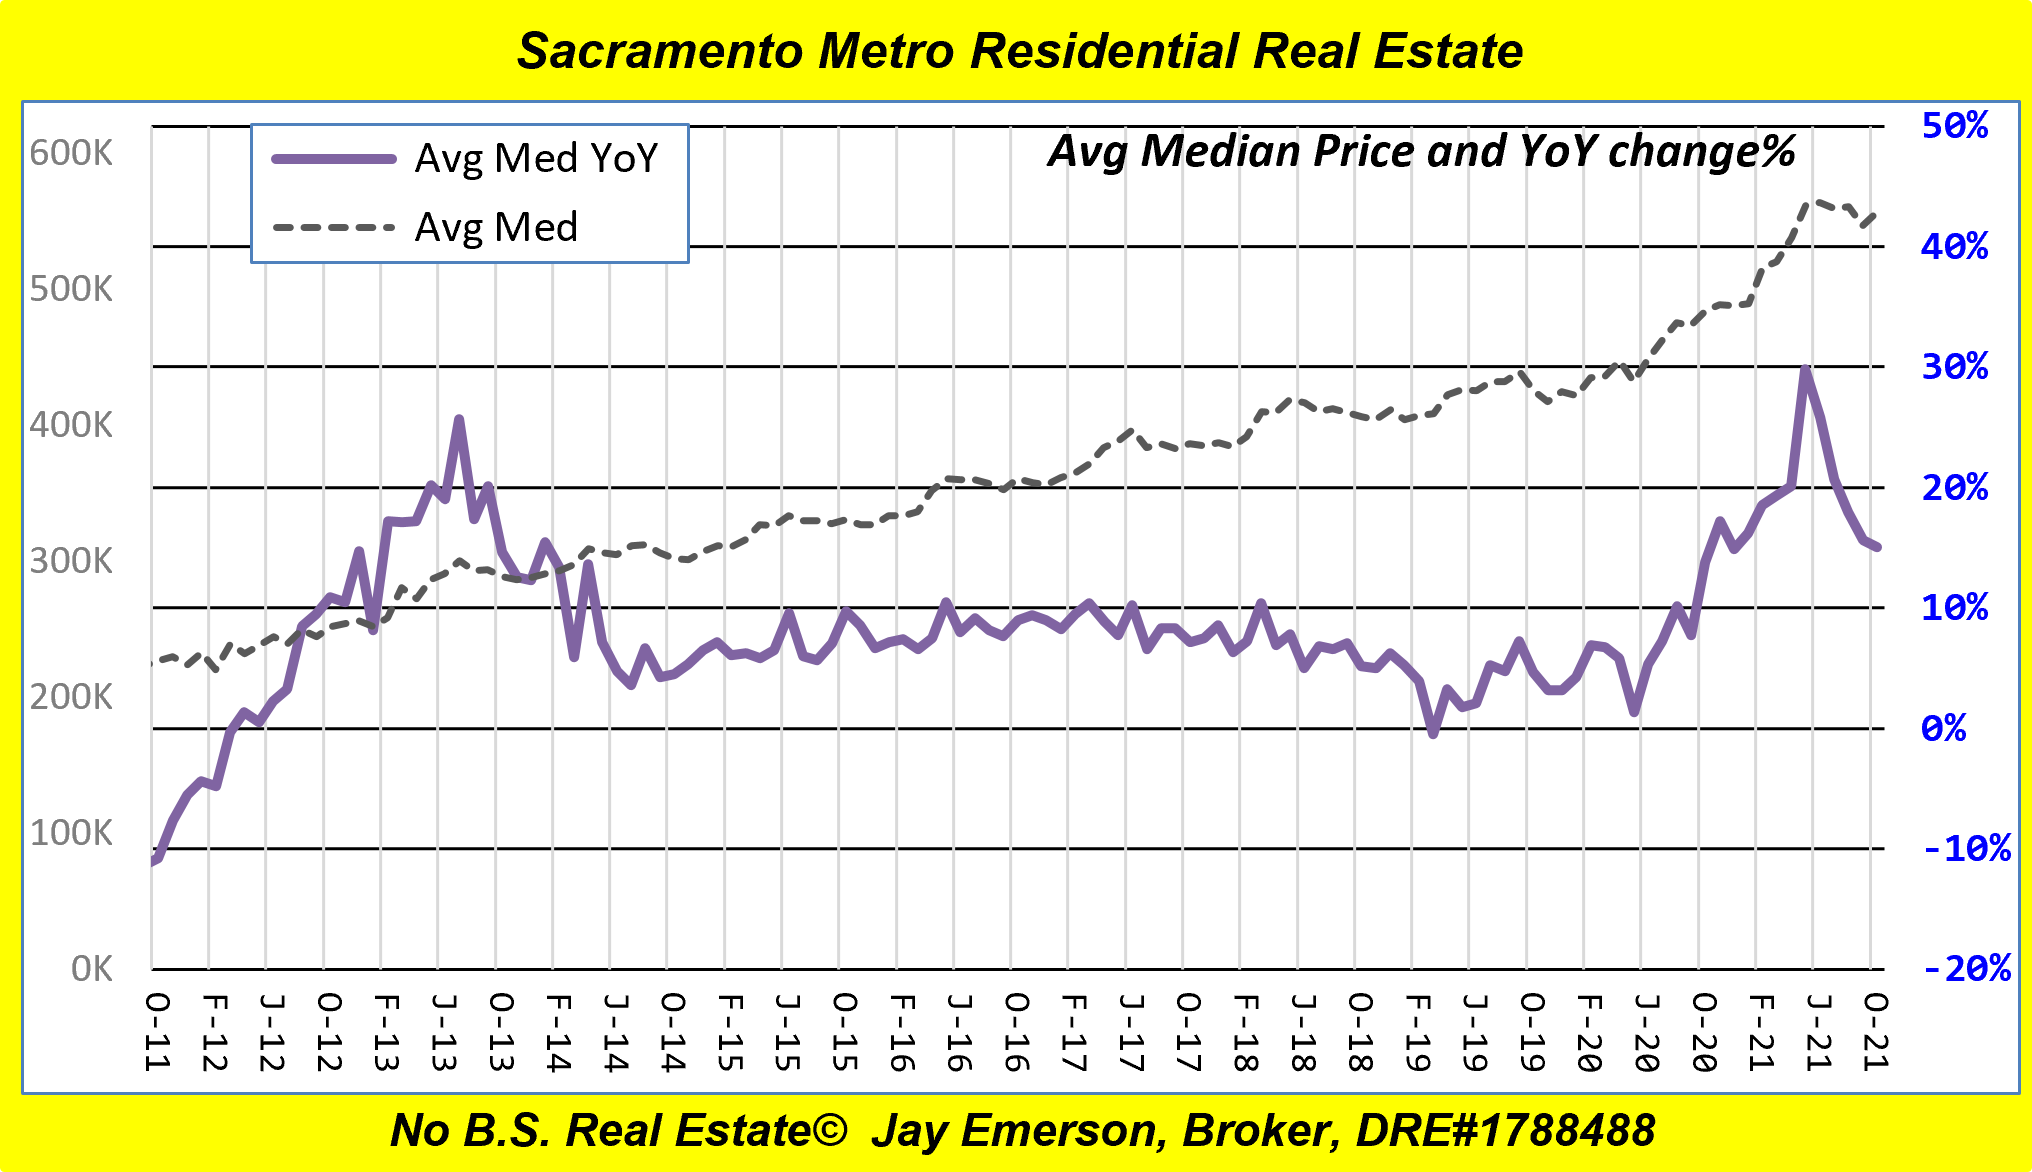
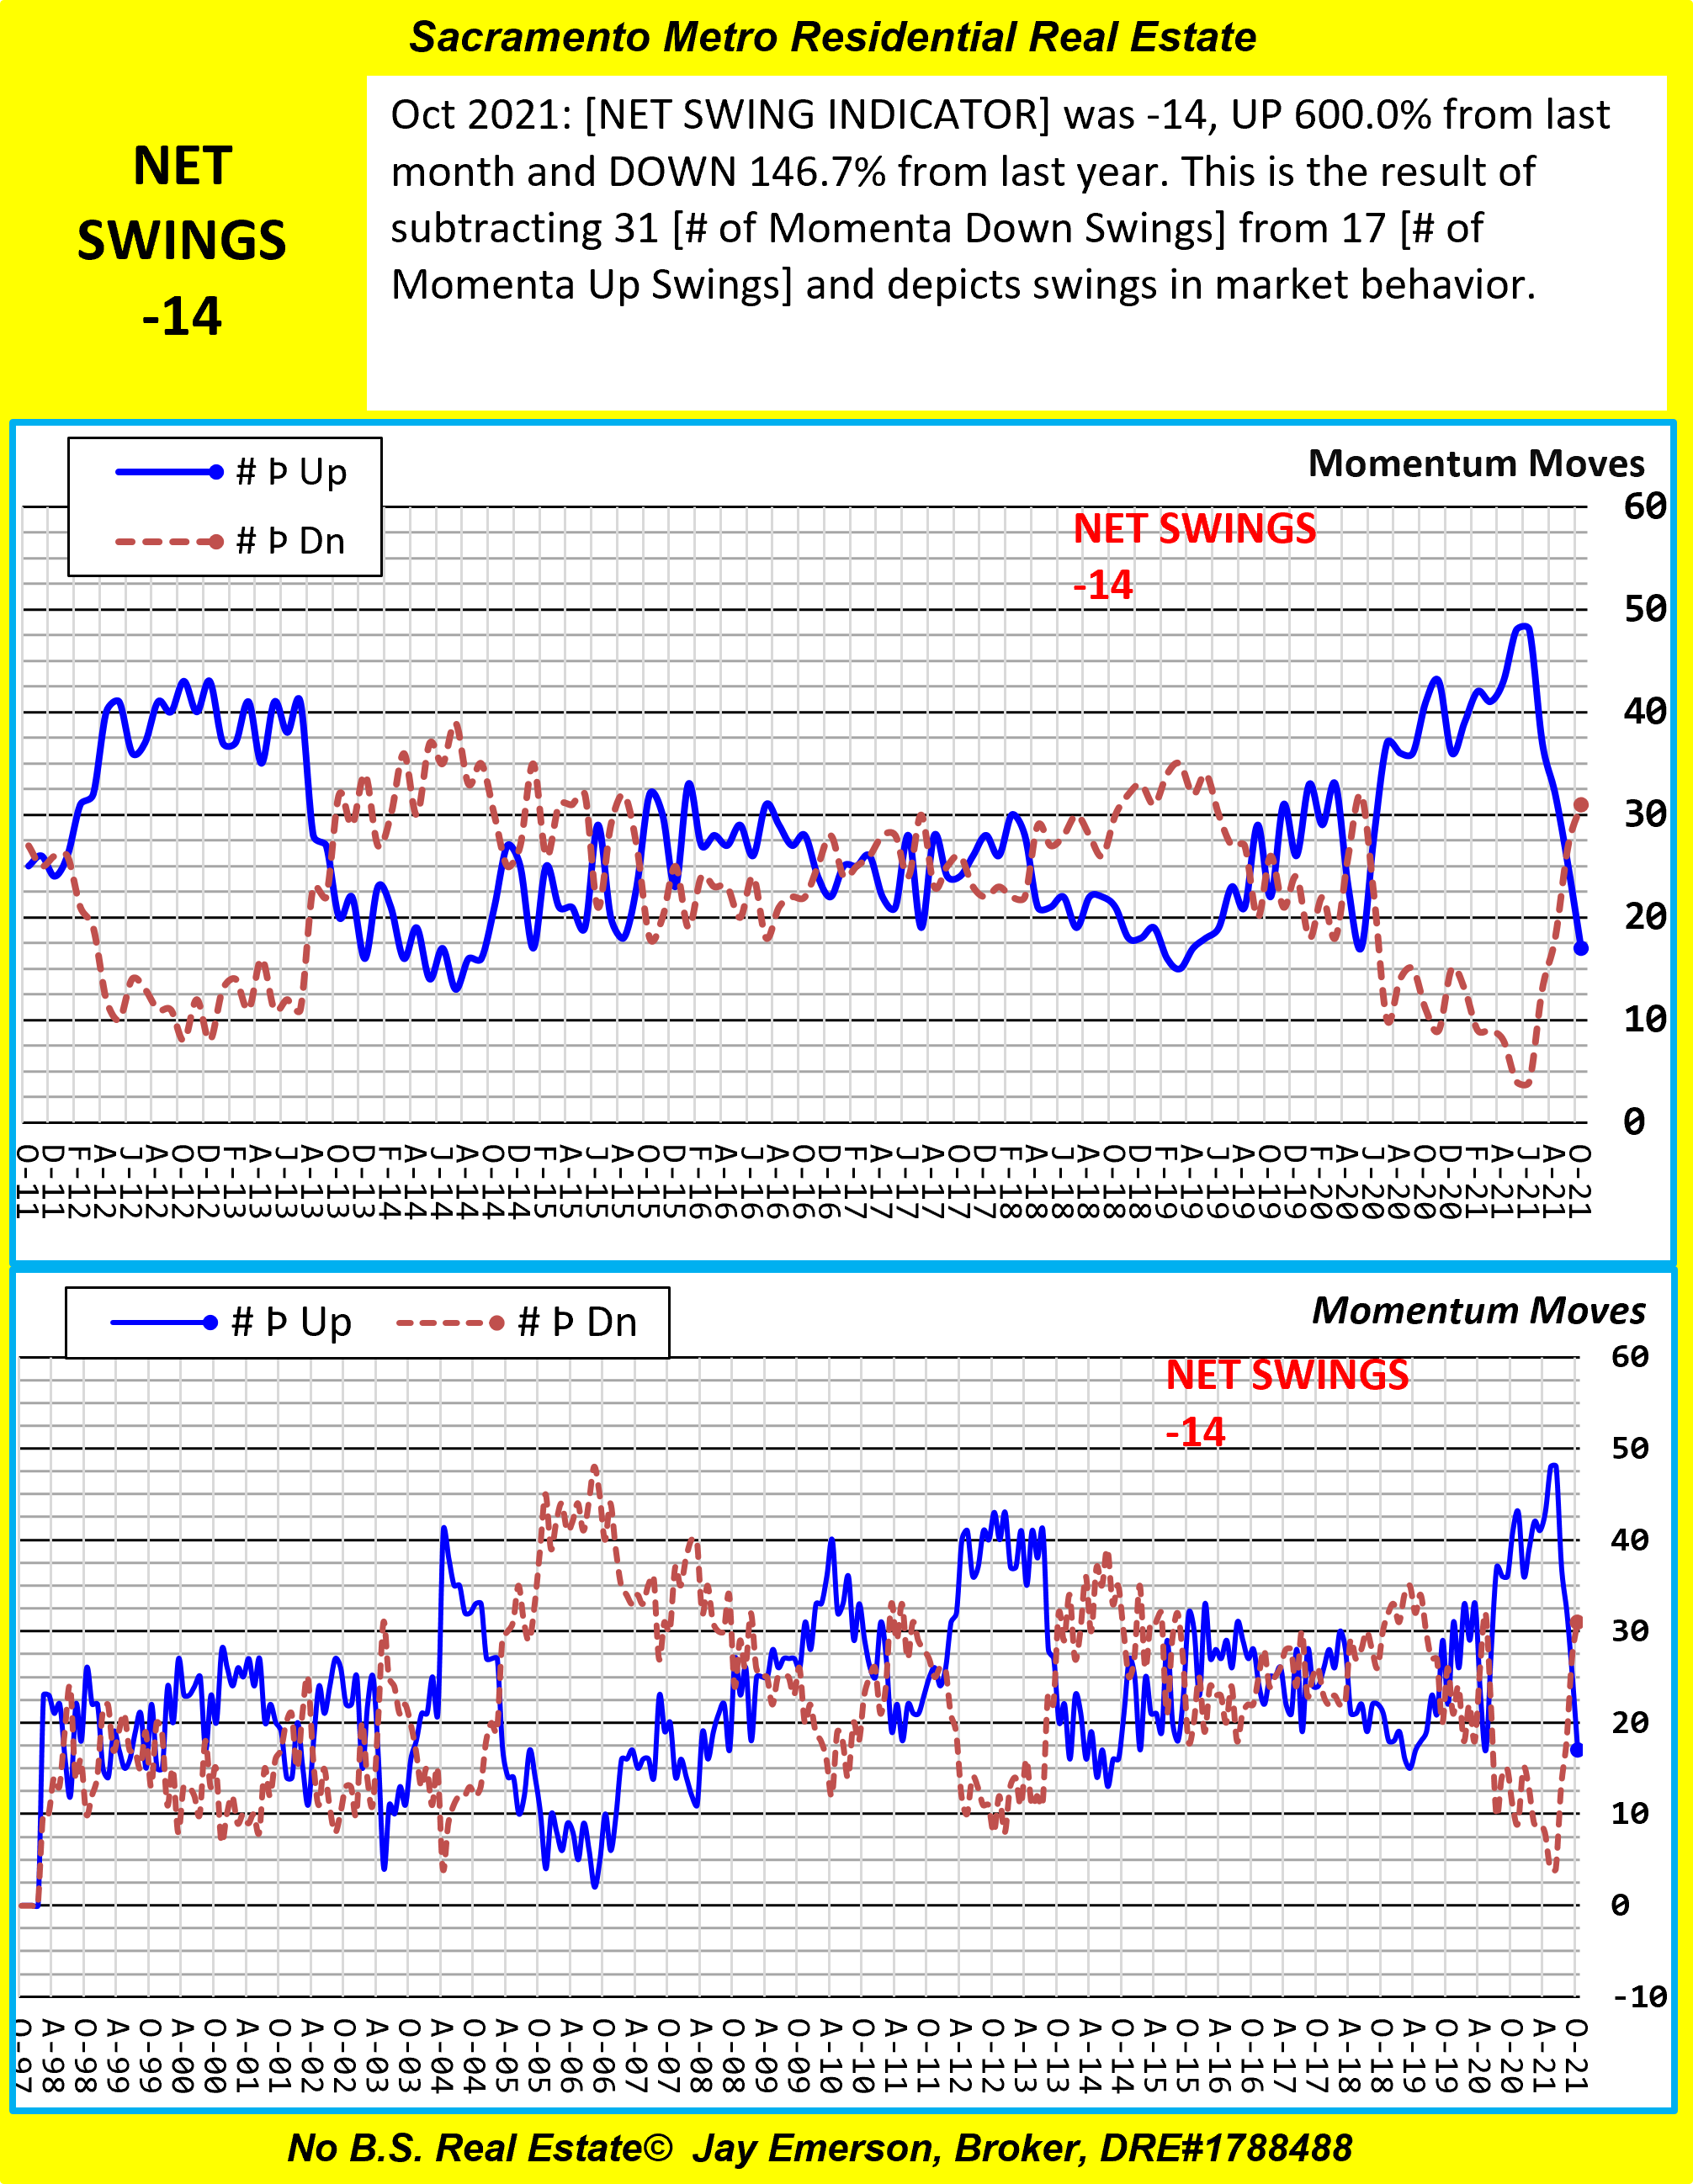
The Year over Year appreciation is coming down since the peak in May 2021 of 29%. Price appreciation of 1-4% is reasonable. And yes, some years it can AND SHOULD BE negative. As you can see, appreciation and momentum indeed had years of negative growth until 2012 when this bull market started.
[/responsivevoice]
[responsivevoice]
Senate Bills and Supply
When supply is so low that normal demand makes prices ‘hit the moon’, you know that something is affecting SUPPLY, not DEMAND. Hello. We have supply issues but allowing homeowners to put an additional 10 homes on their parcel will have dire consequences.
First, it’s my opinion that NOT all humans are supposed to own a home. According to the exalted ones in California’s legislature, SB 9 and SB 10 will solve the supply shortage. In reality, some of the consequences that my small mind can foresee include:
- What is the limit when these bills don’t have any impact on supply?
- When a planned community is required to allow owners to put duplexes in their backyards, can the HOA levy dues on those new “members”?
- And will these new HOA members be liable for all CC&Rs? What about Mello Roos?
- Will sanitation be increased? The number of vehicles will increase. Where will the cars and cans fit on the crowded curb?
- Will these new units be connected to existing sewers? Were those existing sewers engineered for the additional “material”?
- Will these new units require solar? If natural gas is allowed, will the new units get their own hookups, meters, and plumbing?
We have a supply problem but splitting, re-zoning, and allowing dense, new construction will have dramatic repercussions on neighborhoods and neighbors.
We have a professional lobbying group called the California Association of REALTORs. That group is funded by REALTORs to demand reason from the exalted ones in Sacramento. They are failing in that duty. Yes, it’s a DUTY, not a hobby for the lobby. This is the same lobby that creates the documents we use in our profession. And that, too, is failing in my opinion (Truth).
Like organic systems, markets heal themselves. Our “fixes” of perceived problems
- usually worsen the situation,
- won’t allow the market/system to heal itself while being boosted and pulled,
- usually aren’t examined for their potential consequences,
- are assumed to do ONLY good,
- are stacked on our previous fixes which aren’t re-examined,
- are not tracked and improved,
- add costs and burdens,
- COULD be drafted for bad outcomes,
- WILL be drafted by imperfect people, and
- I’ve run out of my quota for bullets
To all of you exalted ones in Sacramento, YOU’RE FIRED!
[/responsivevoice]
Sacramento County zip codes
- Carmichael 95608 – Median $553K, (Þ▼,MoM▼-4.8% ,YoY▲9.5%) – Appetite 90.5% – Turnover 100.0% – Consumption 95.1%
- Citrus Heights 95610 – Median $495K, (Þ▼,MoM▼-3.9% ,YoY▲15.9%) – Appetite 123.7% – Turnover 163.3% – Consumption 141.2%
- Citrus Heights 95621 – Median $455K, (Þ▲,MoM▲1.1%,YoY▲21.7%) – Appetite 120.0% – Turnover 300.0% – Consumption 173.7%
- Elk Grove 95624 – Median $620K, (Þ▼,MoM◄►0.0%,YoY▲21.6%) – Appetite 106.3% – Turnover 122.4% – Consumption 113.3%
- Fair Oaks 95628 – Median $625K, (Þ▲,MoM▲14.7%,YoY▲28.9%) – Appetite 96.0% – Turnover 147.4% – Consumption 118.2%
- Folsom 95630 – Median $725K, (Þ▲,MoM▲5.1%,YoY▲19.8%) – Appetite 93.2% – Turnover 107.0% – Consumption 100.0%
- North Highlnds 95660 – Median $378K, (Þ▲,MoM▲2.2%,YoY▲21.9%) – Appetite 102.9% – Turnover 148.0% – Consumption 121.7%
- Orangevale 95662 – Median $557K, (Þ▲,MoM▲13.7%,YoY▲17.3%) – Appetite 107.1% – Turnover 103.0% – Consumption 105.3%
- Rancho Cordova 95670 – Median $495K, (Þ▲,MoM▲4.0%,YoY▲25.3%) – Appetite 93.7% – Turnover 135.4% – Consumption 109.4%
- Rio Linda 95673 – Median $425K, (Þ▼,MoM▲3.9%,YoY▲12.4%) – Appetite 91.3% – Turnover 83.3% – Consumption 87.8%
- Rancho Cordova 95742 – Median $596K, (Þ◄►,MoM▼-7.3% ,YoY▲20.4%) – Appetite 103.7% – Turnover 152.9% – Consumption 122.7%
- Elk Grove 95757 – Median $707K (NEW HIGH) (Þ▲,MoM▲5.1%,YoY▲29.5%) – Appetite 135.5% – Turnover 293.8% – Consumption 189.4%
- Elk Grove 95758 – Median $573K (NEW HIGH) (Þ▲,MoM▲0.5%,YoY▲25.9%) – Appetite 104.8% – Turnover 206.3% – Consumption 138.9%
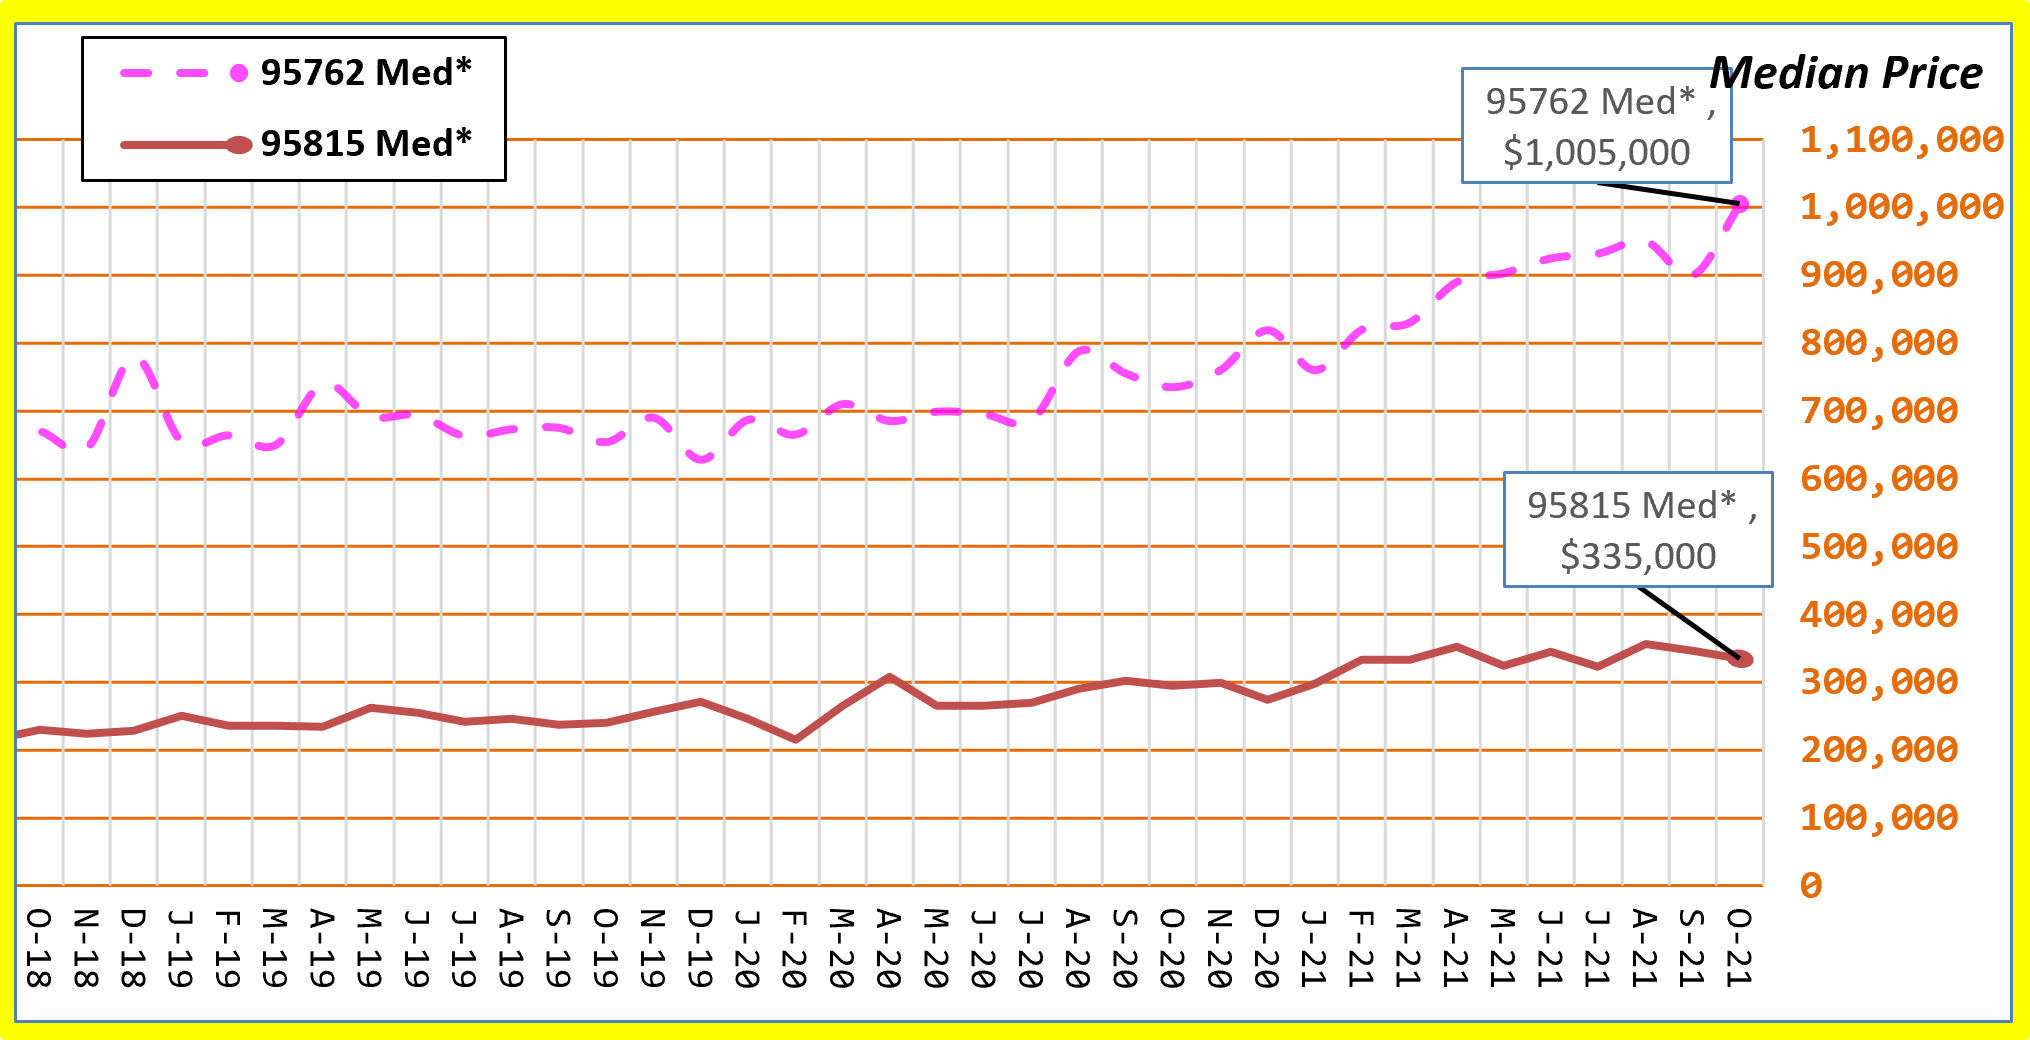
- Arden 95815 – Median $335K, (Þ▼,MoM▼-3.2% ,YoY▲13.6%) – Appetite 150.0% – Turnover 123.5% – Consumption 137.8%
- Downtown 95816 – Median $635K, (Þ▼,MoM▼-10.6% ,YoY▼-0.3%) – Appetite 84.6% – Turnover 43.5% – Consumption 58.3%
- Oak Park 95817 – Median $482K, (Þ▼,MoM▼-4.2% ,YoY▲14.2%) – Appetite 75.0% – Turnover 71.4% – Consumption 73.3%
- Land Park 95818 – Median $663K, (Þ▼,MoM▼-8.9% ,YoY▲8.5%) – Appetite 156.3% – Turnover 145.5% – Consumption 150.0%
- East Sacramento 95819 – Median $775K, (Þ▲,MoM▲5.0%,YoY▲25.0%) – Appetite 121.7% – Turnover 85.2% – Consumption 102.0%
- Elder Creek 95820 – Median $411K, (Þ▼,MoM▲5.4%,YoY▲16.1%) – Appetite 105.4% – Turnover 74.5% – Consumption 91.3%
- Arden 95821 – Median $500K, (Þ▲,MoM▲16.3%,YoY▲26.6%) – Appetite 121.2% – Turnover 106.1% – Consumption 113.6%
- Greenhaven 95822 – Median $425K, (Þ▼,MoM◄►0.0%,YoY▲9.0%) – Appetite 114.3% – Turnover 162.1% – Consumption 135.9%
- Franklin 95823 – Median $417K, (Þ▼,MoM▲0.2%,YoY▲19.1%) – Appetite 104.1% – Turnover 123.7% – Consumption 112.6%
- Fruitridge 95824 – Median $350K, (Þ▼,MoM▲4.2%,YoY▲12.9%) – Appetite 157.1% – Turnover 147.1% – Consumption 151.6%
- Arden 95825 – Median $493K, (Þ▲,MoM▲10.8%,YoY▲26.1%) – Appetite 122.2% – Turnover 200.0% – Consumption 158.8%
- College Greens 95826 – Median $455K, (Þ▼,MoM▲0.2%,YoY▲14.3%) – Appetite 90.9% – Turnover 110.7% – Consumption 98.6%
- Rosemont 95827 – Median $445K, (Þ▼,MoM▼-3.3% ,YoY▲13.2%) – Appetite 111.1% – Turnover 262.5% – Consumption 157.7%
- Florin 95828 – Median $495K (NEW HIGH) (Þ▲,MoM▲15.1%,YoY▲33.8%) – Appetite 105.9% – Turnover 71.7% – Consumption 86.3%
- Vineyard 95829 – Median $538K, (Þ▼,MoM▼-2.2% ,YoY▲2.5%) – Appetite 122.6% – Turnover 163.2% – Consumption 138.0%
- Pocket 95831 – Median $589K, (Þ▼,MoM▲3.3%,YoY▼-1.8%) – Appetite 100.0% – Turnover 127.8% – Consumption 111.9%
- Natomas 95833 – Median $445K, (Þ▼,MoM▼-3.3% ,YoY▲17.1%) – Appetite 152.4% – Turnover 292.9% – Consumption 208.6%
- Natomas 95834 – Median $525K, (Þ▼,MoM▼-0.8% ,YoY▲16.7%) – Appetite 106.1% – Turnover 166.7% – Consumption 129.6%
- Natomas 95835 – Median $548K, (Þ▼,MoM▼-4.7% ,YoY▲19.1%) – Appetite 117.3% – Turnover 166.7% – Consumption 135.4%
- Del Paso Heights 95838 – Median $380K, (Þ▲,MoM▲7.0%,YoY▲33.3%) – Appetite 92.9% – Turnover 94.7% – Consumption 93.8%
- North Sacramento 95841 – Median $485K (NEW HIGH) (Þ▼,MoM▲8.7%,YoY▲7.1%) – Appetite 100.0% – Turnover 80.0% – Consumption 92.0%
- Foothill Farms 95842 – Median $412K, (Þ▼,MoM▼-1.9% ,YoY▲16.1%) – Appetite 122.6% – Turnover 189.5% – Consumption 148.0%
- Antelope 95843 – Median $500K (MATCHED HIGH) (Þ▲,MoM◄►0.0%,YoY▲21.1%) – Appetite 81.8% – Turnover 202.9% – Consumption 123.8%
- Arden 95864 – Median $781K, (Þ▲,MoM▲39.0%,YoY▲31.7%) – Appetite 121.4% – Turnover 153.8% – Consumption 137.0%
El Dorado County zip codes
- Placerville 95667 – Median $515K, (Þ▼,MoM▼-1.7% ,YoY▲12.0%) – Appetite 93.2% – Turnover 42.6% – Consumption 63.8%
- Cameron Pk 95682 – Median $600K, (Þ▼,MoM▼-3.2% ,YoY▲13.9%) – Appetite 142.1% – Turnover 95.0% – Consumption 117.9%
- Pollock Pines 95726 – Median $381K, (Þ▲,MoM▲0.3%,YoY▲7.0%) – Appetite 75.9% – Turnover 45.9% – Consumption 59.1%
- El Dorado Hills 95762 – Median $1,005K (NEW HIGH) (Þ▲,MoM▲11.7%,YoY▲36.7%) – Appetite 104.9% – Turnover 73.8% – Consumption 89.5%
Placer County zip codes
- Auburn 95603 – Median $639K, (Þ▼,MoM▲0.9%,YoY▲15.1%) – Appetite 112.5% – Turnover 89.6% – Consumption 98.4%
- Lincoln 95648 – Median $630K, (Þ◄►,MoM▼-3.8% ,YoY▲20.7%) – Appetite 105.8% – Turnover 114.5% – Consumption 109.5%
- Loomis 95650 – Median $940K, (Þ▼,MoM▲35.6%,YoY▼-1.1%) – Appetite 82.4% – Turnover 68.0% – Consumption 73.8%
- Roseville 95661 – Median $607K, (Þ▼,MoM▼-7.0% ,YoY▲3.2%) – Appetite 160.7% – Turnover 227.8% – Consumption 187.0%
- Rocklin 95677 – Median $675K, (Þ◄►,MoM▲5.5%,YoY▲16.8%) – Appetite 102.6% – Turnover 100.0% – Consumption 101.6%
- Roseville 95678 – Median $500K, (Þ▼,MoM▼-9.3% ,YoY▲4.4%) – Appetite 123.5% – Turnover 114.8% – Consumption 119.7%
- Granite Bay 95746 – Median $900K, (Þ▼,MoM▼-15.4% ,YoY▼-14.7%) – Appetite 68.8% – Turnover 71.9% – Consumption 70.3%
- Roseville 95747 – Median $647K, (Þ◄►,MoM▼-3.9% ,YoY▲19.2%) – Appetite 102.6% – Turnover 117.2% – Consumption 109.2%
- Rocklin 95765 – Median $670K, (Þ▼,MoM▲3.1%,YoY▲16.5%) – Appetite 100.0% – Turnover 196.8% – Consumption 131.6%
Yolo County zip codes
- West Sac 95605 – Median $415K, (Þ▼,MoM▼-6.7% ,YoY▲6.4%) – Appetite 50.0% – Turnover 70.0% – Consumption 61.1%
- West Sacramento 95691 – Median $545K, (Þ▲,MoM▼-3.0% ,YoY▲21.1%) – Appetite 102.6% – Turnover 226.3% – Consumption 143.1%
Please go to https://jayemerson.com/blog/ and subscribe in the right sidebar.
