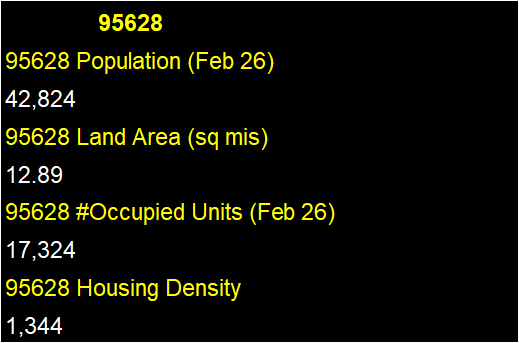
Fair Oaks is a single zip code north of the river, west of Folsom, and tangent to Orangevale, Carmichael and Citrus Heights (95610).
https://www.unitedstateszipcodes.org/95628/
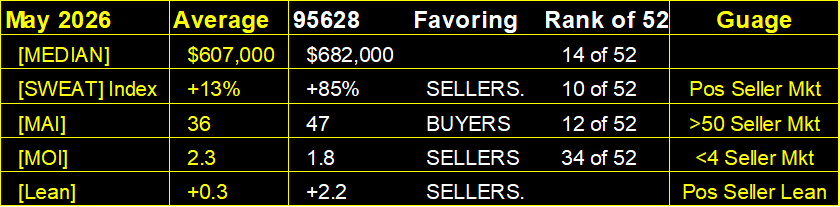
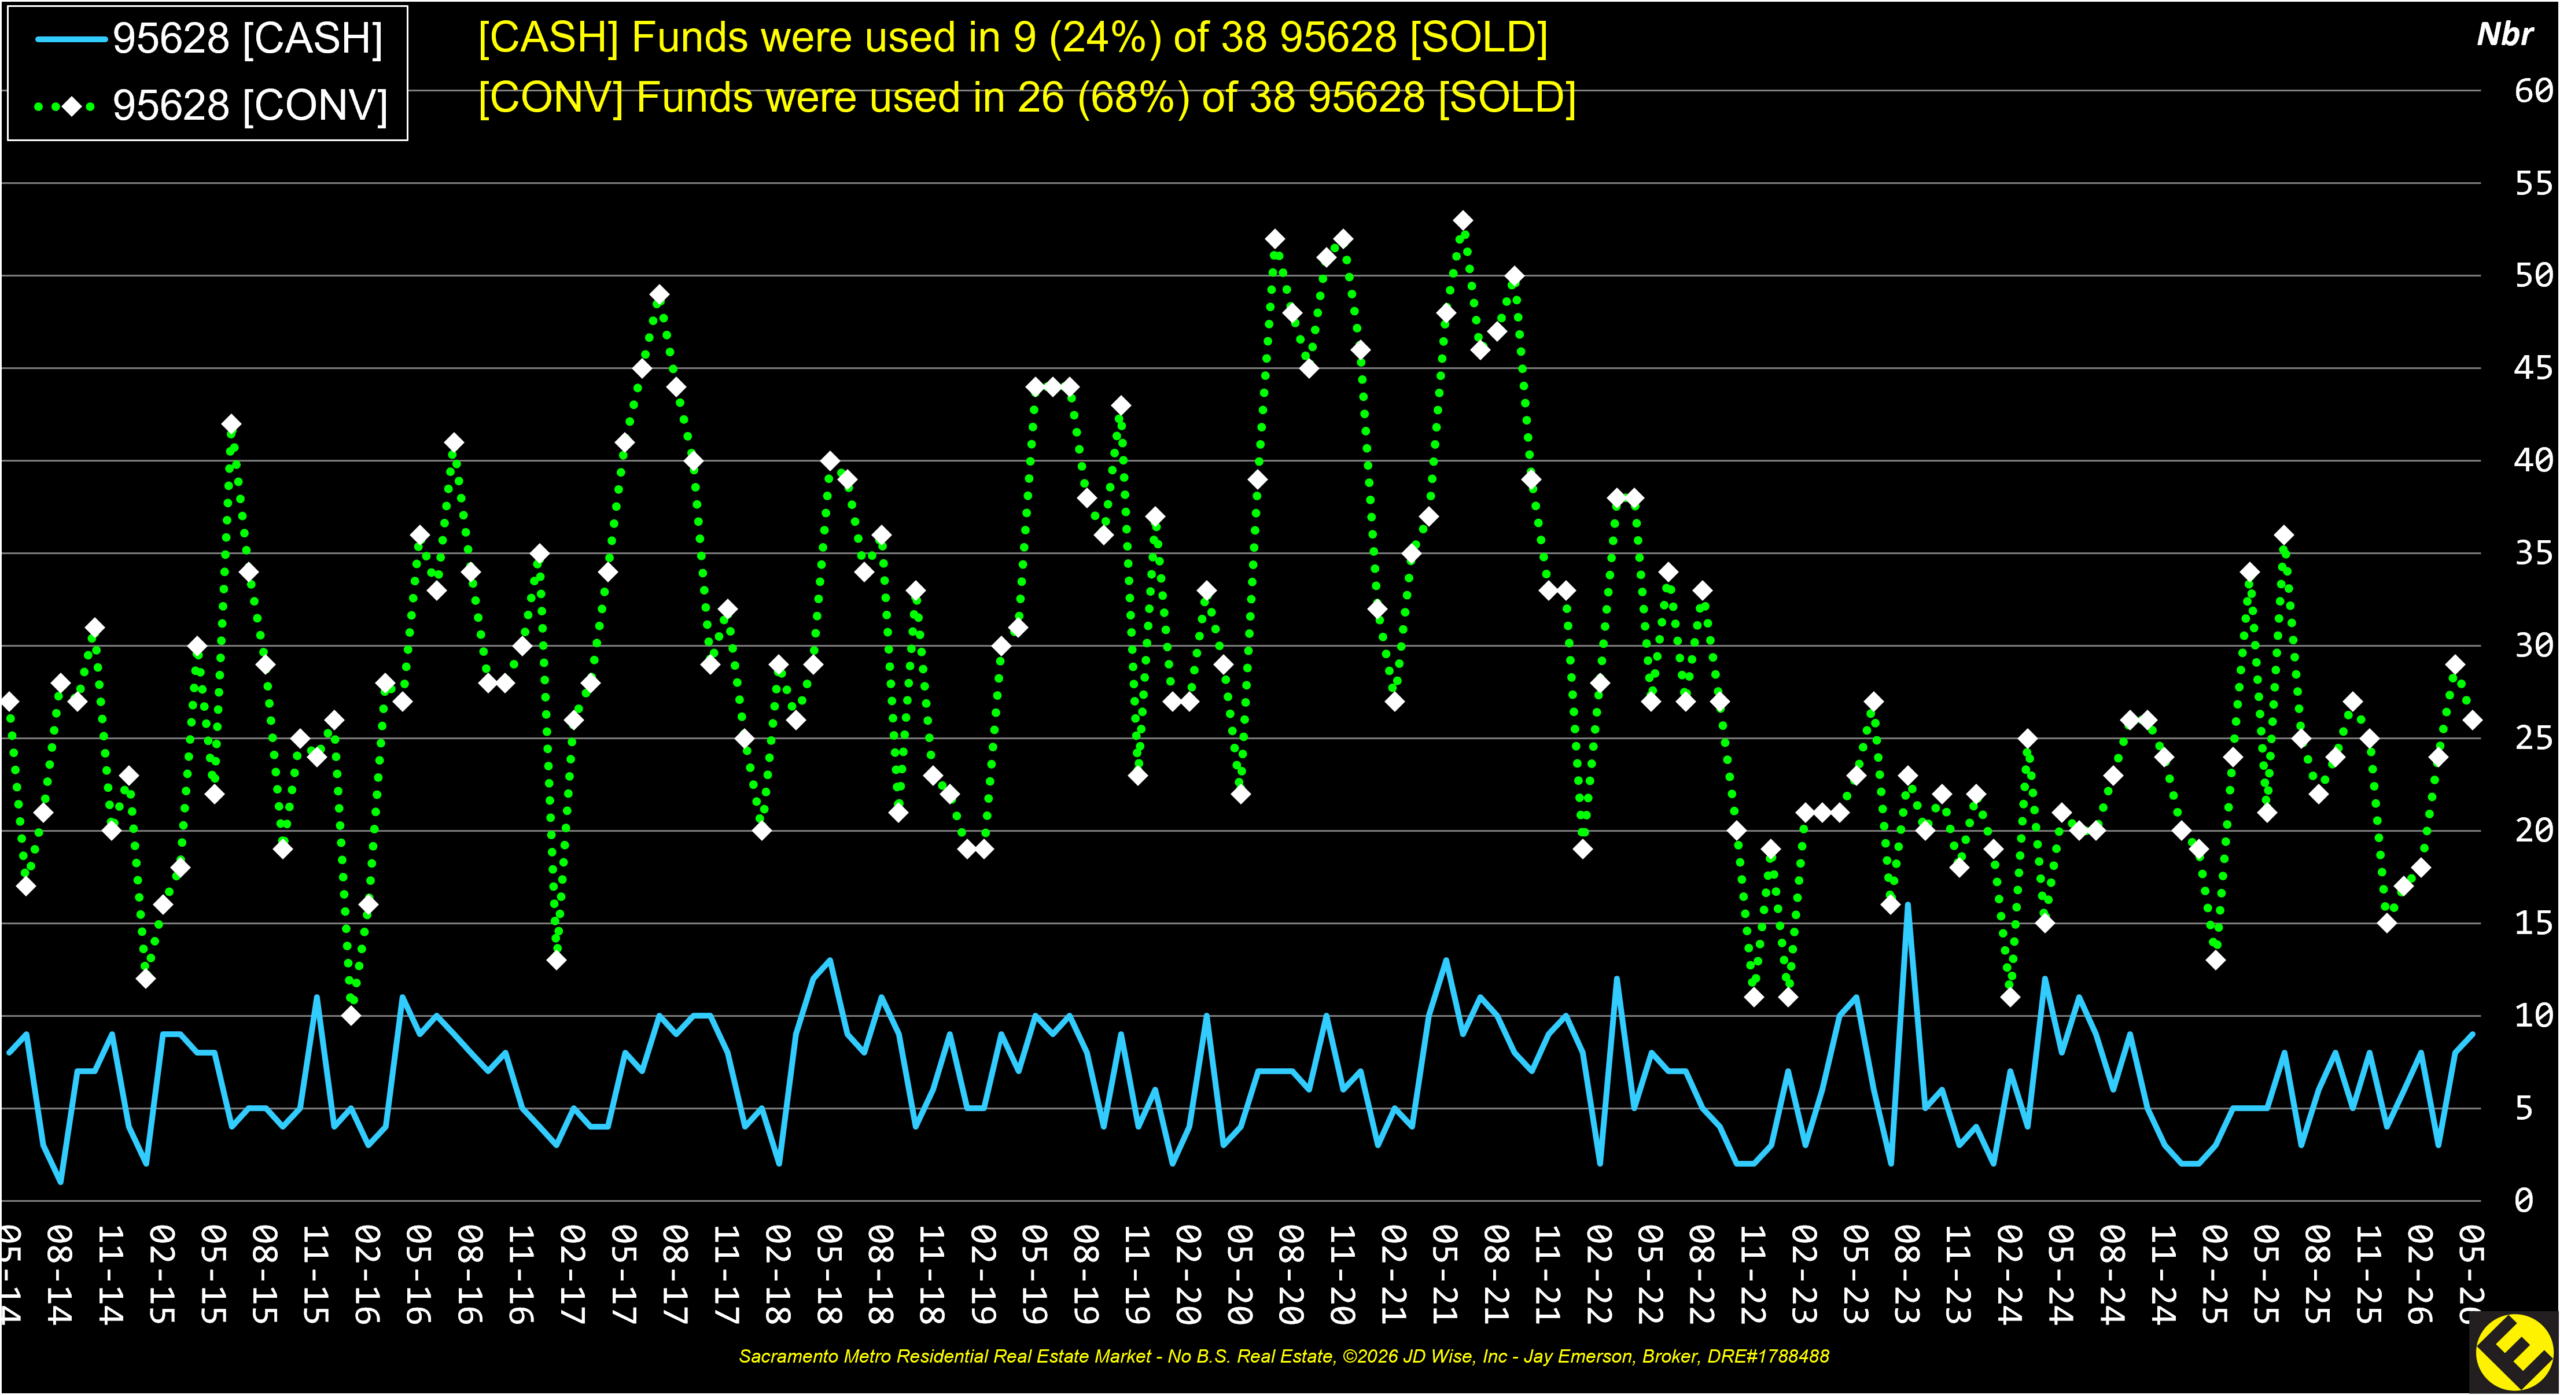
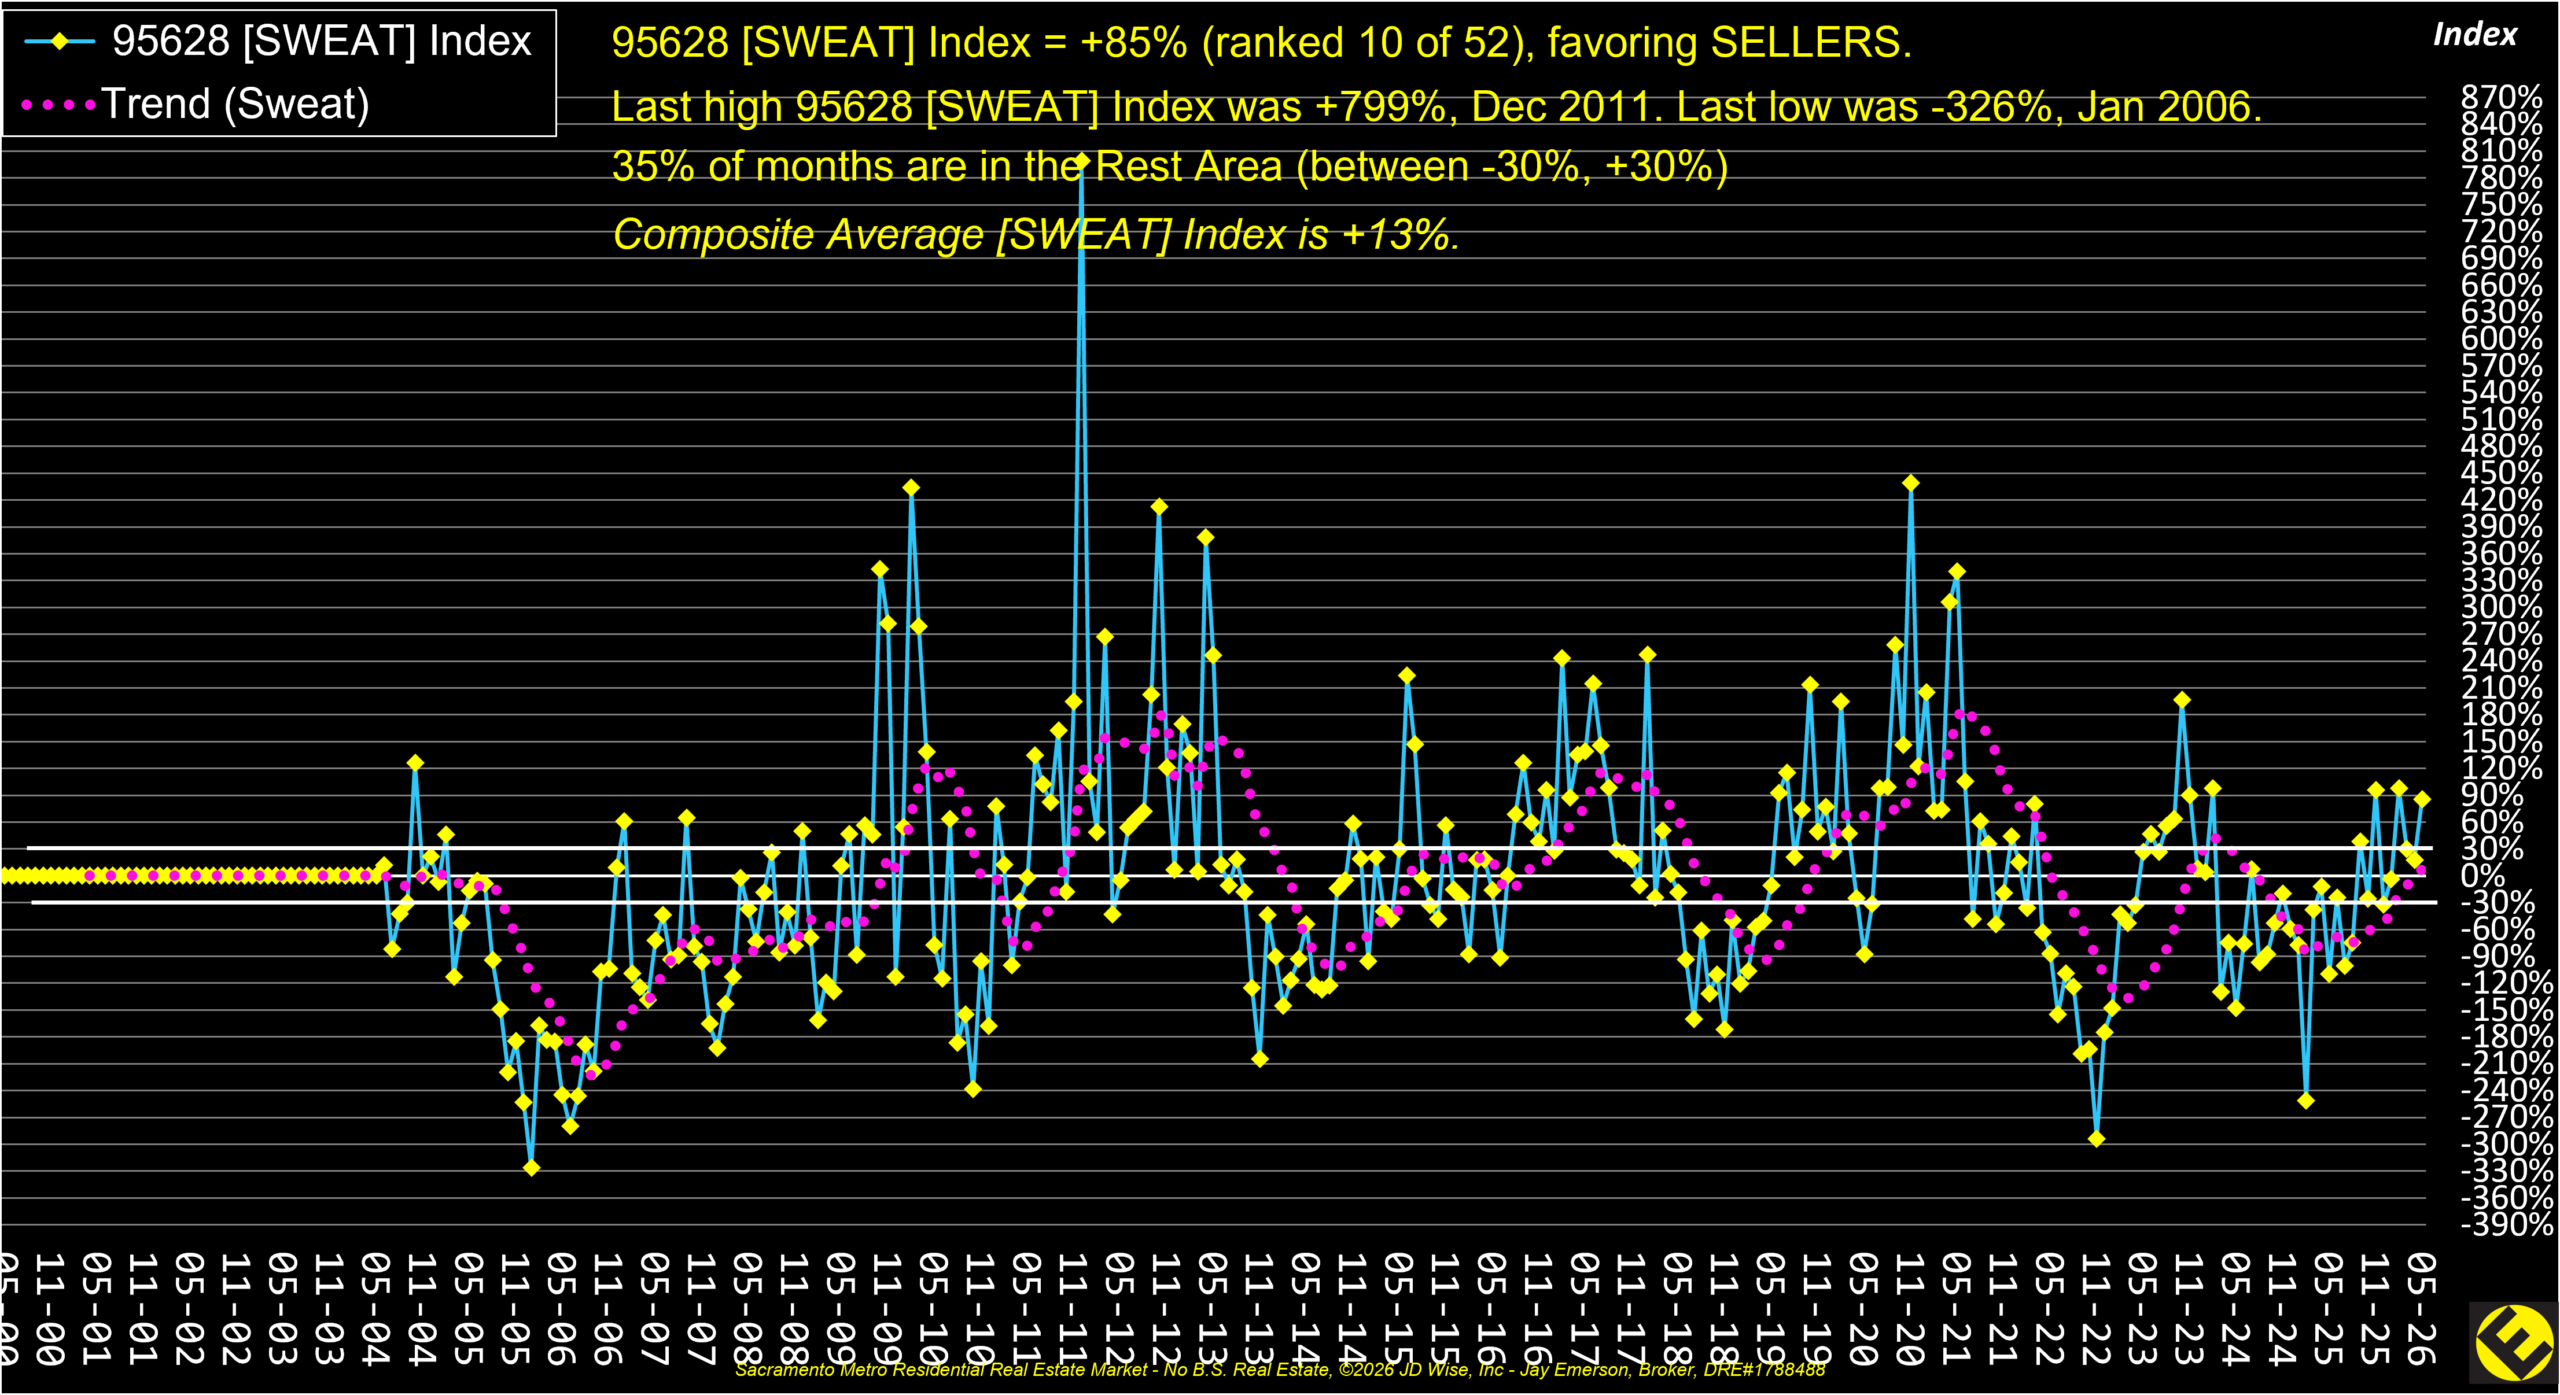
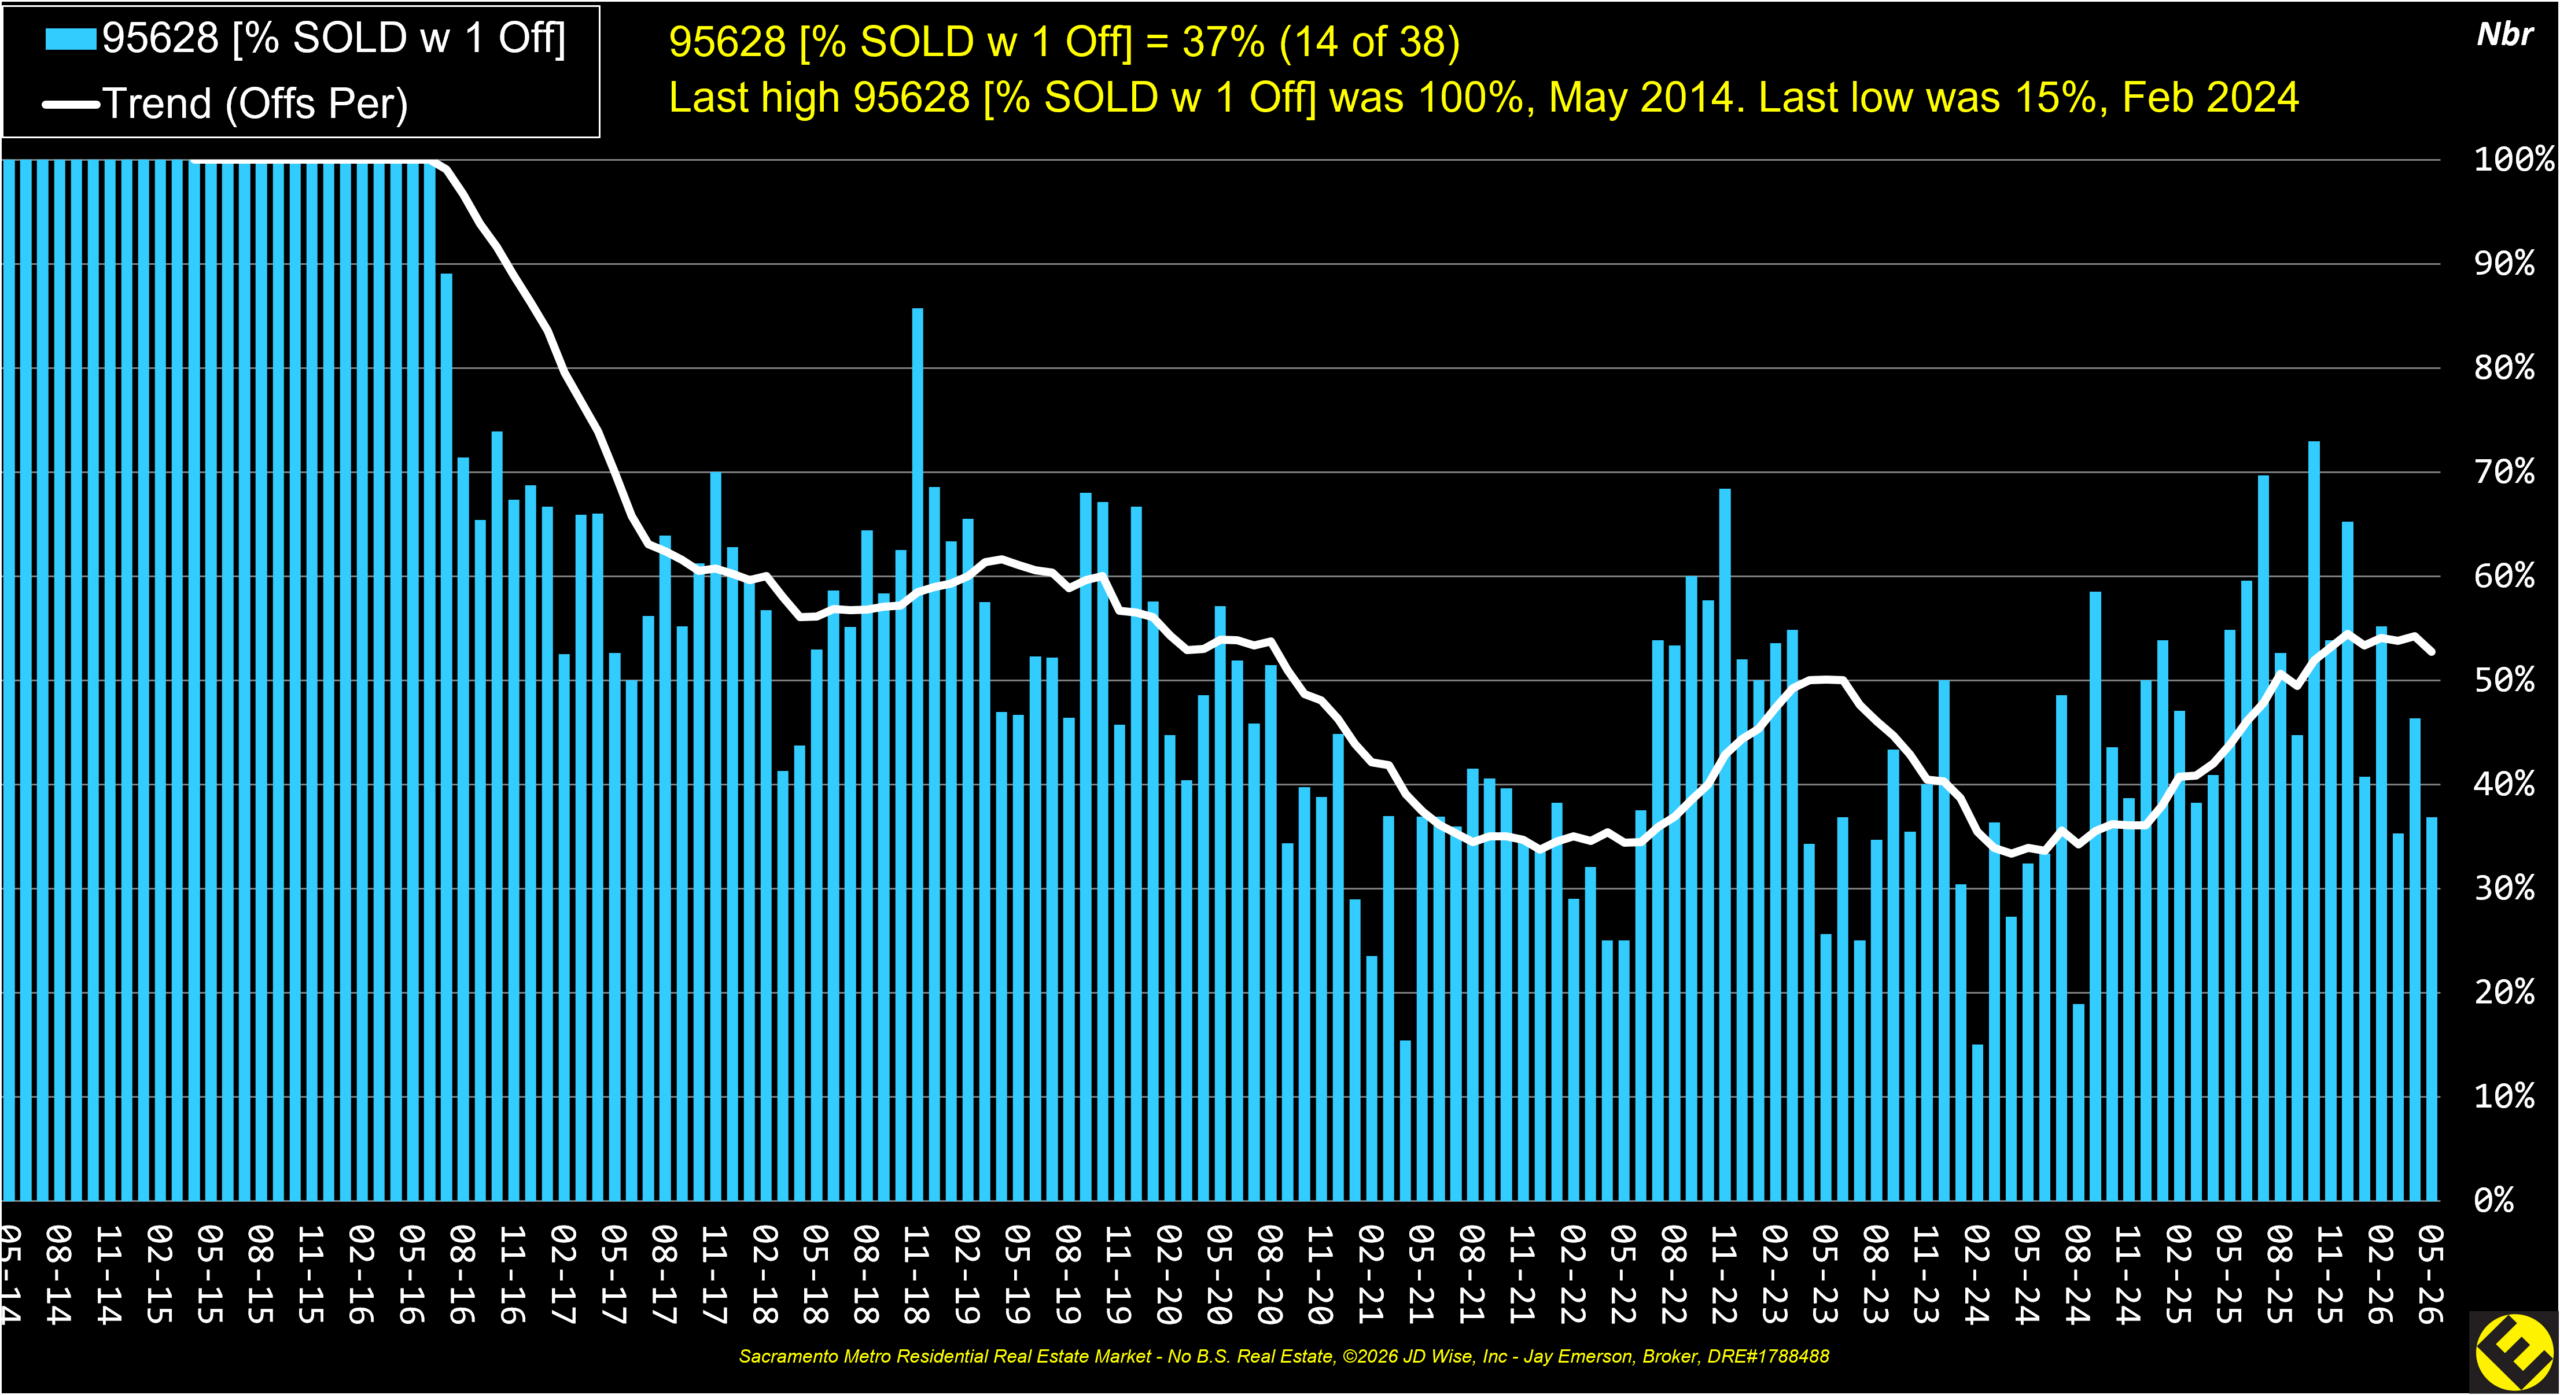
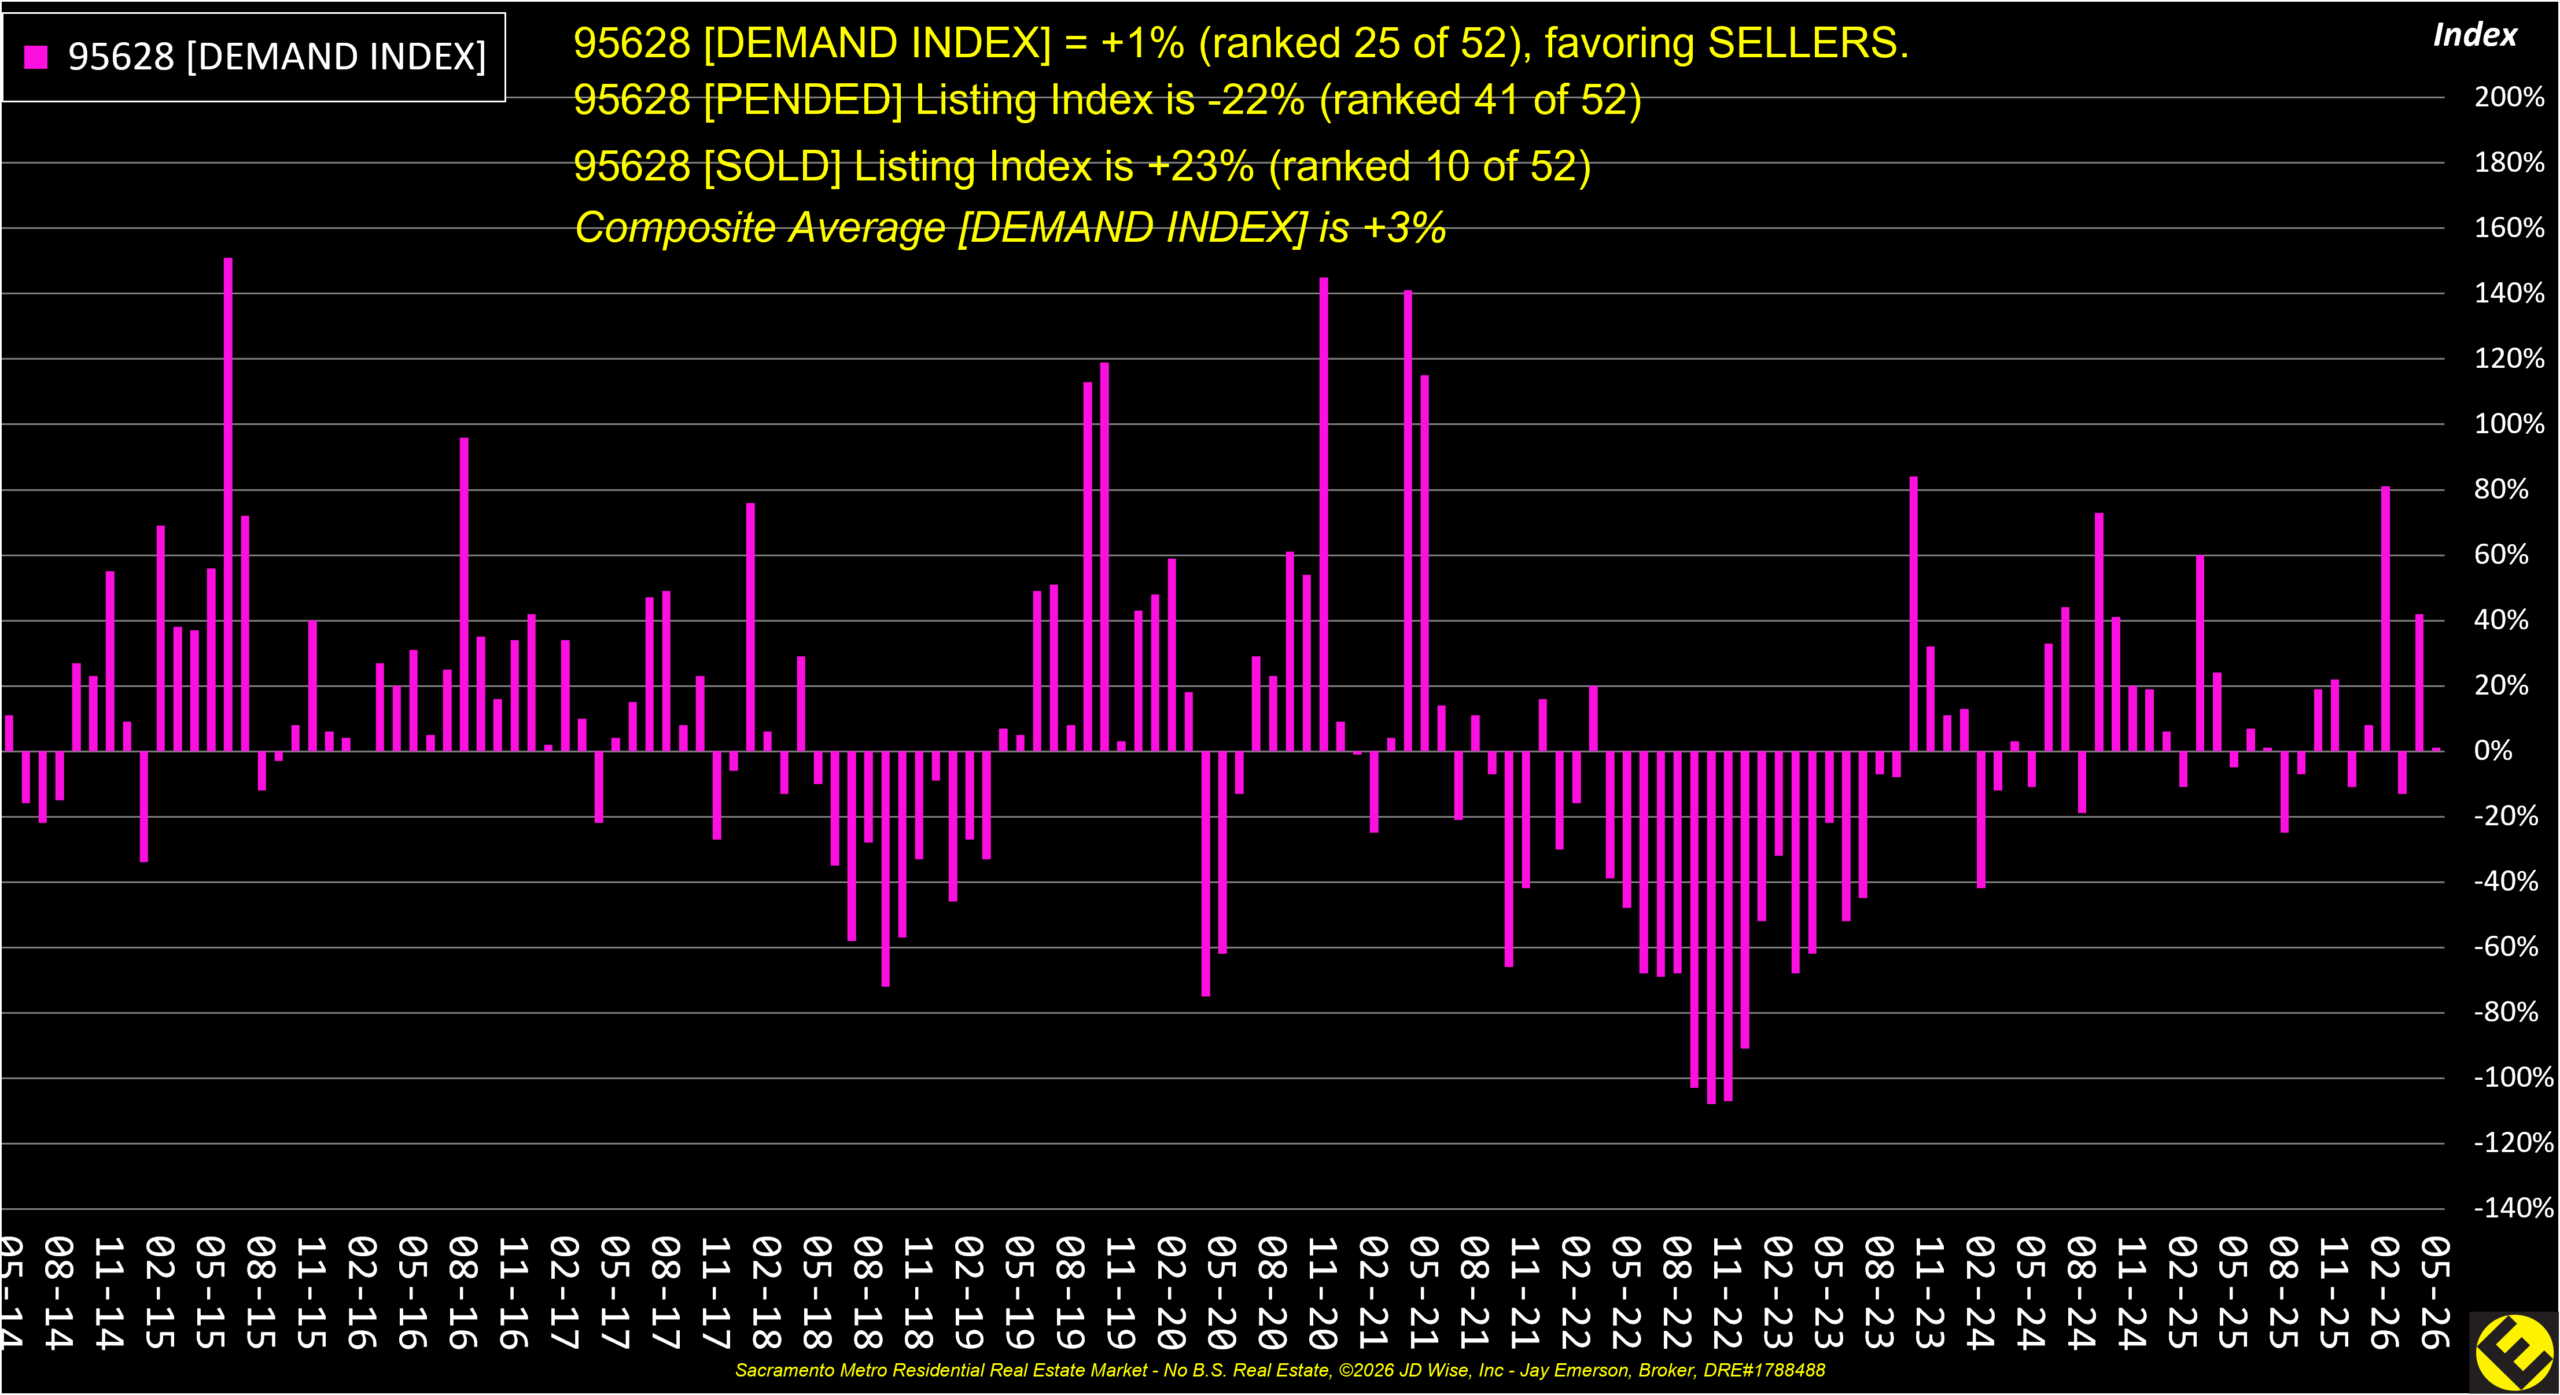
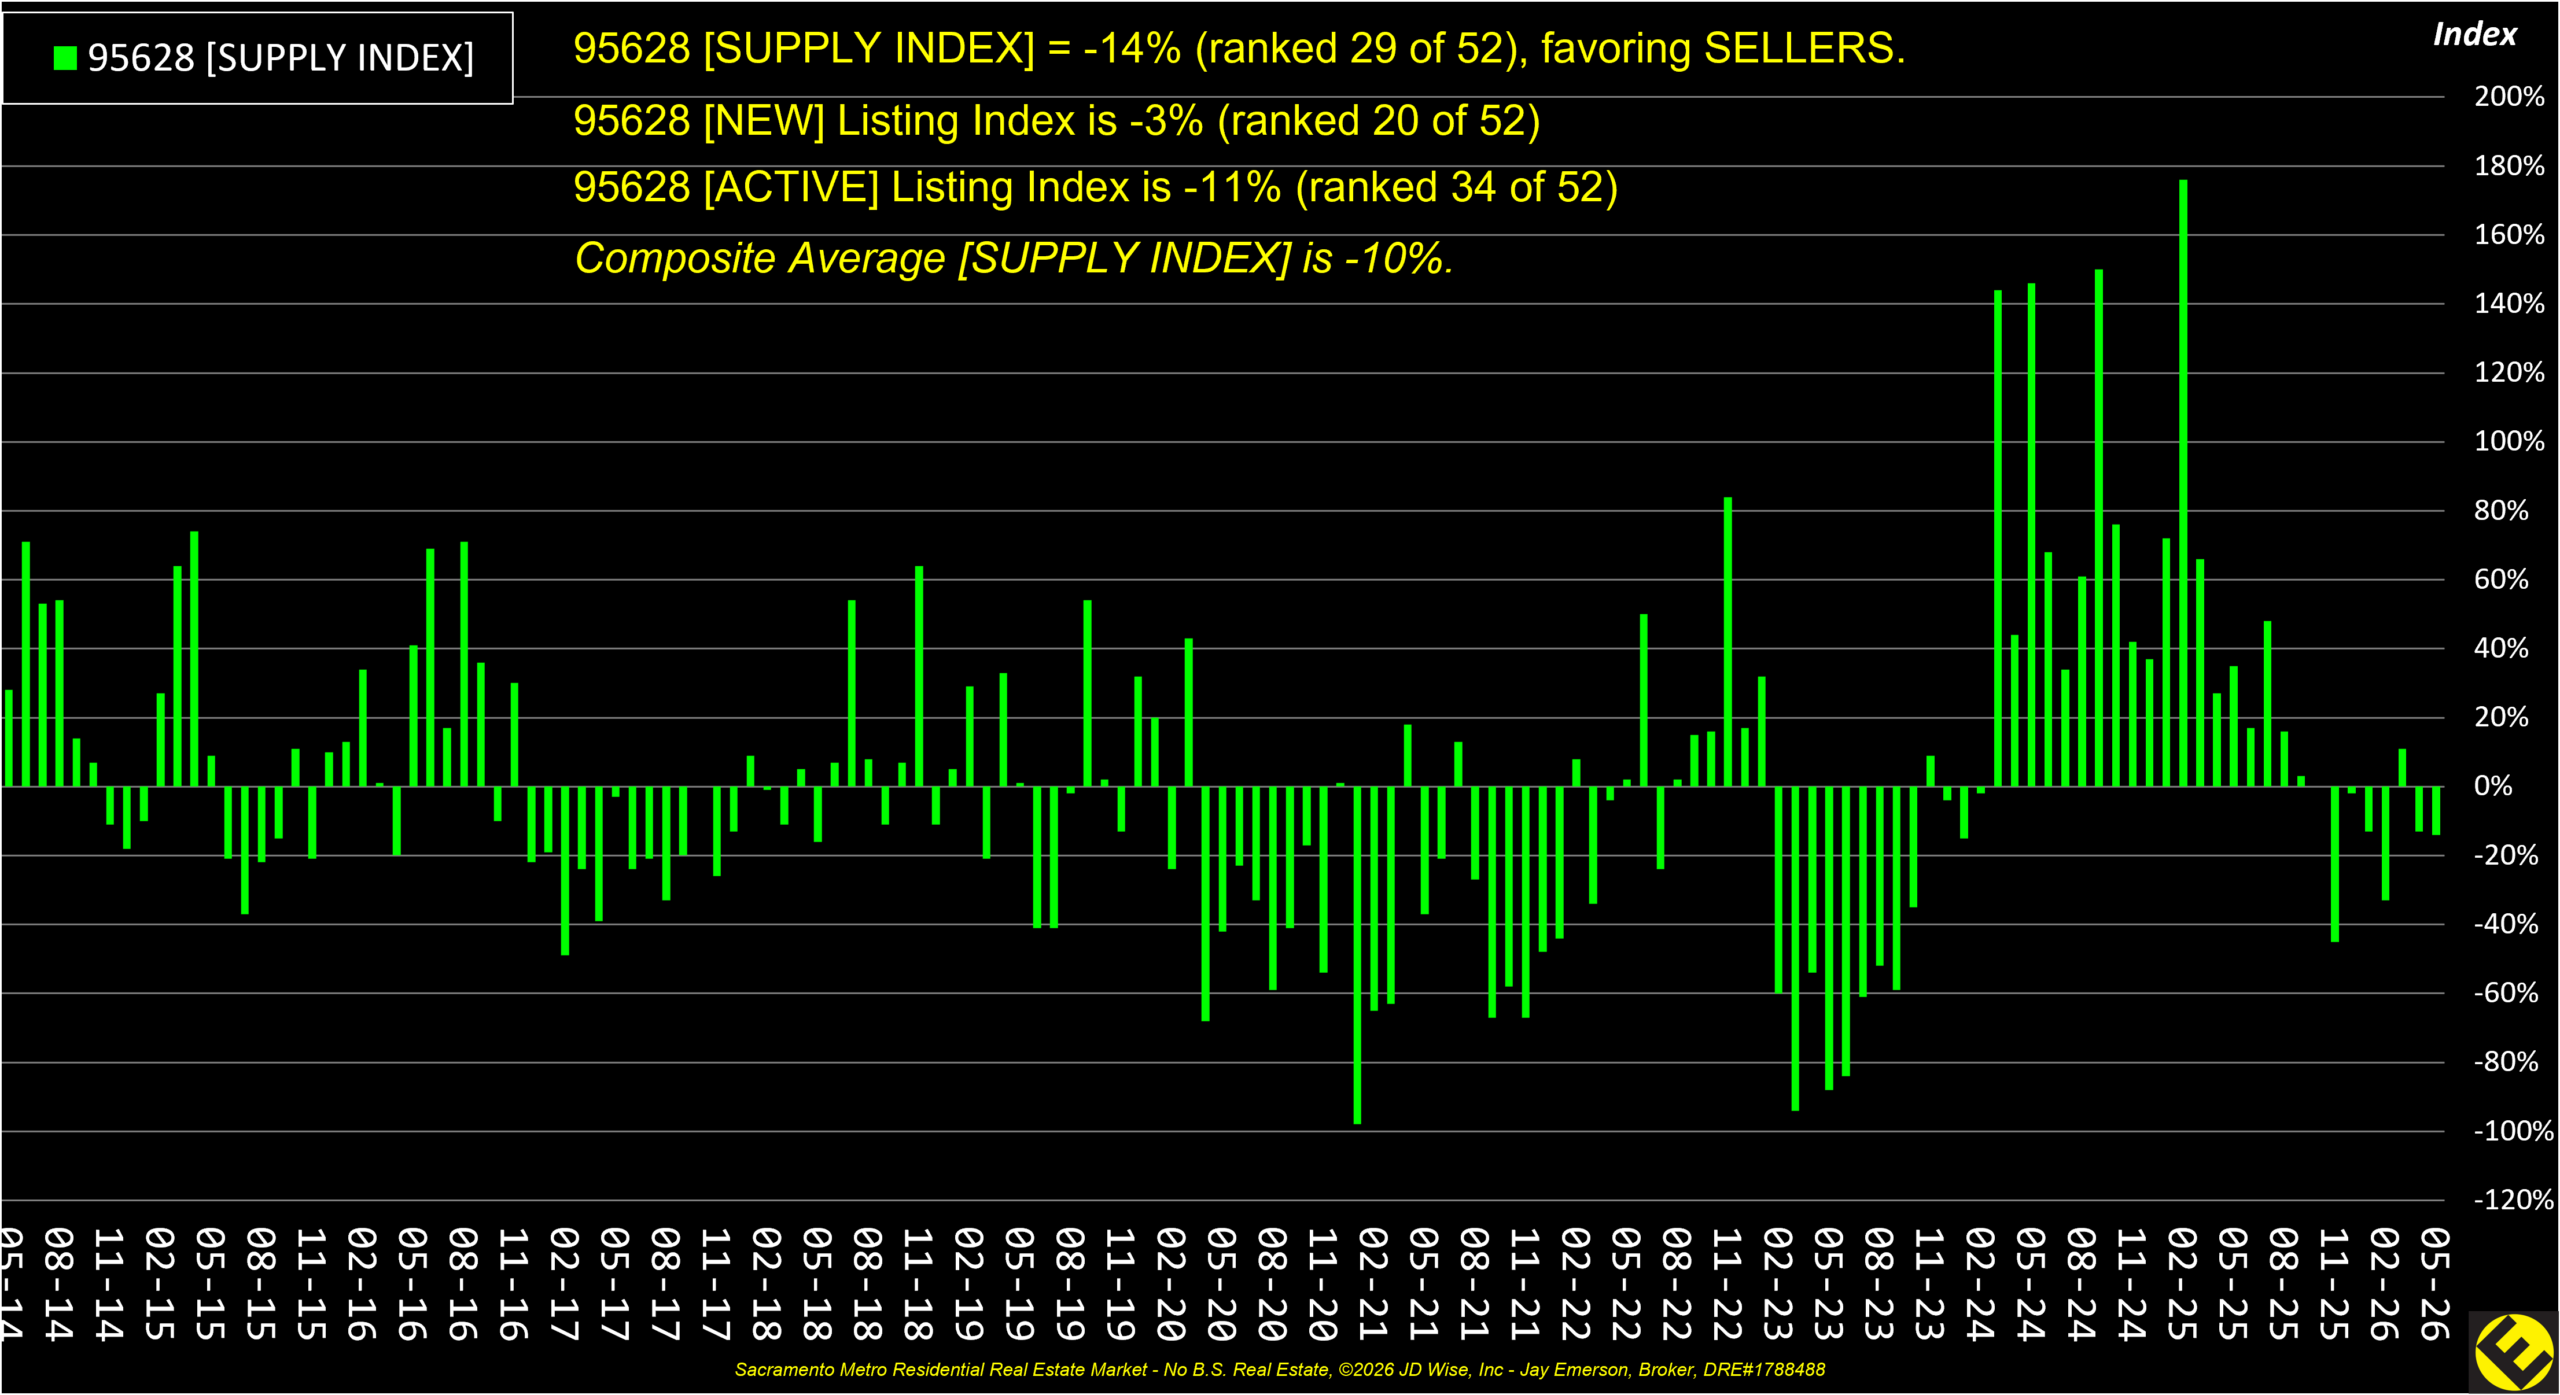
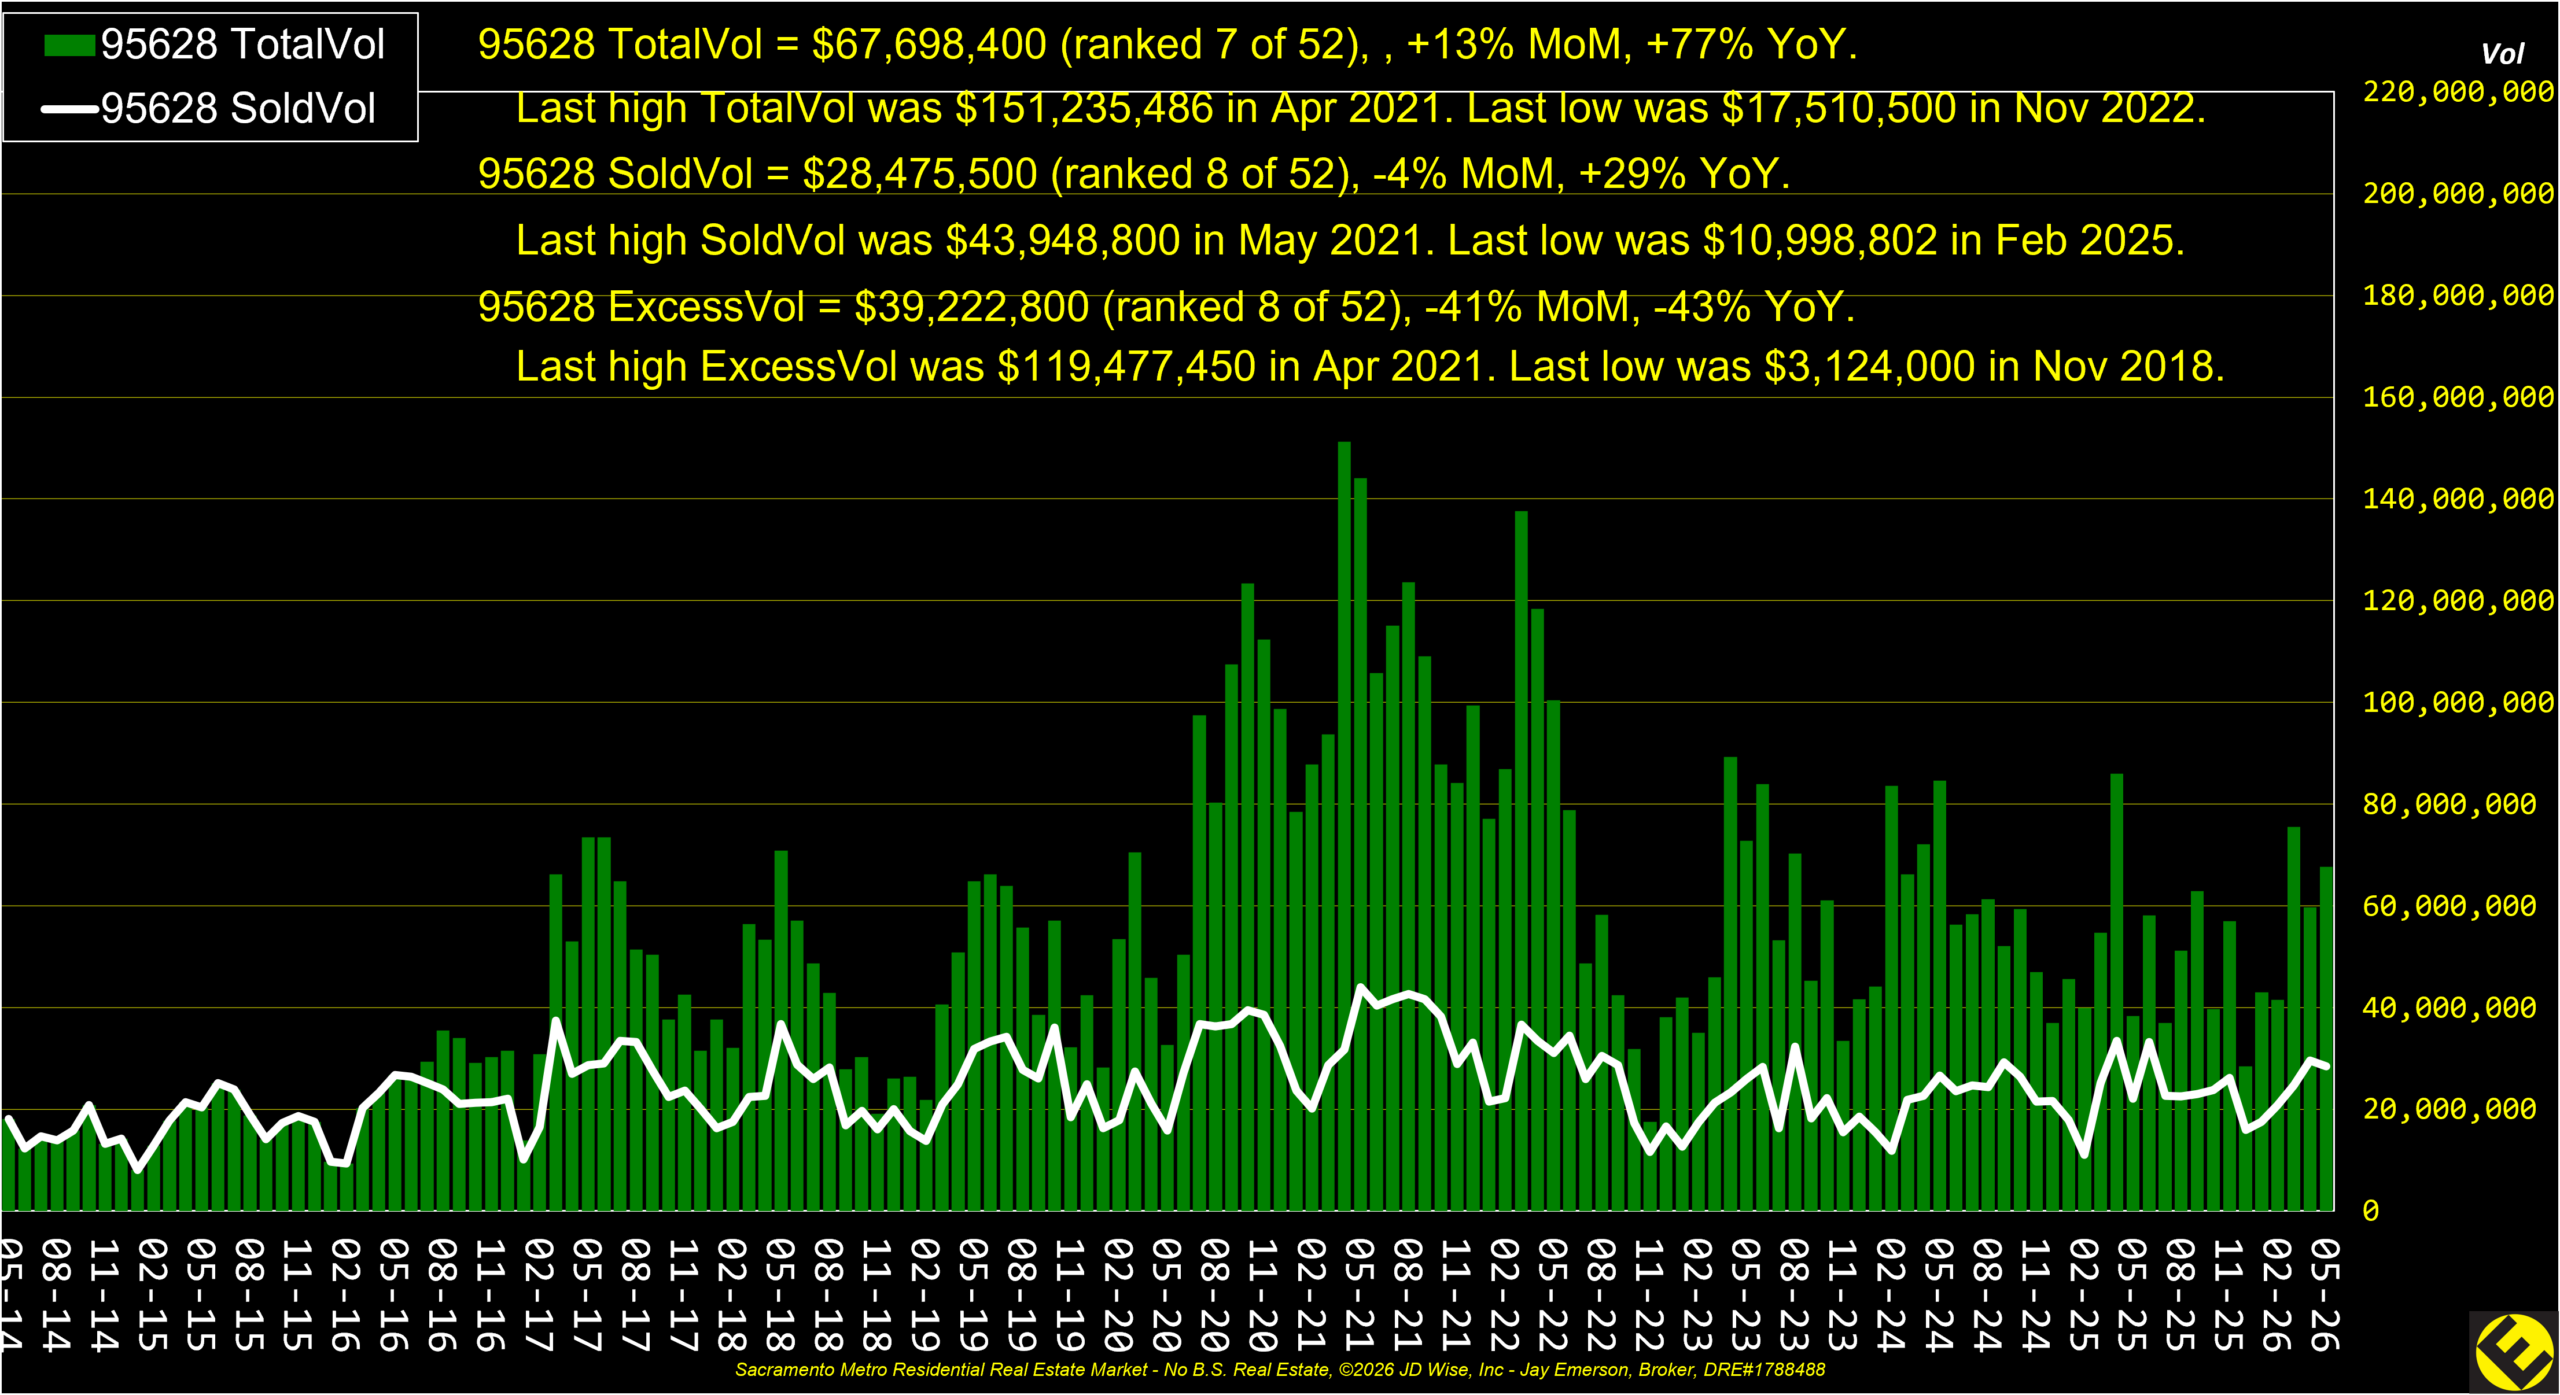
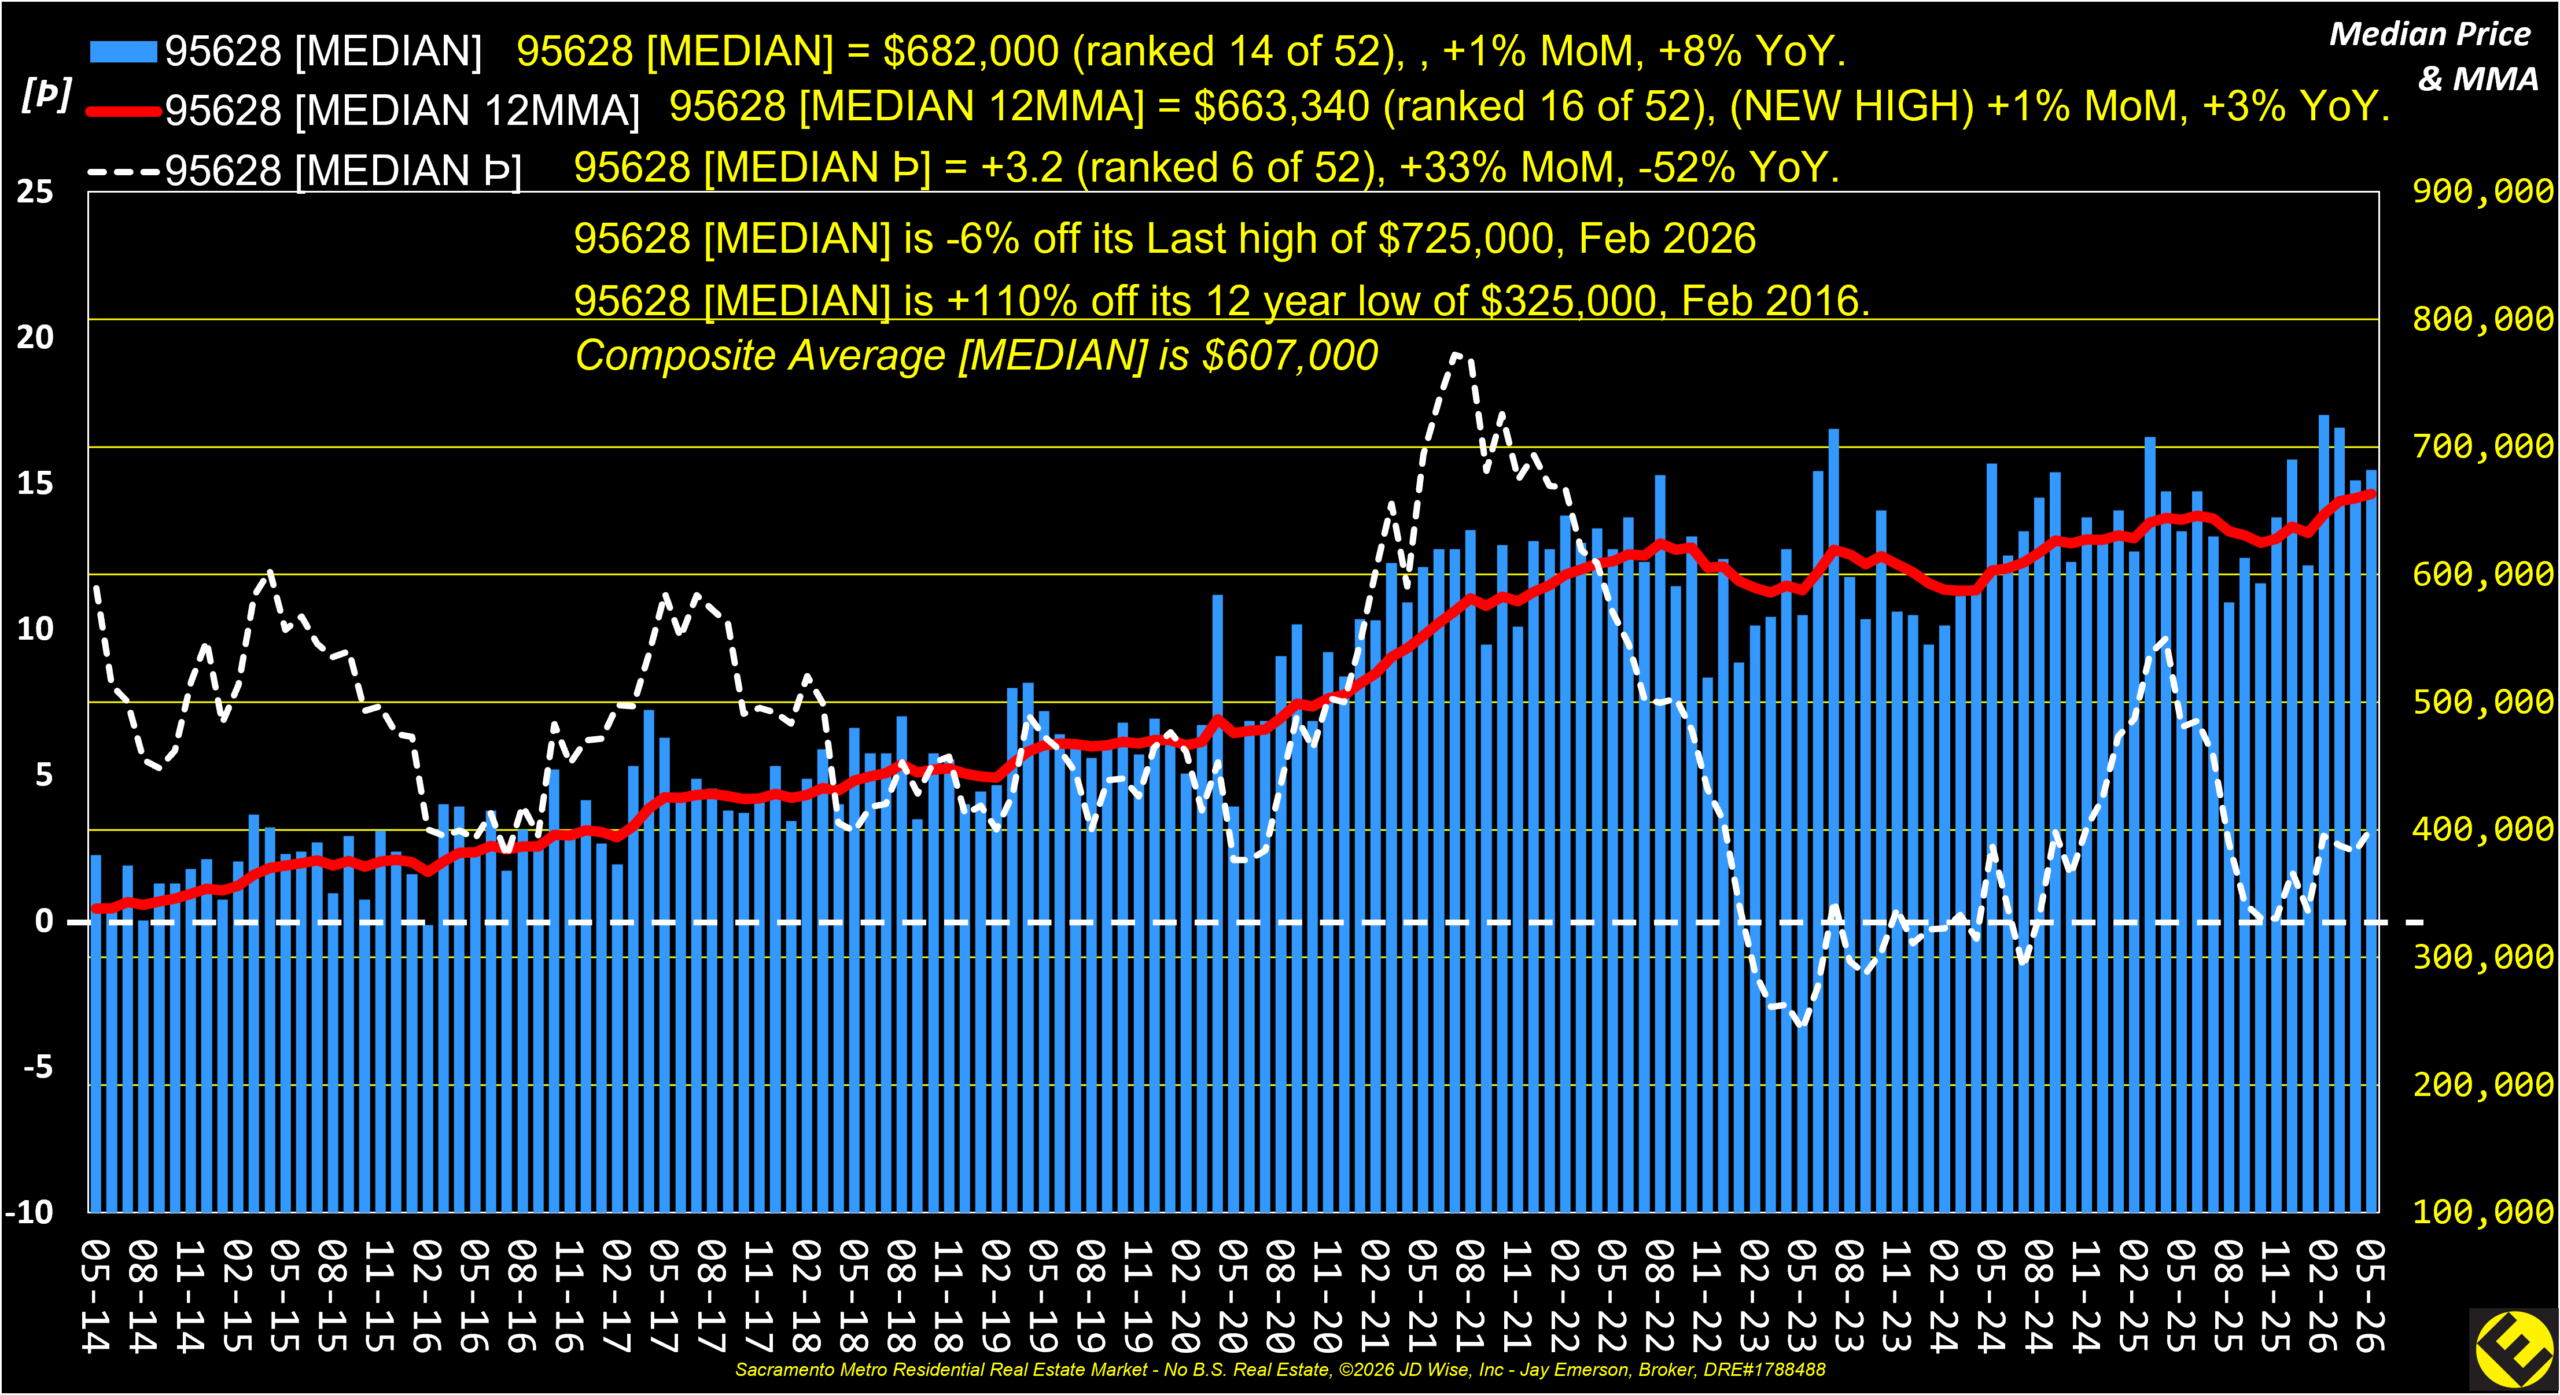
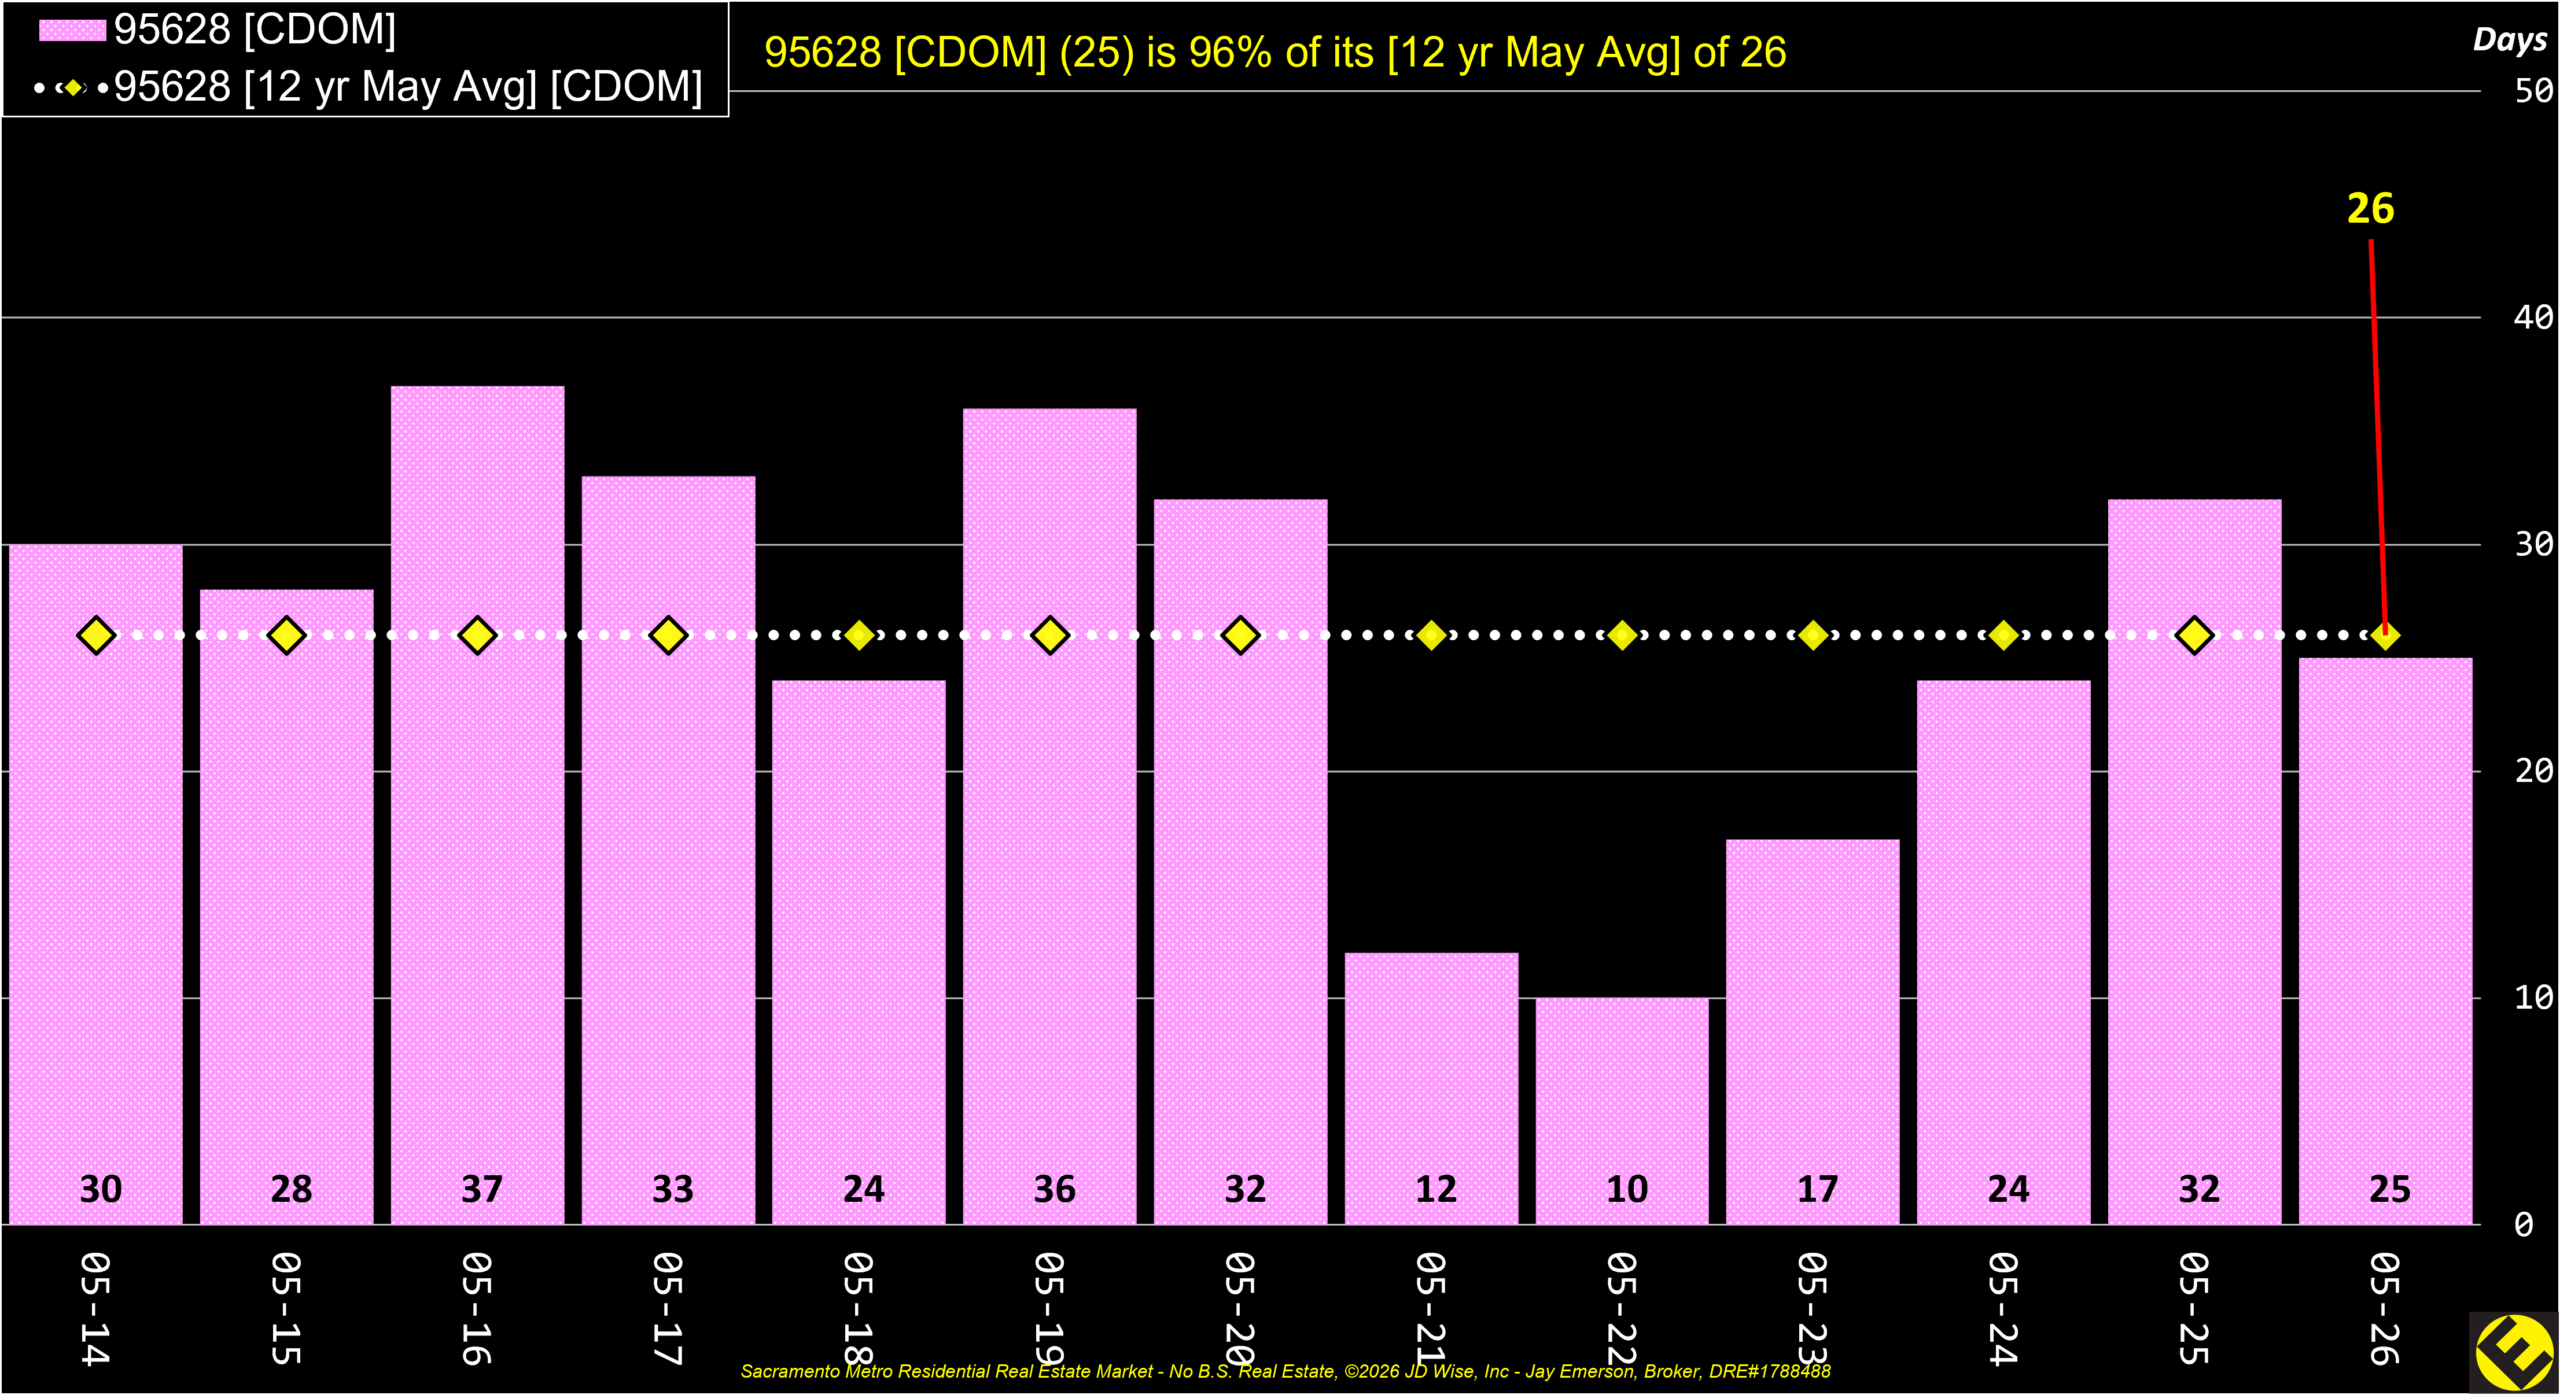
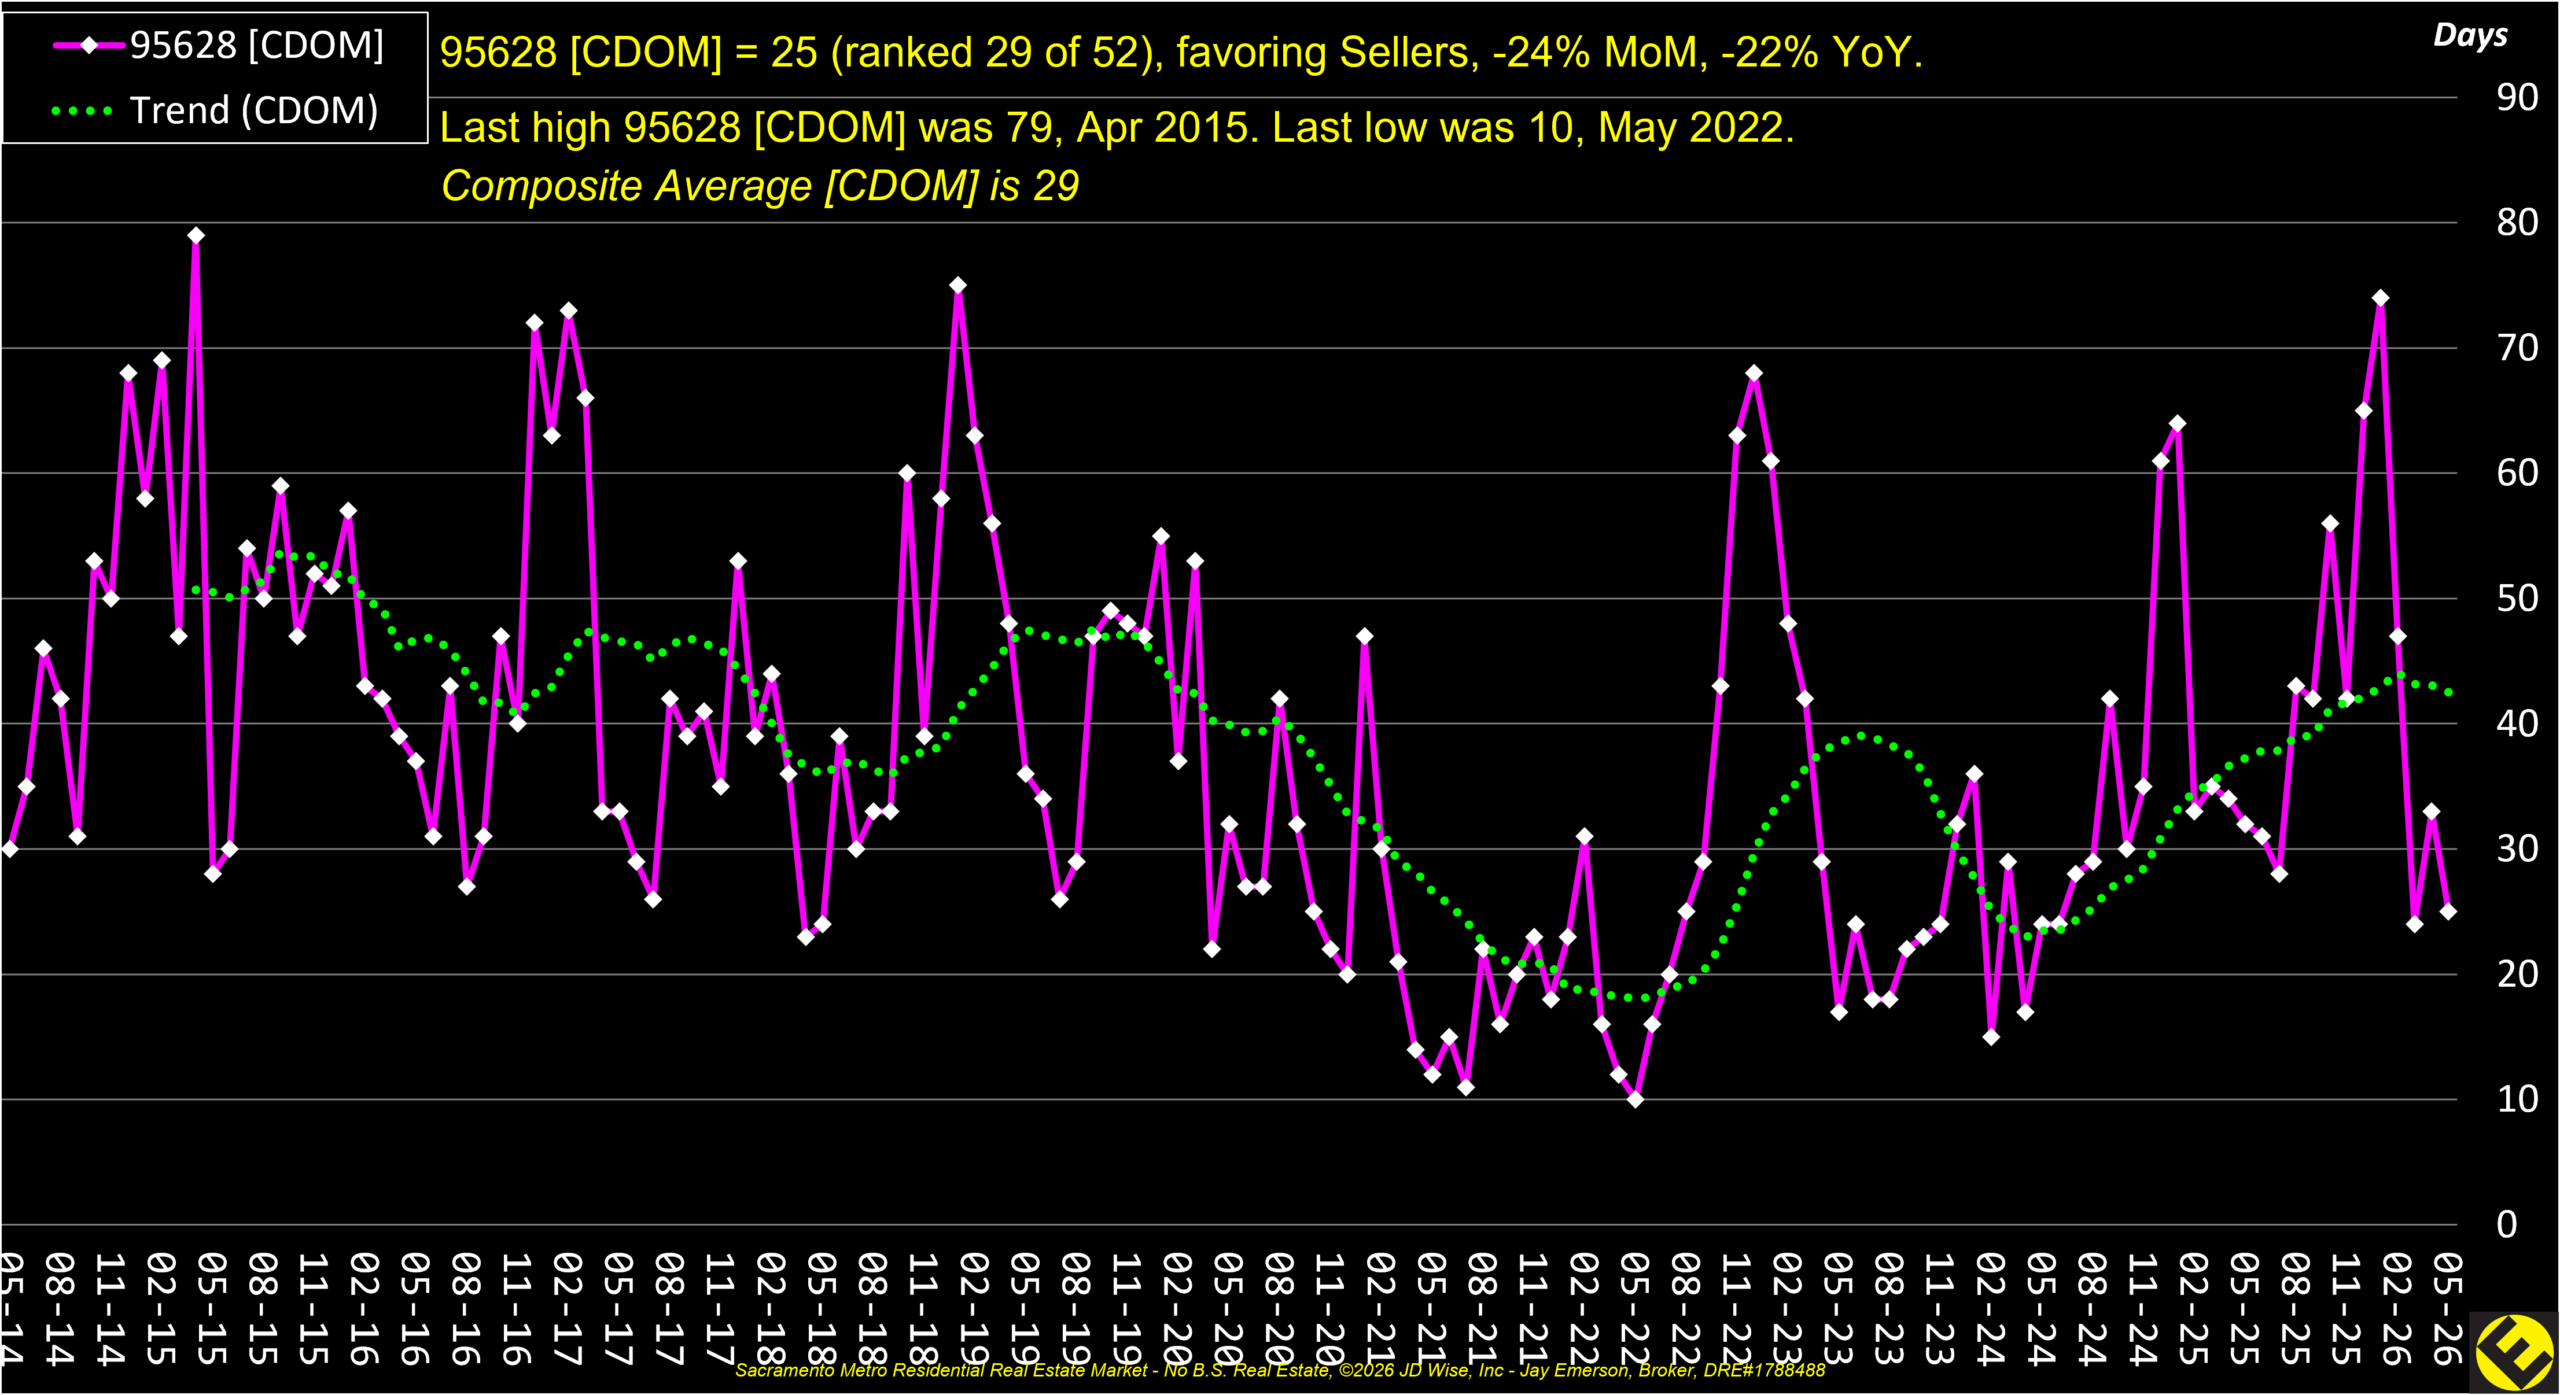
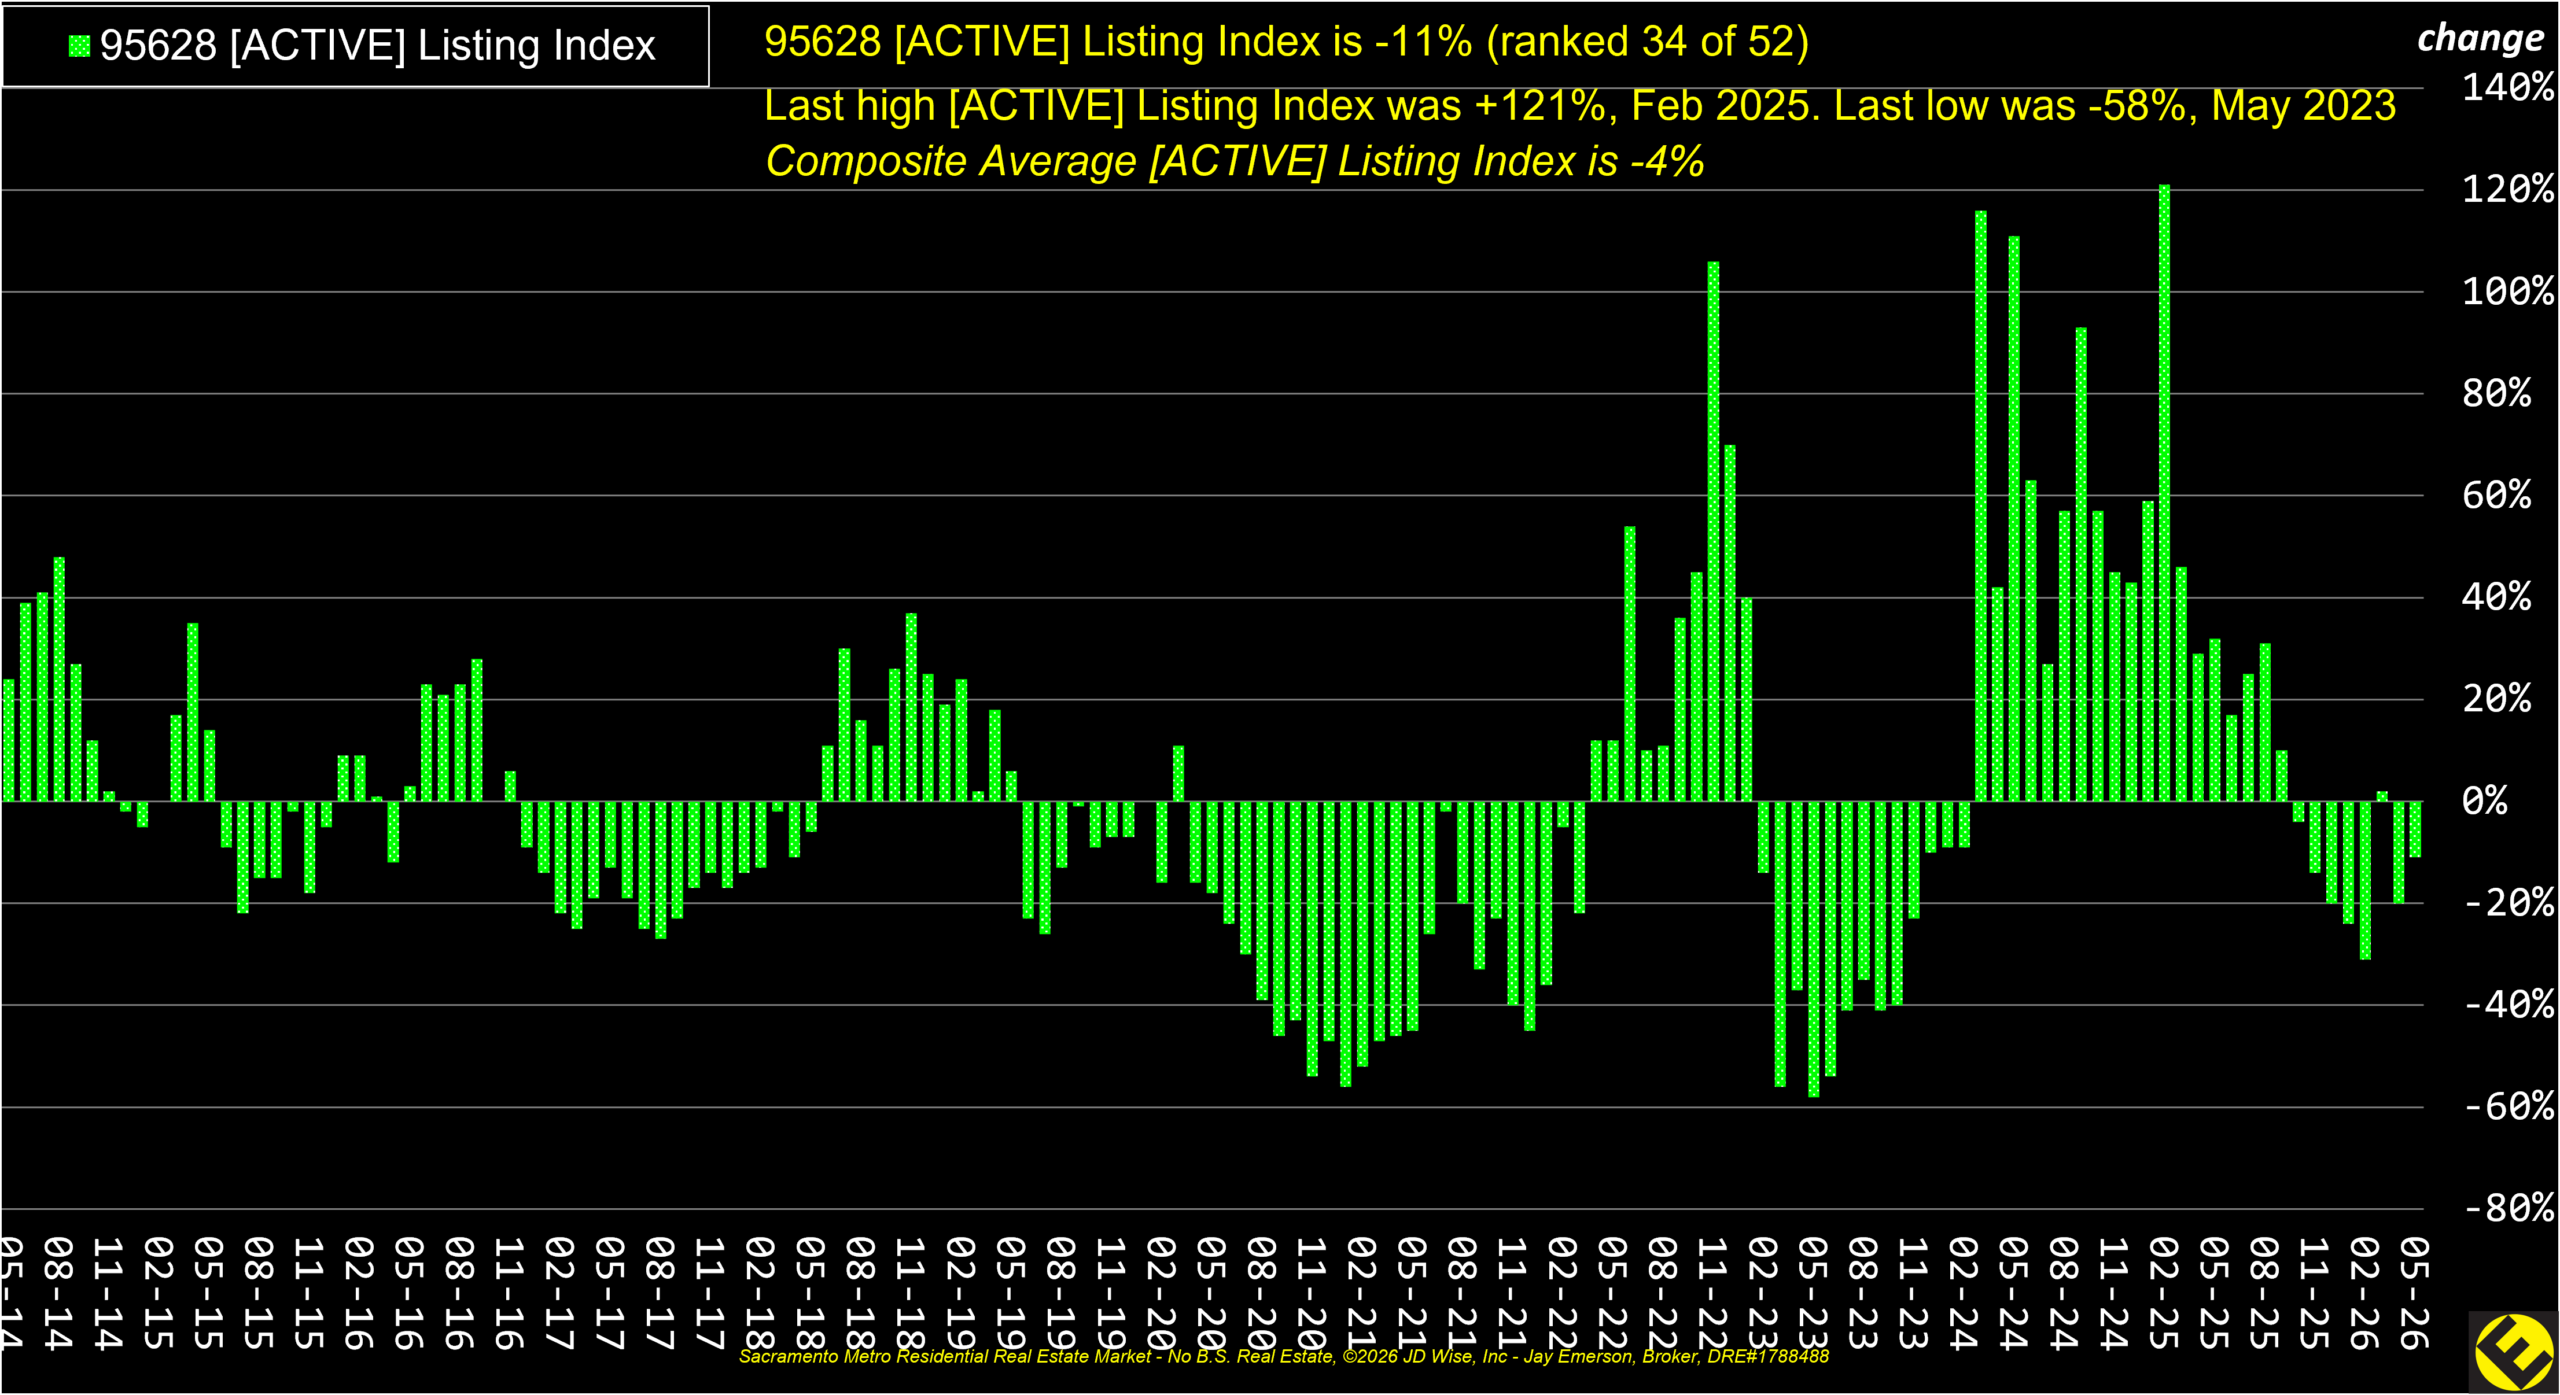
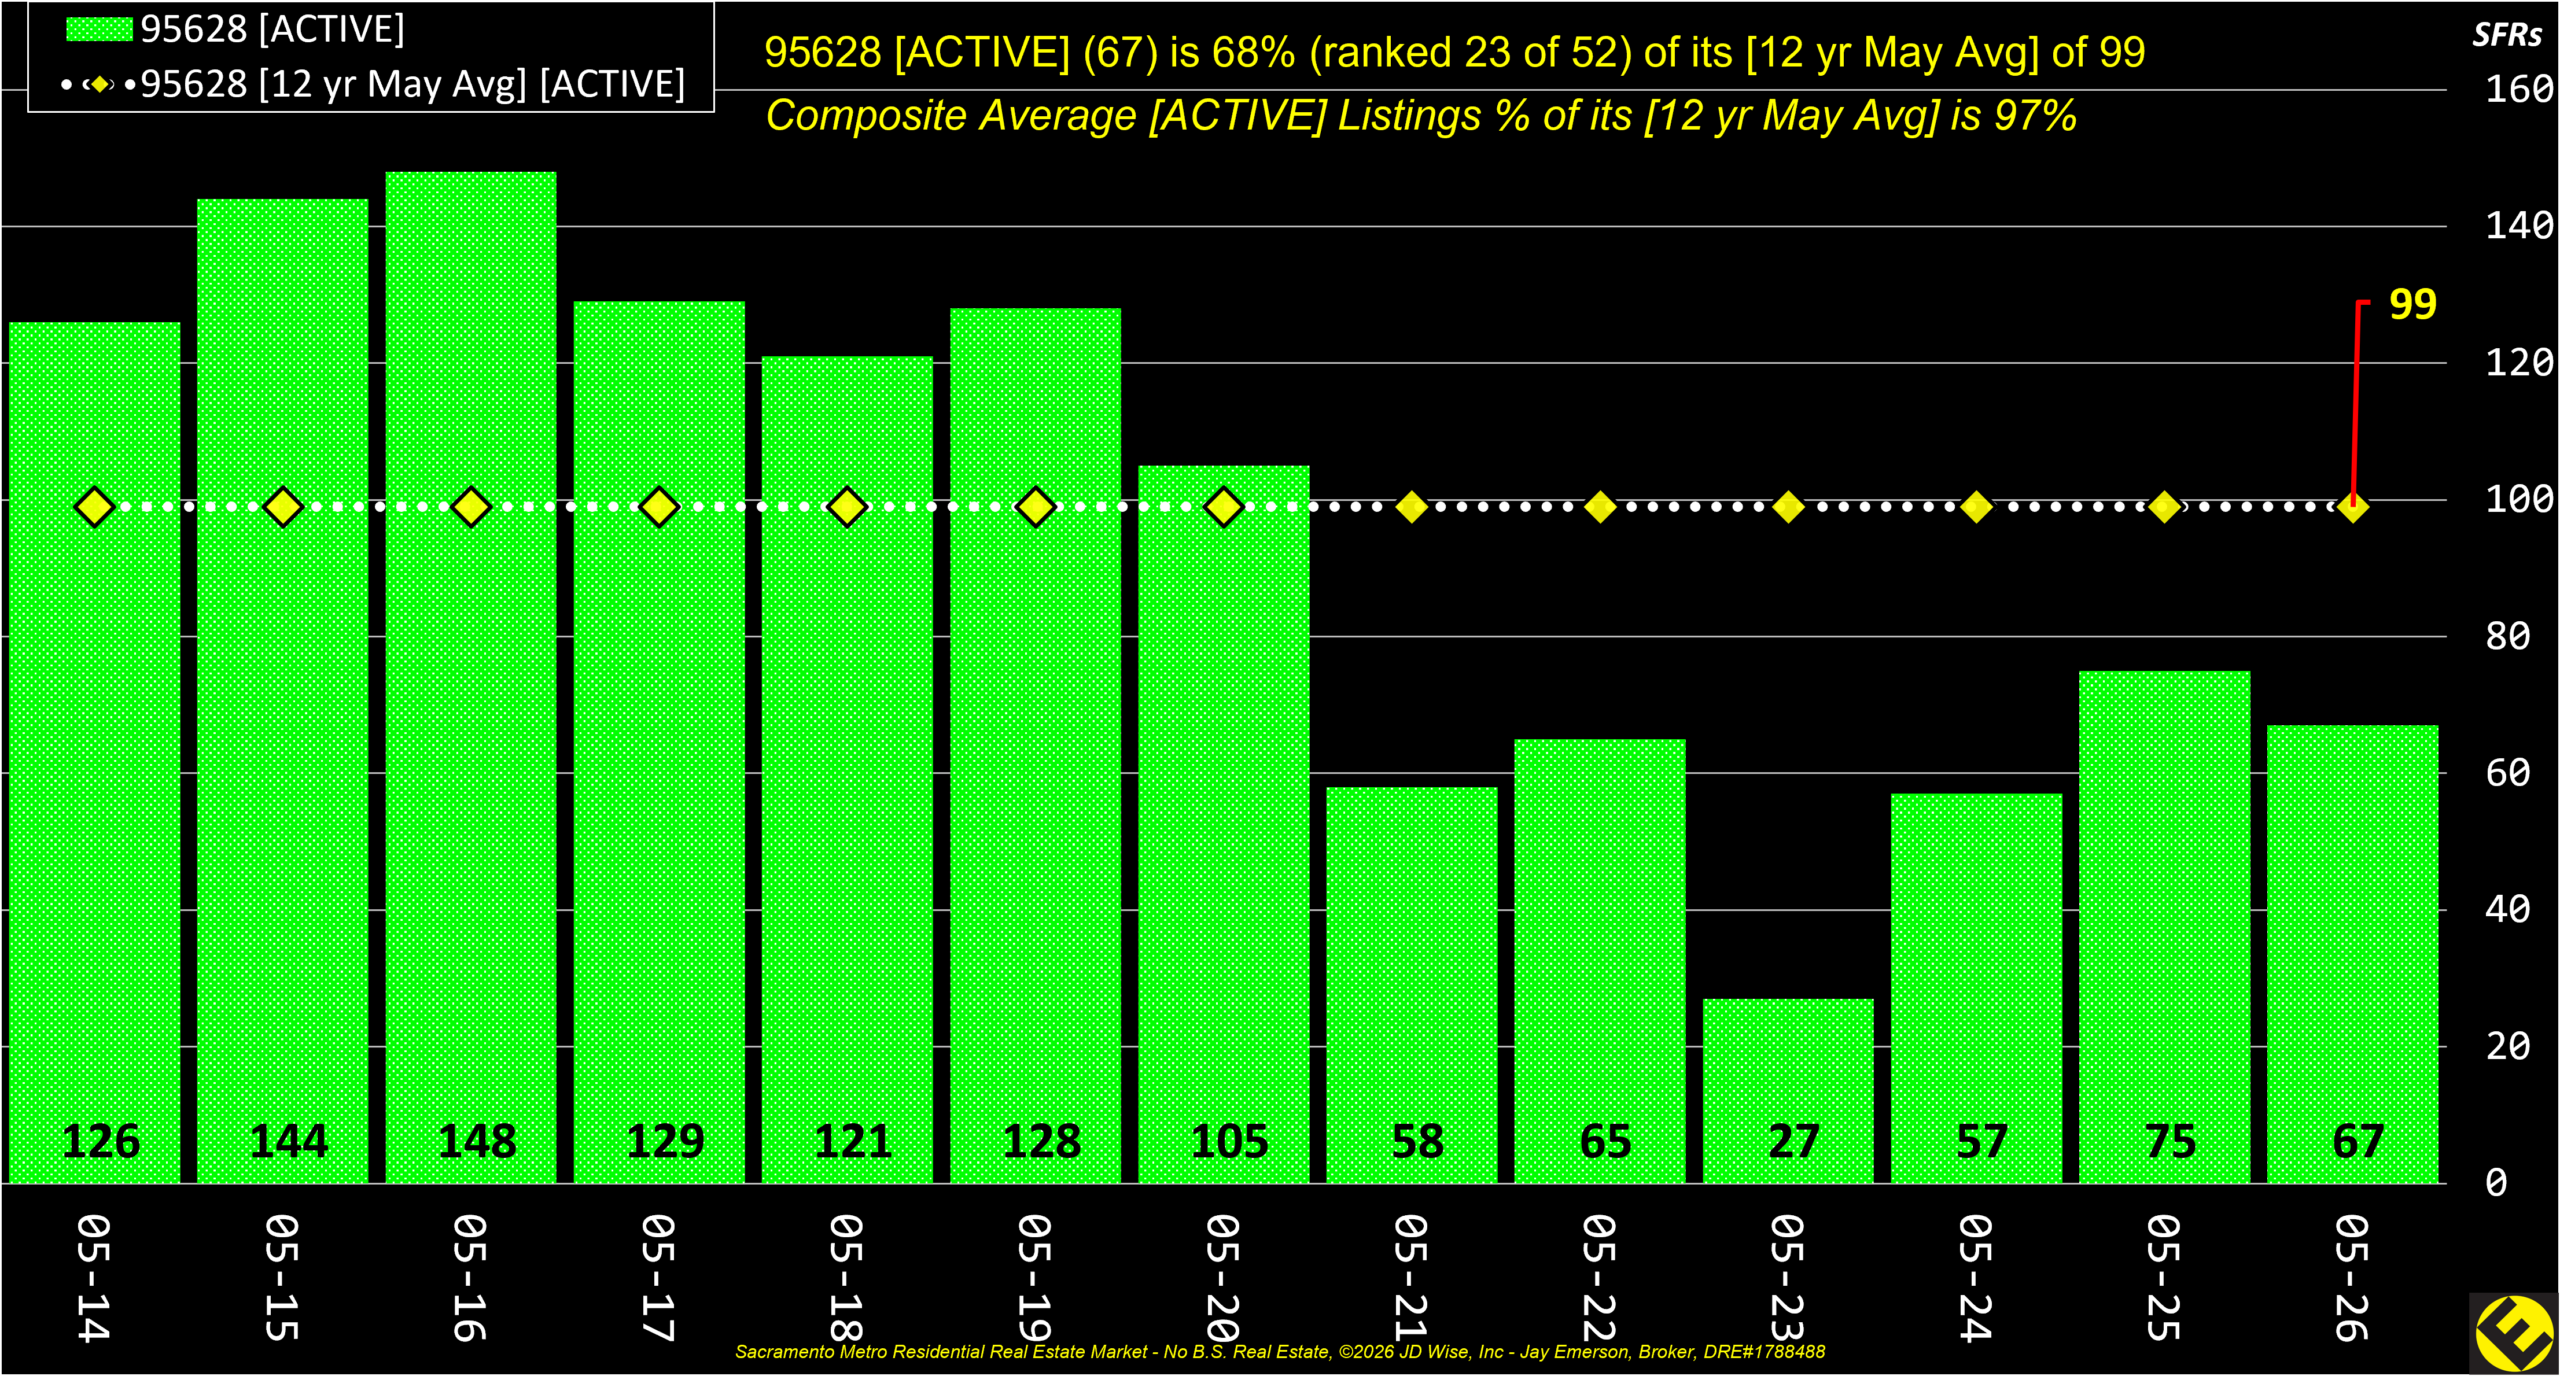
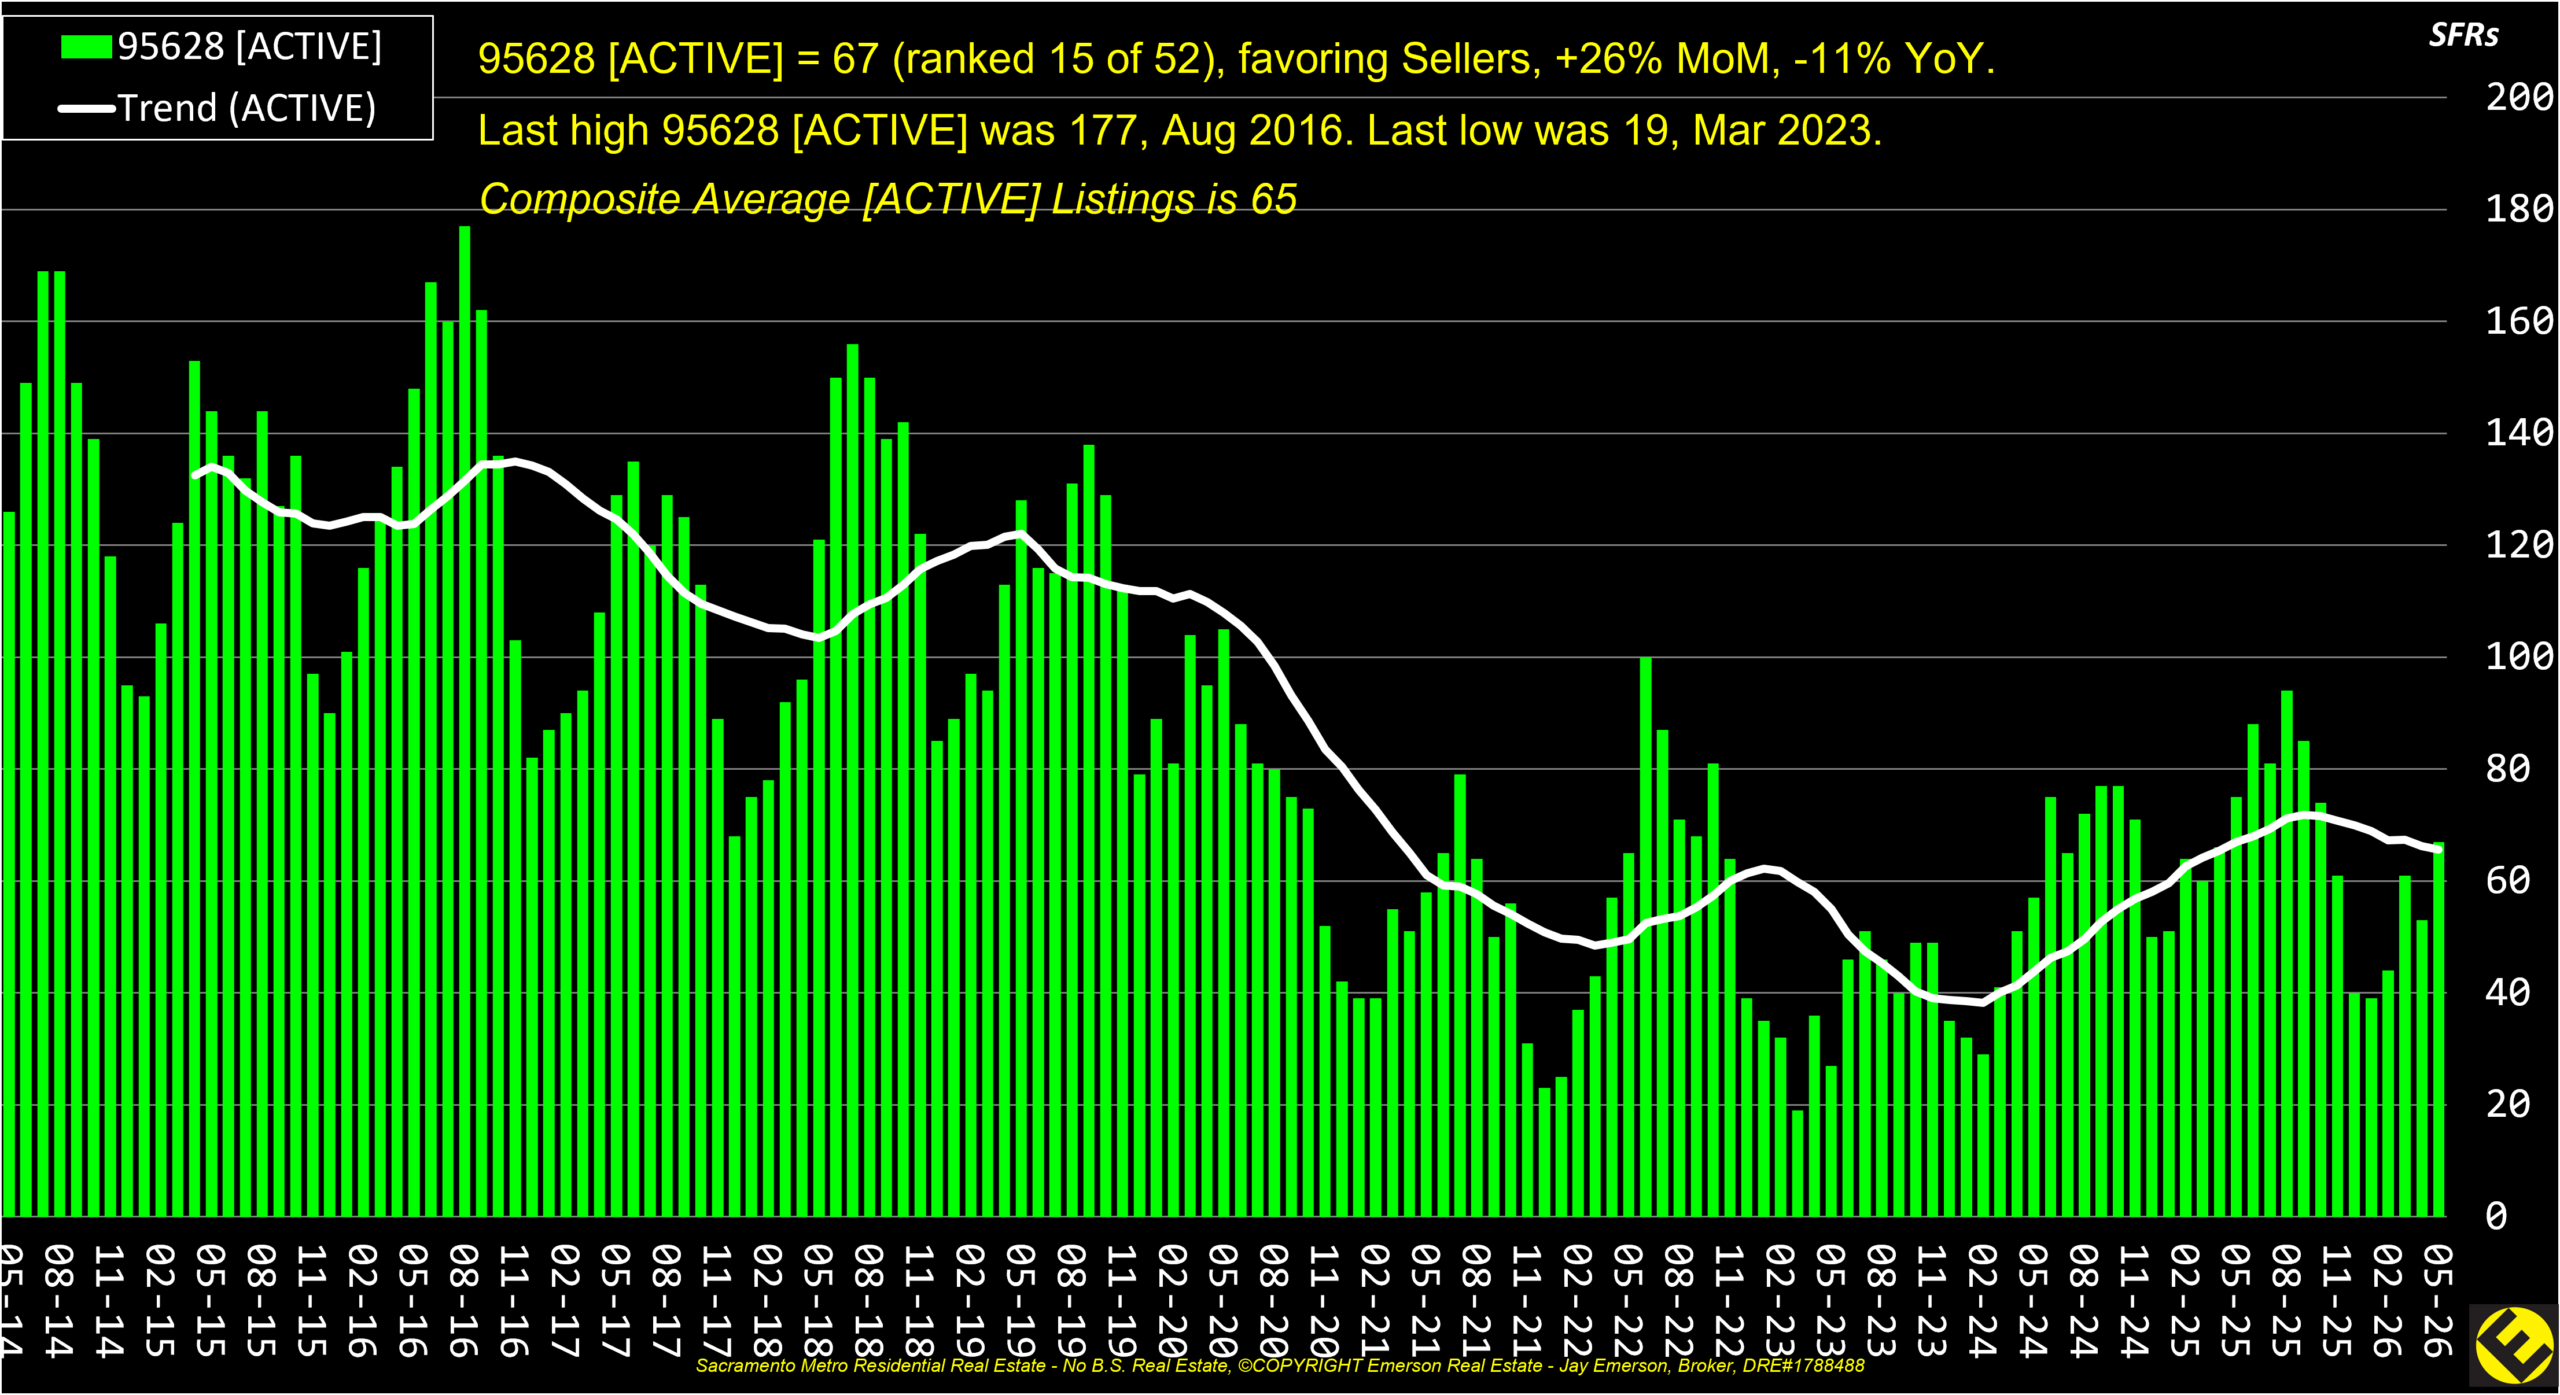
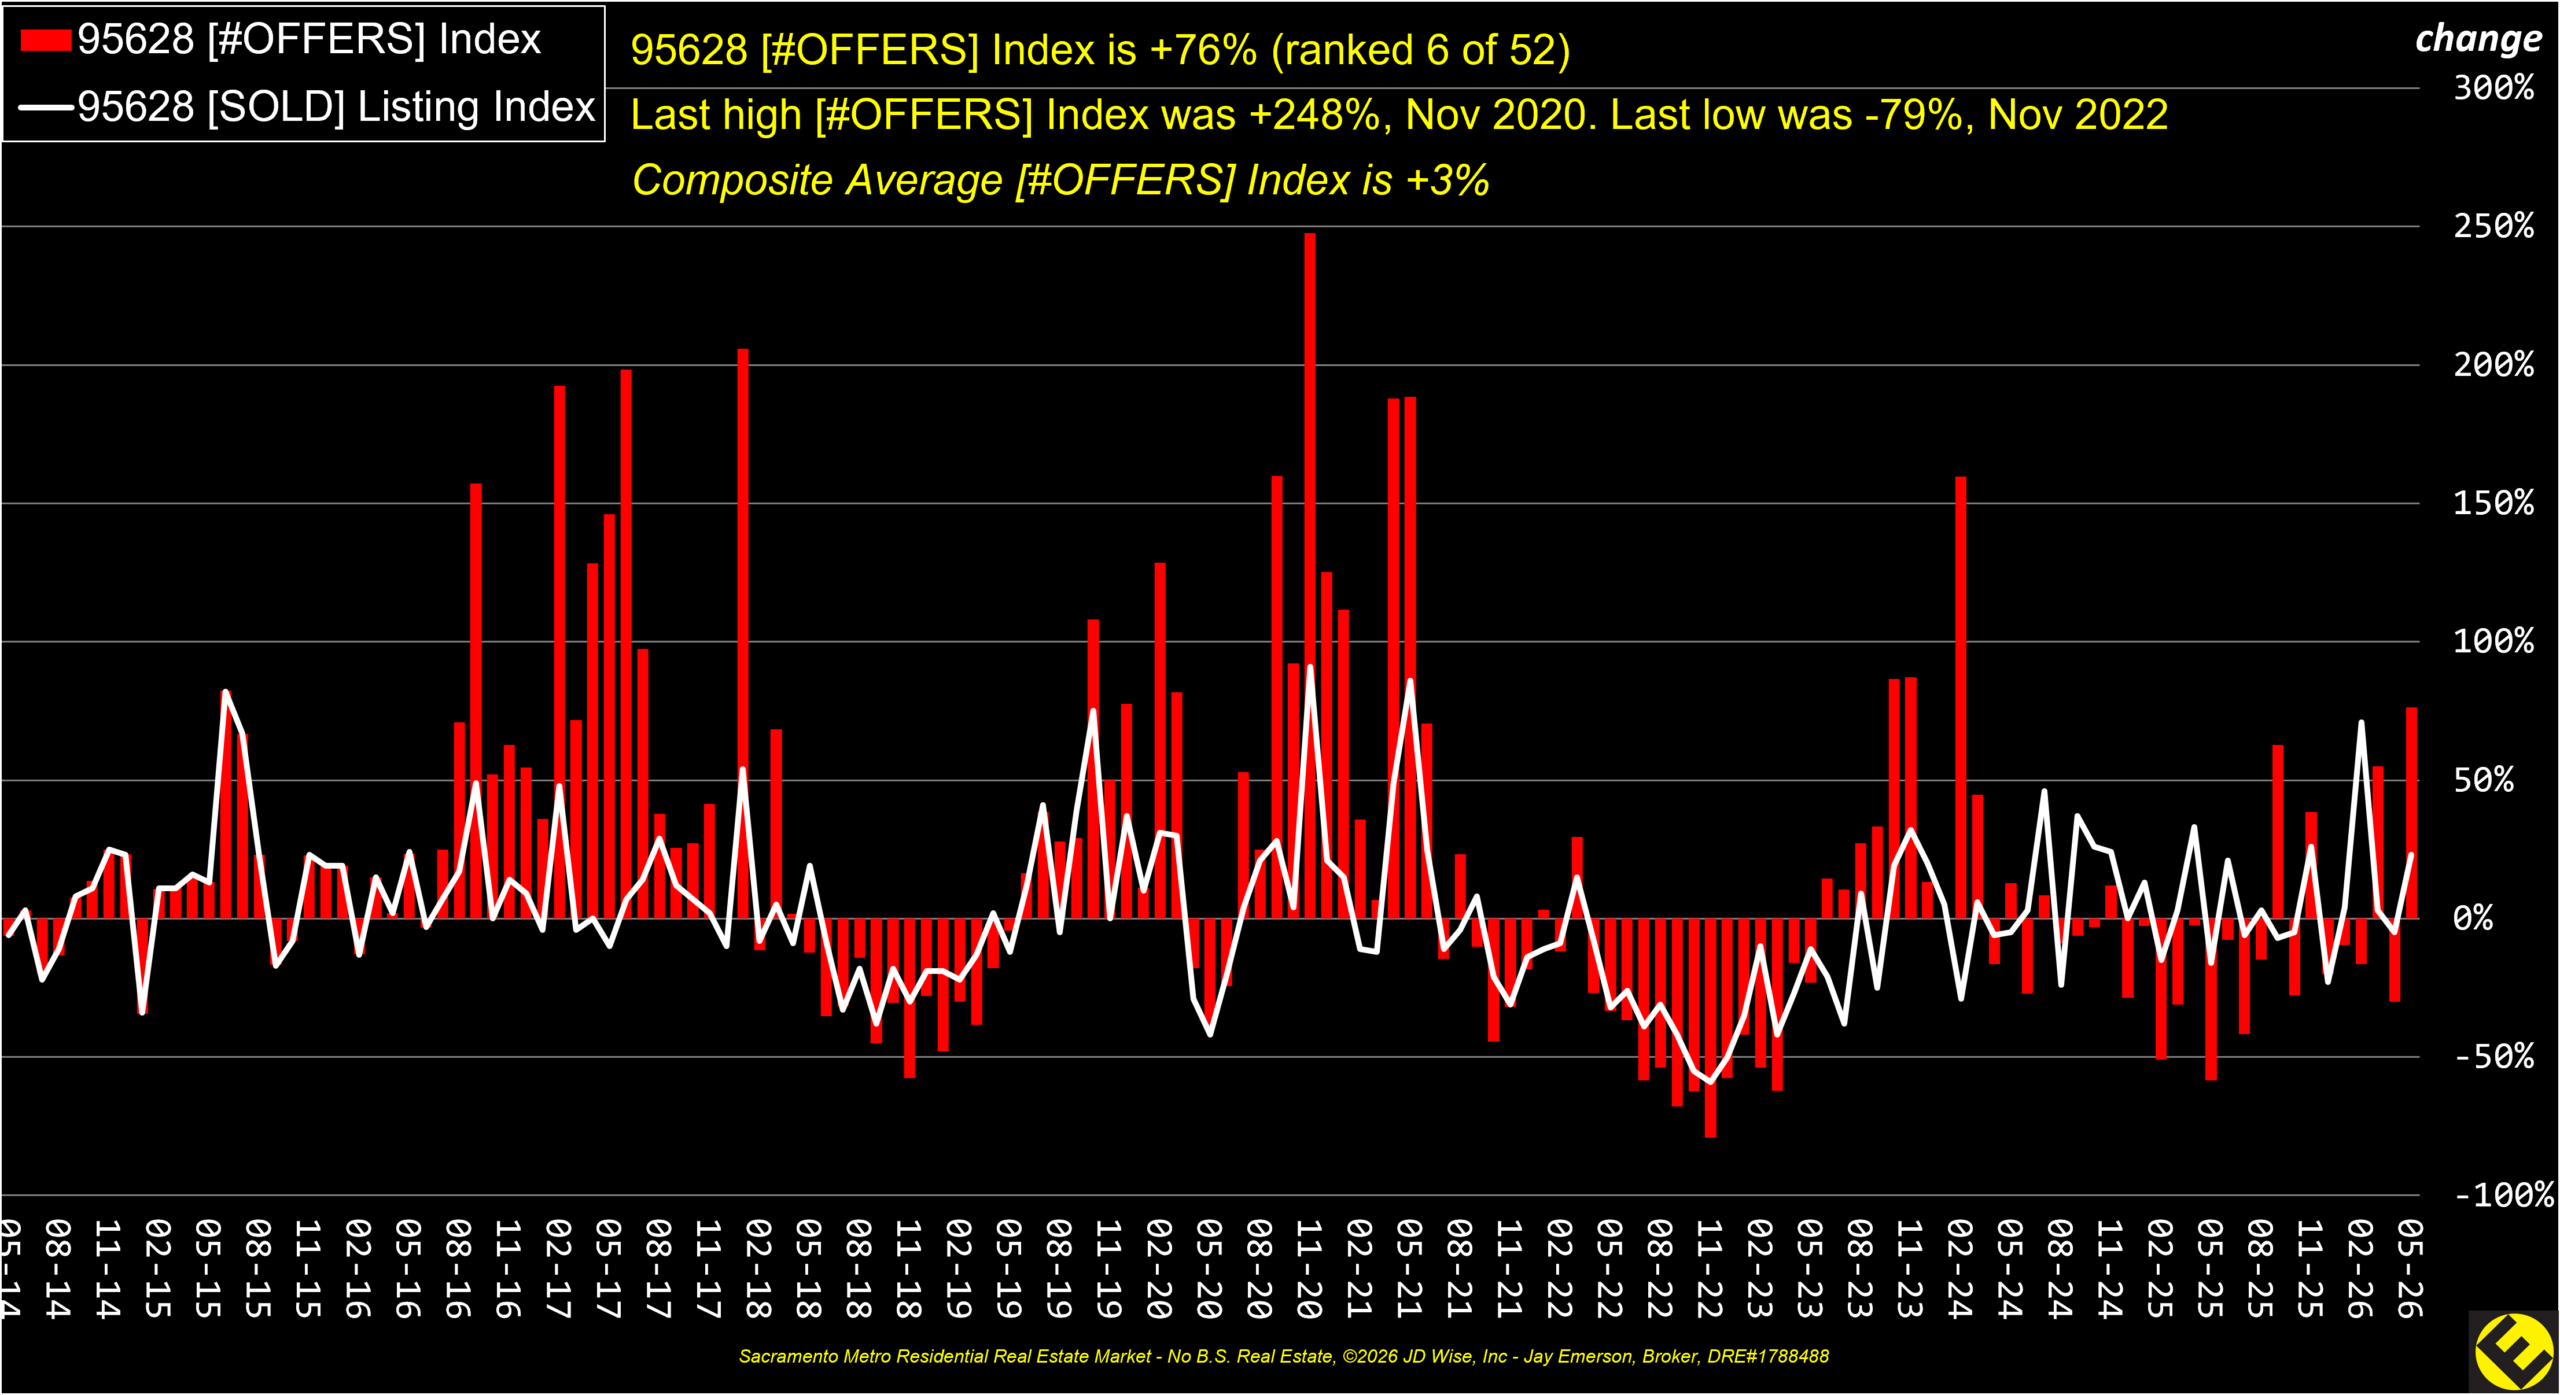
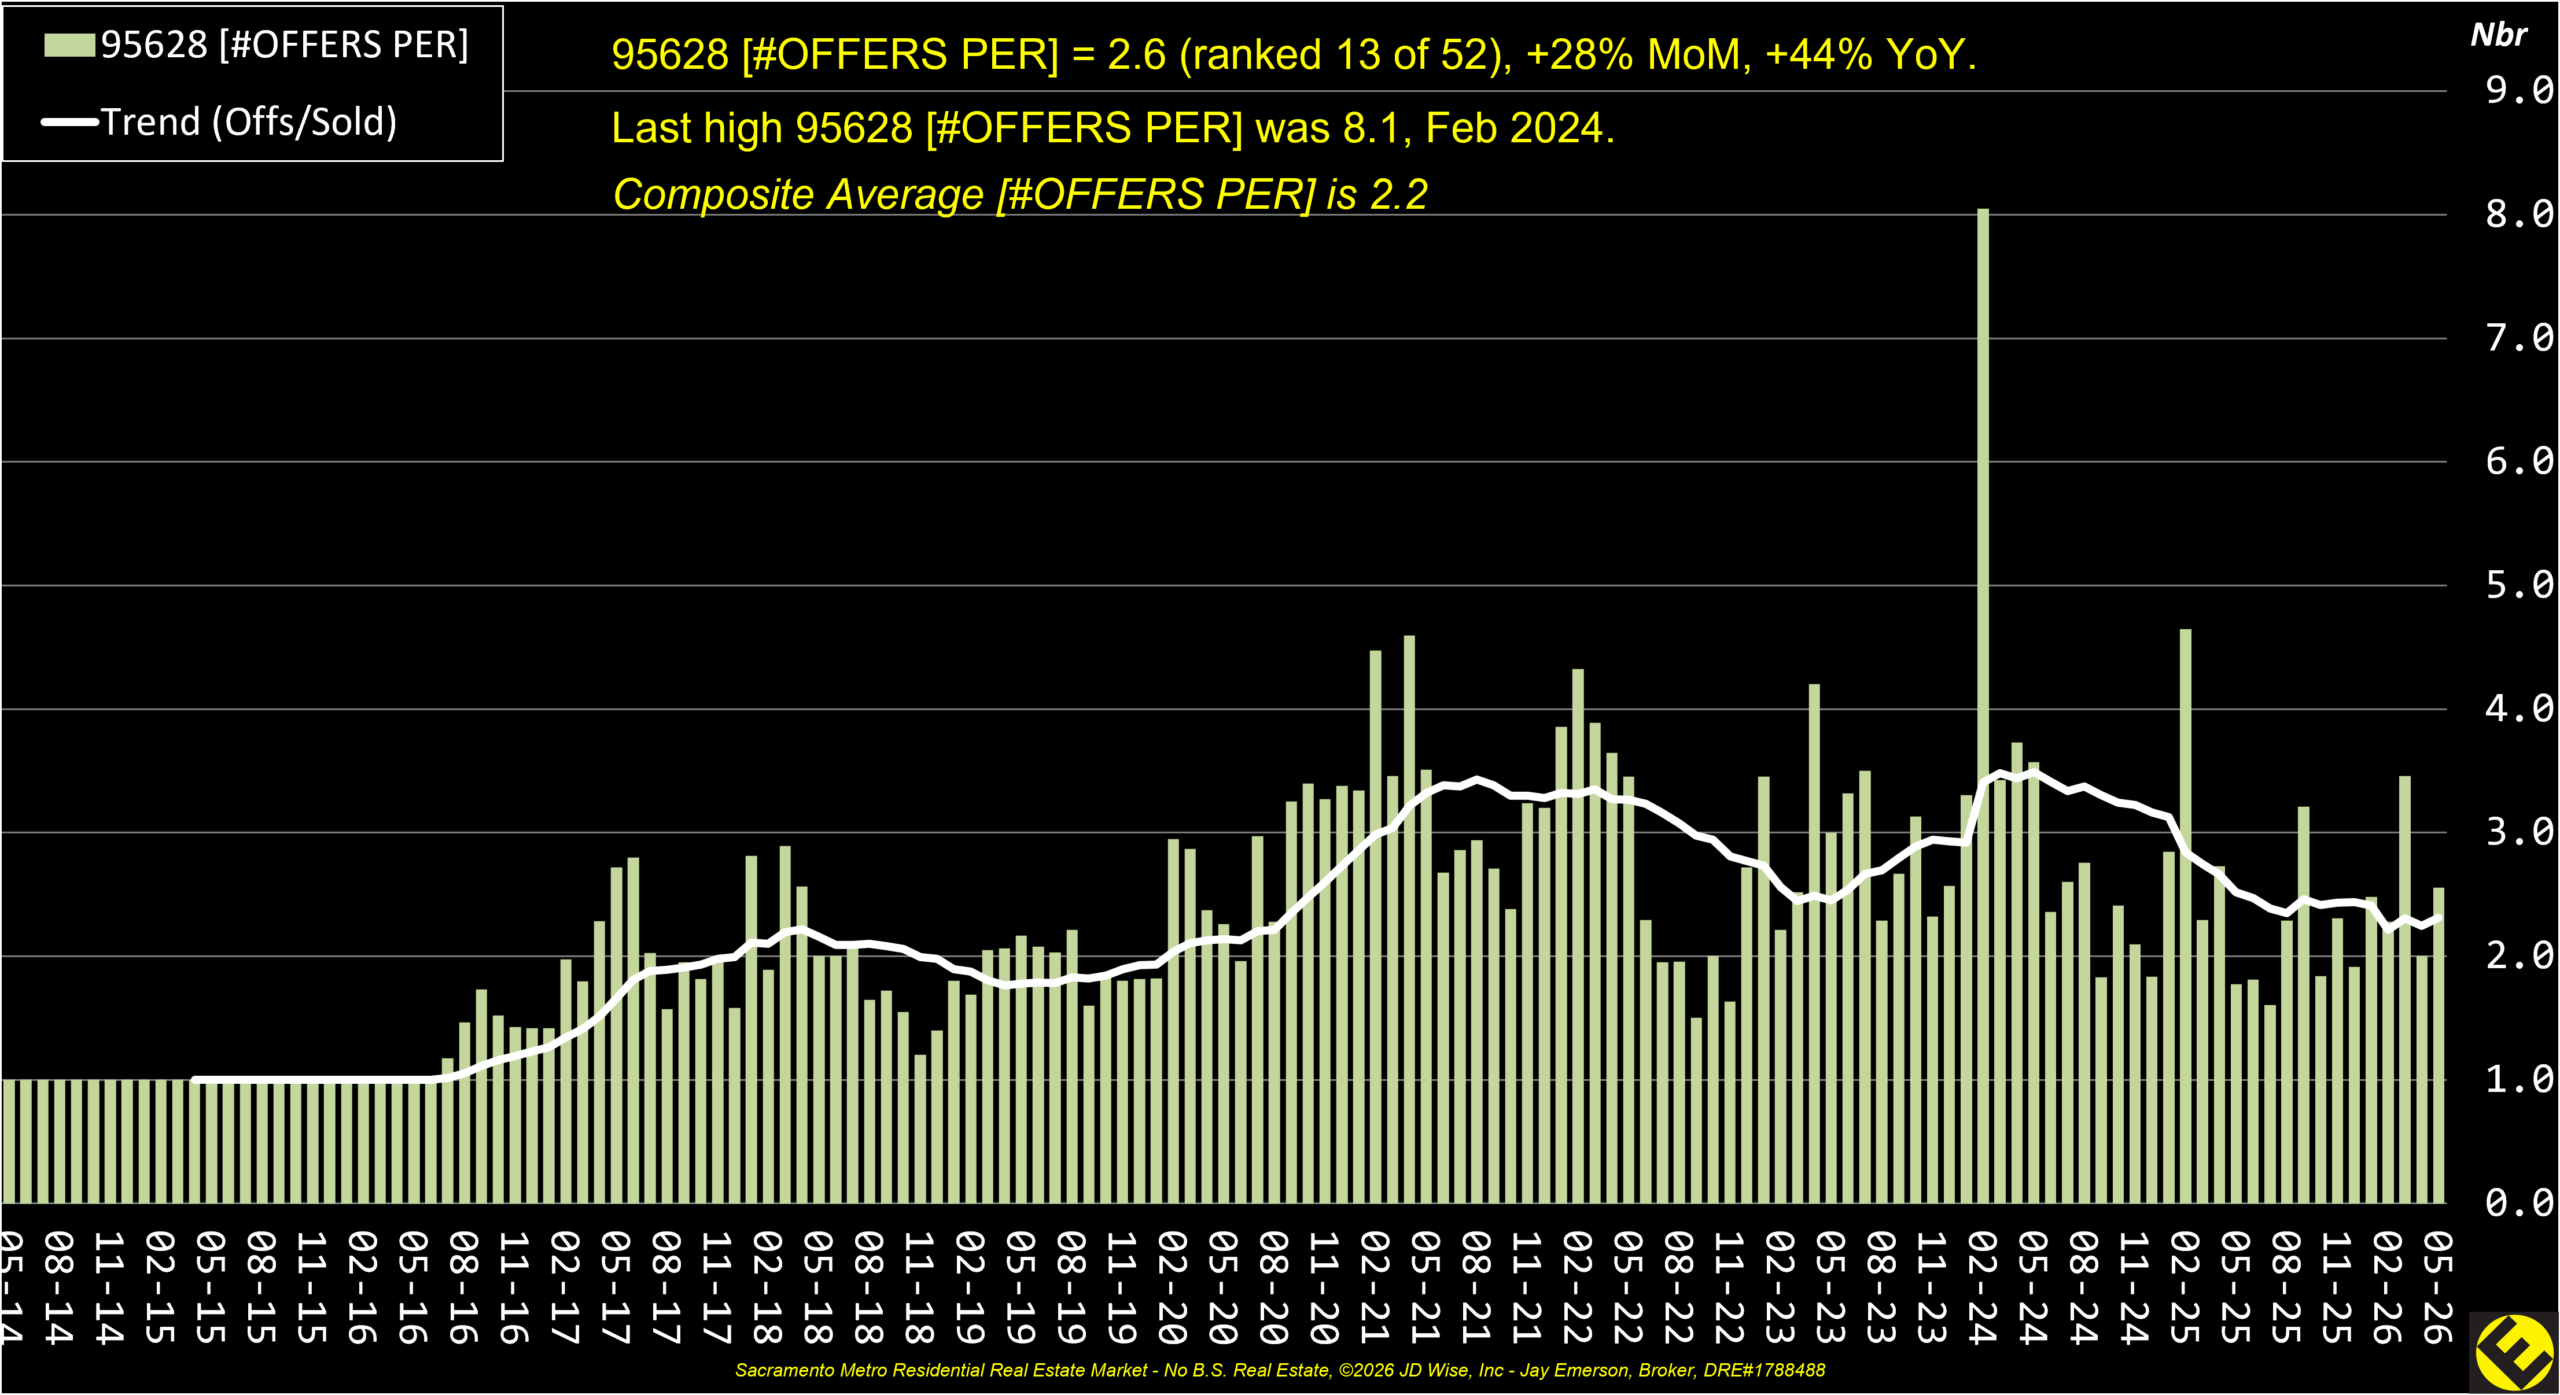
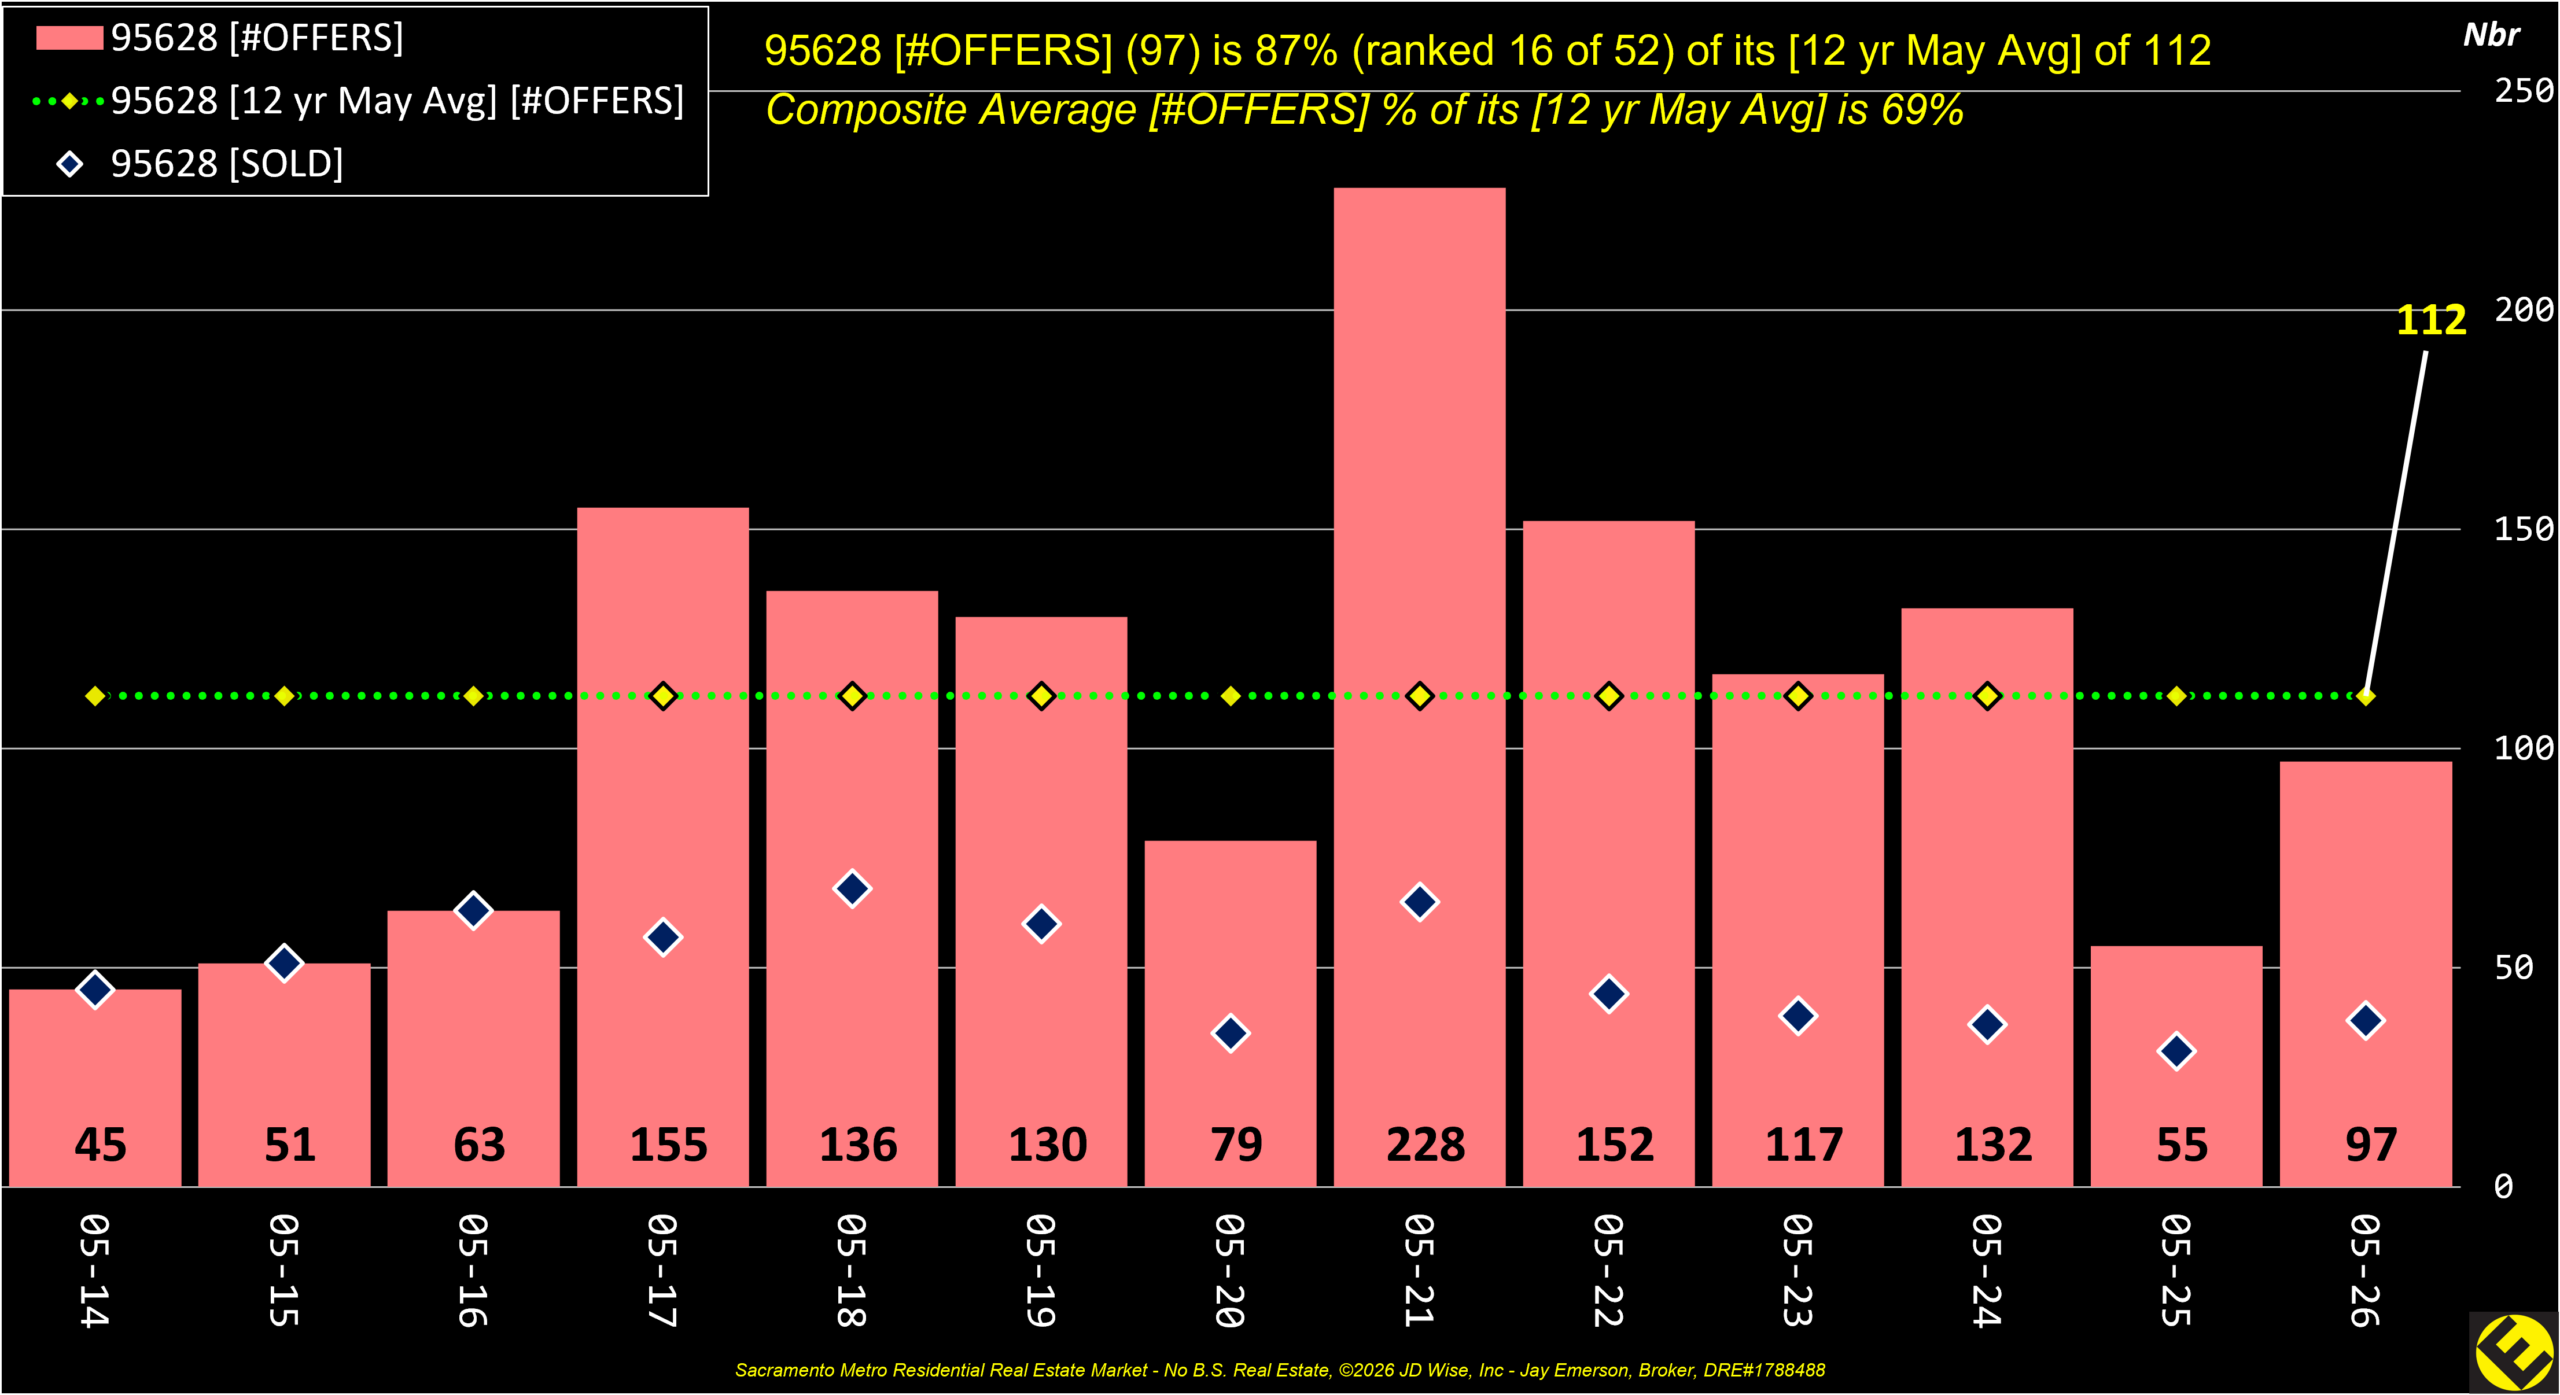
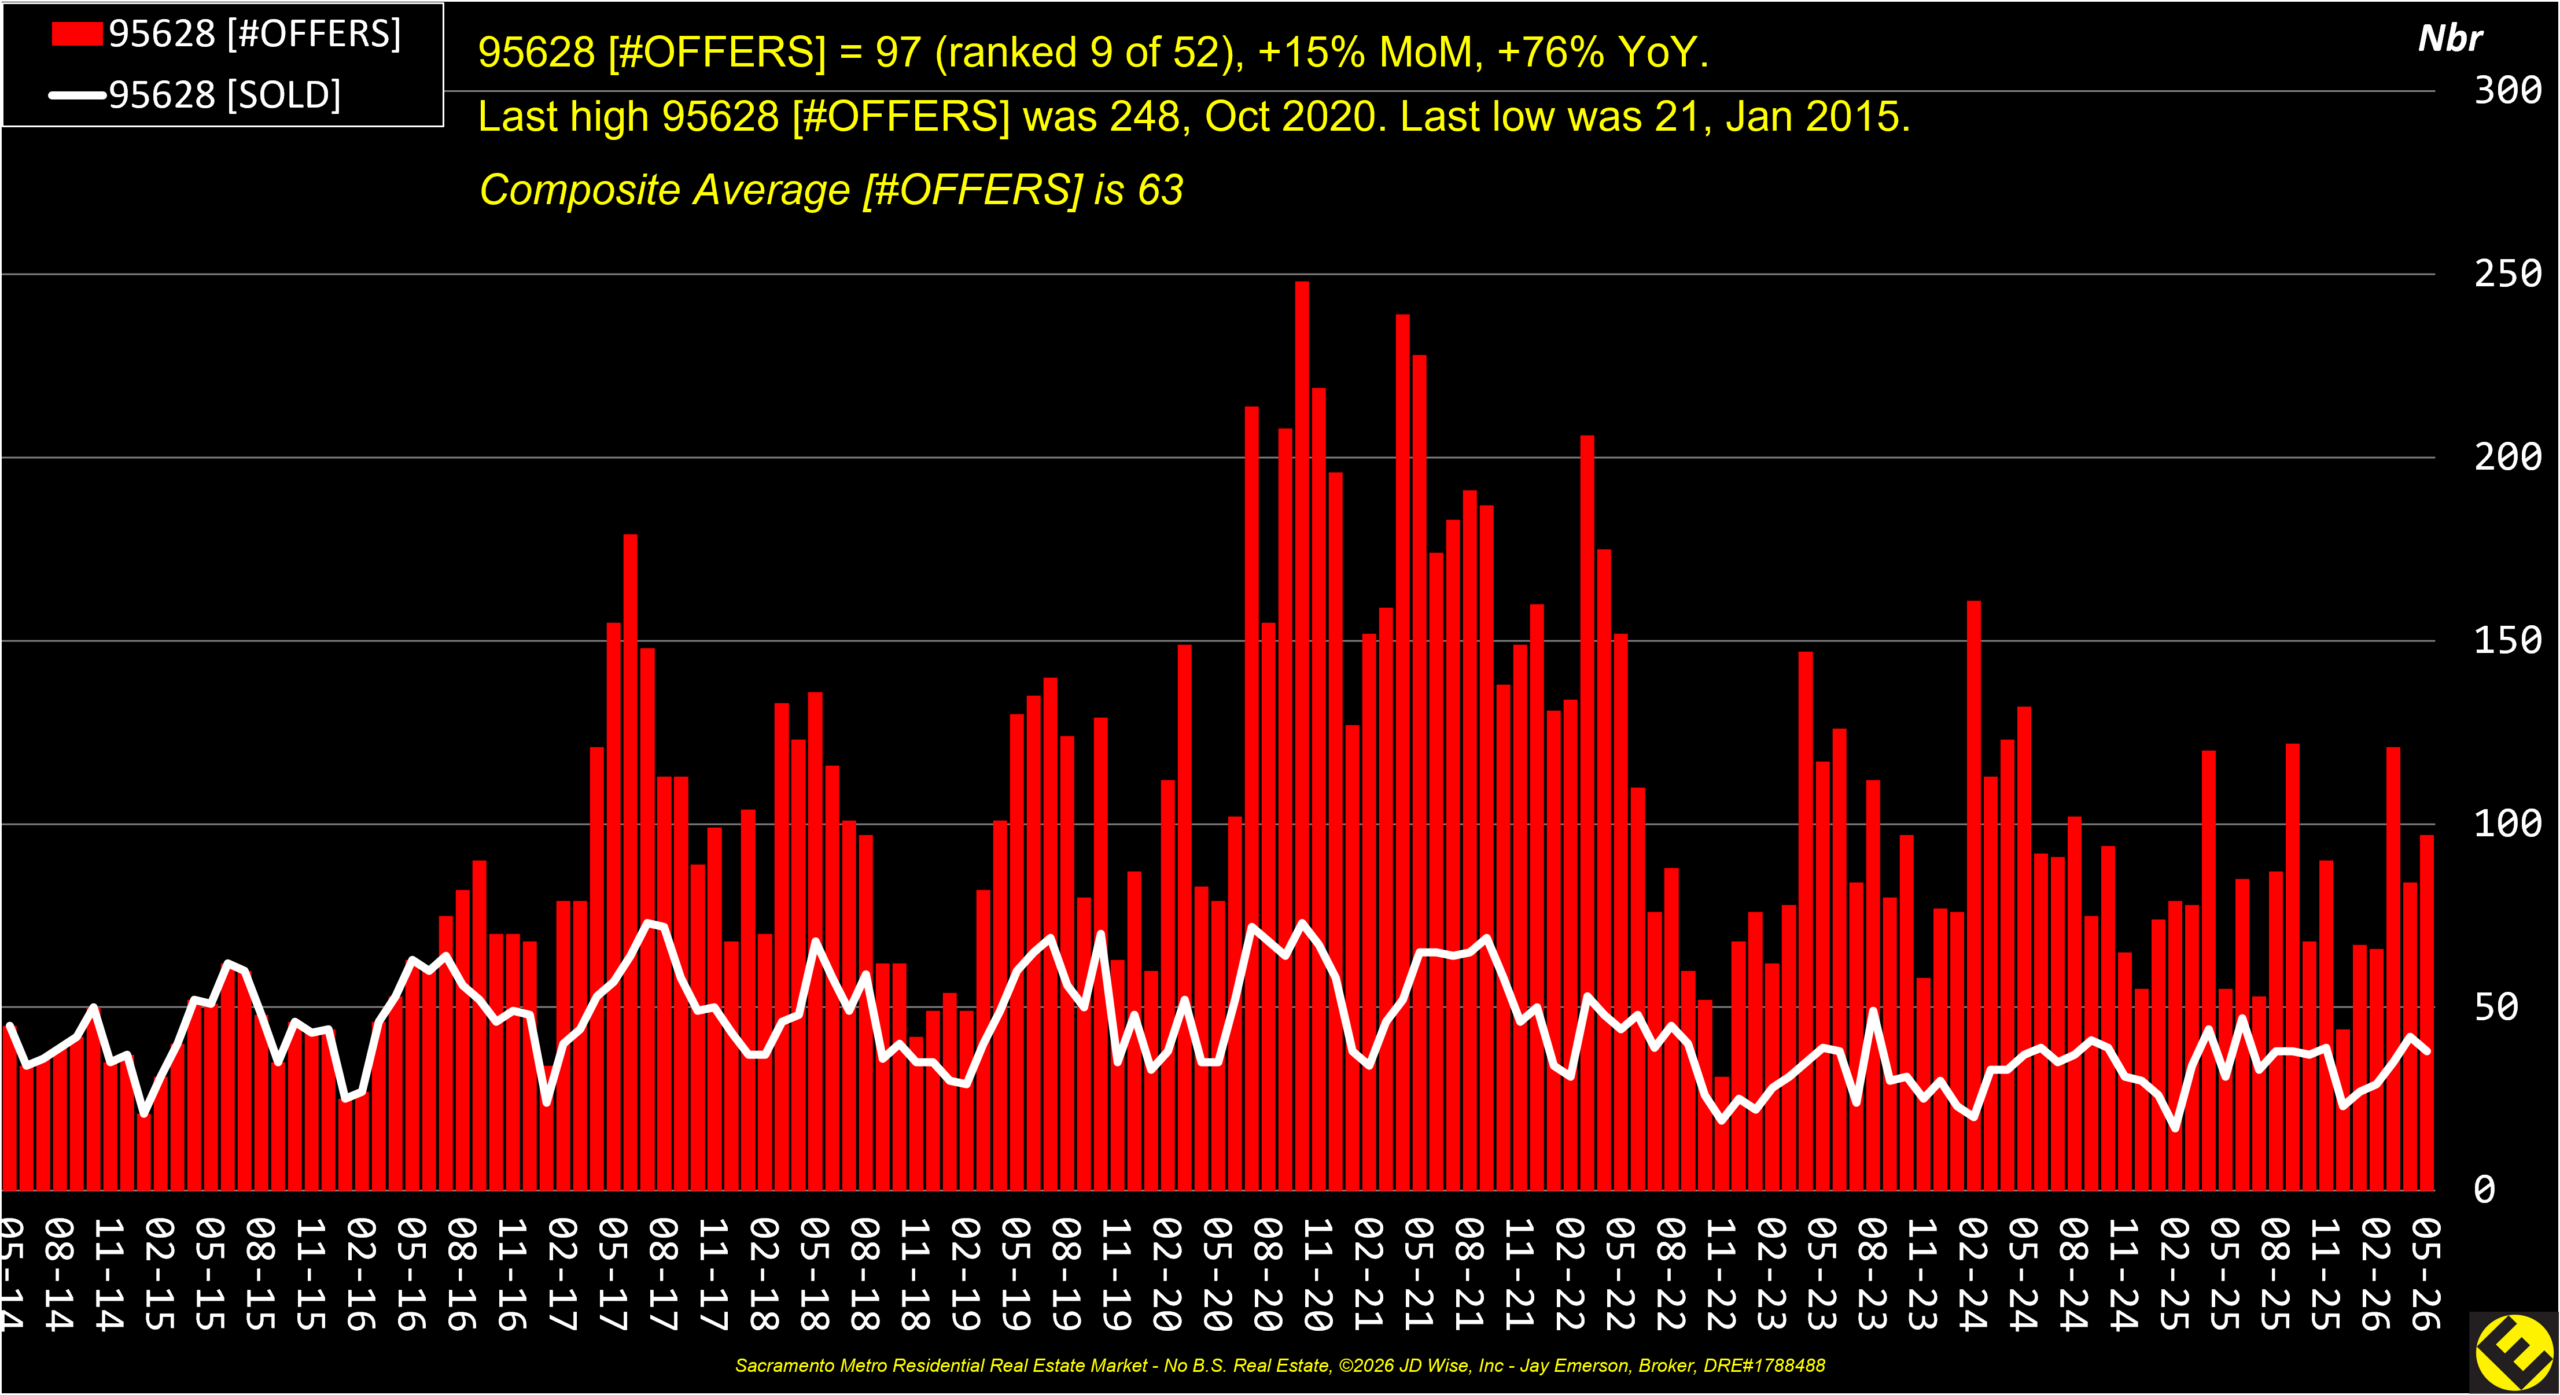
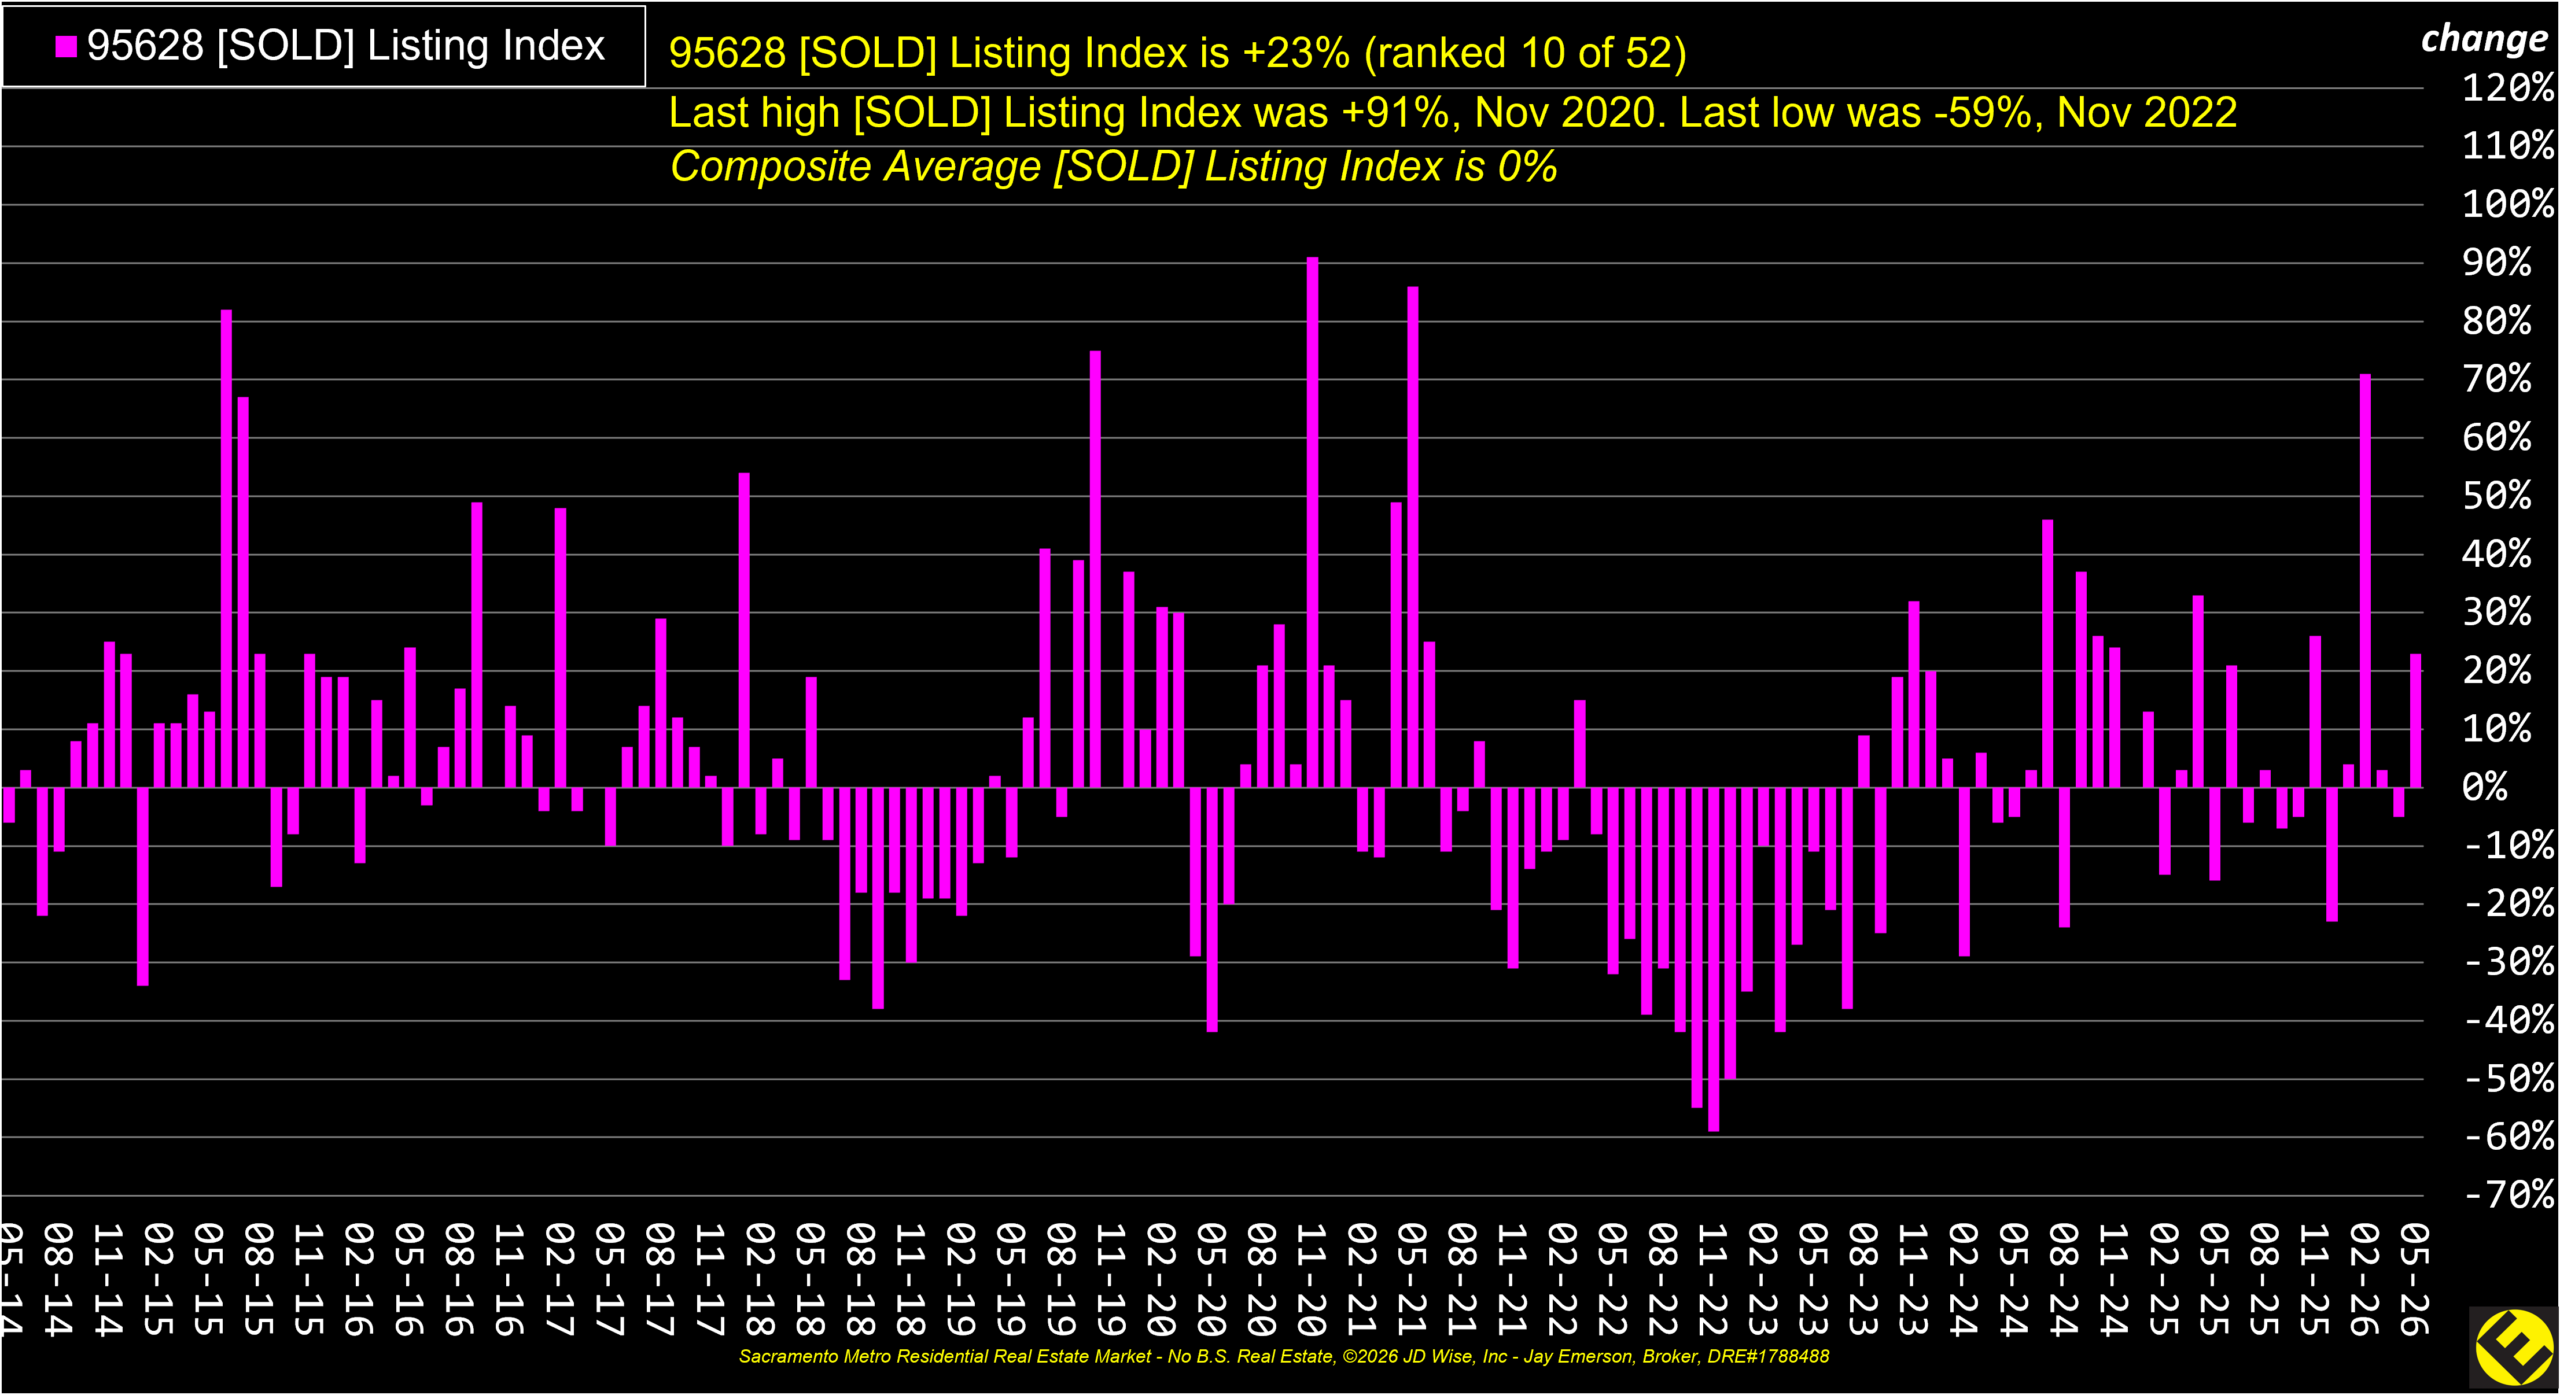
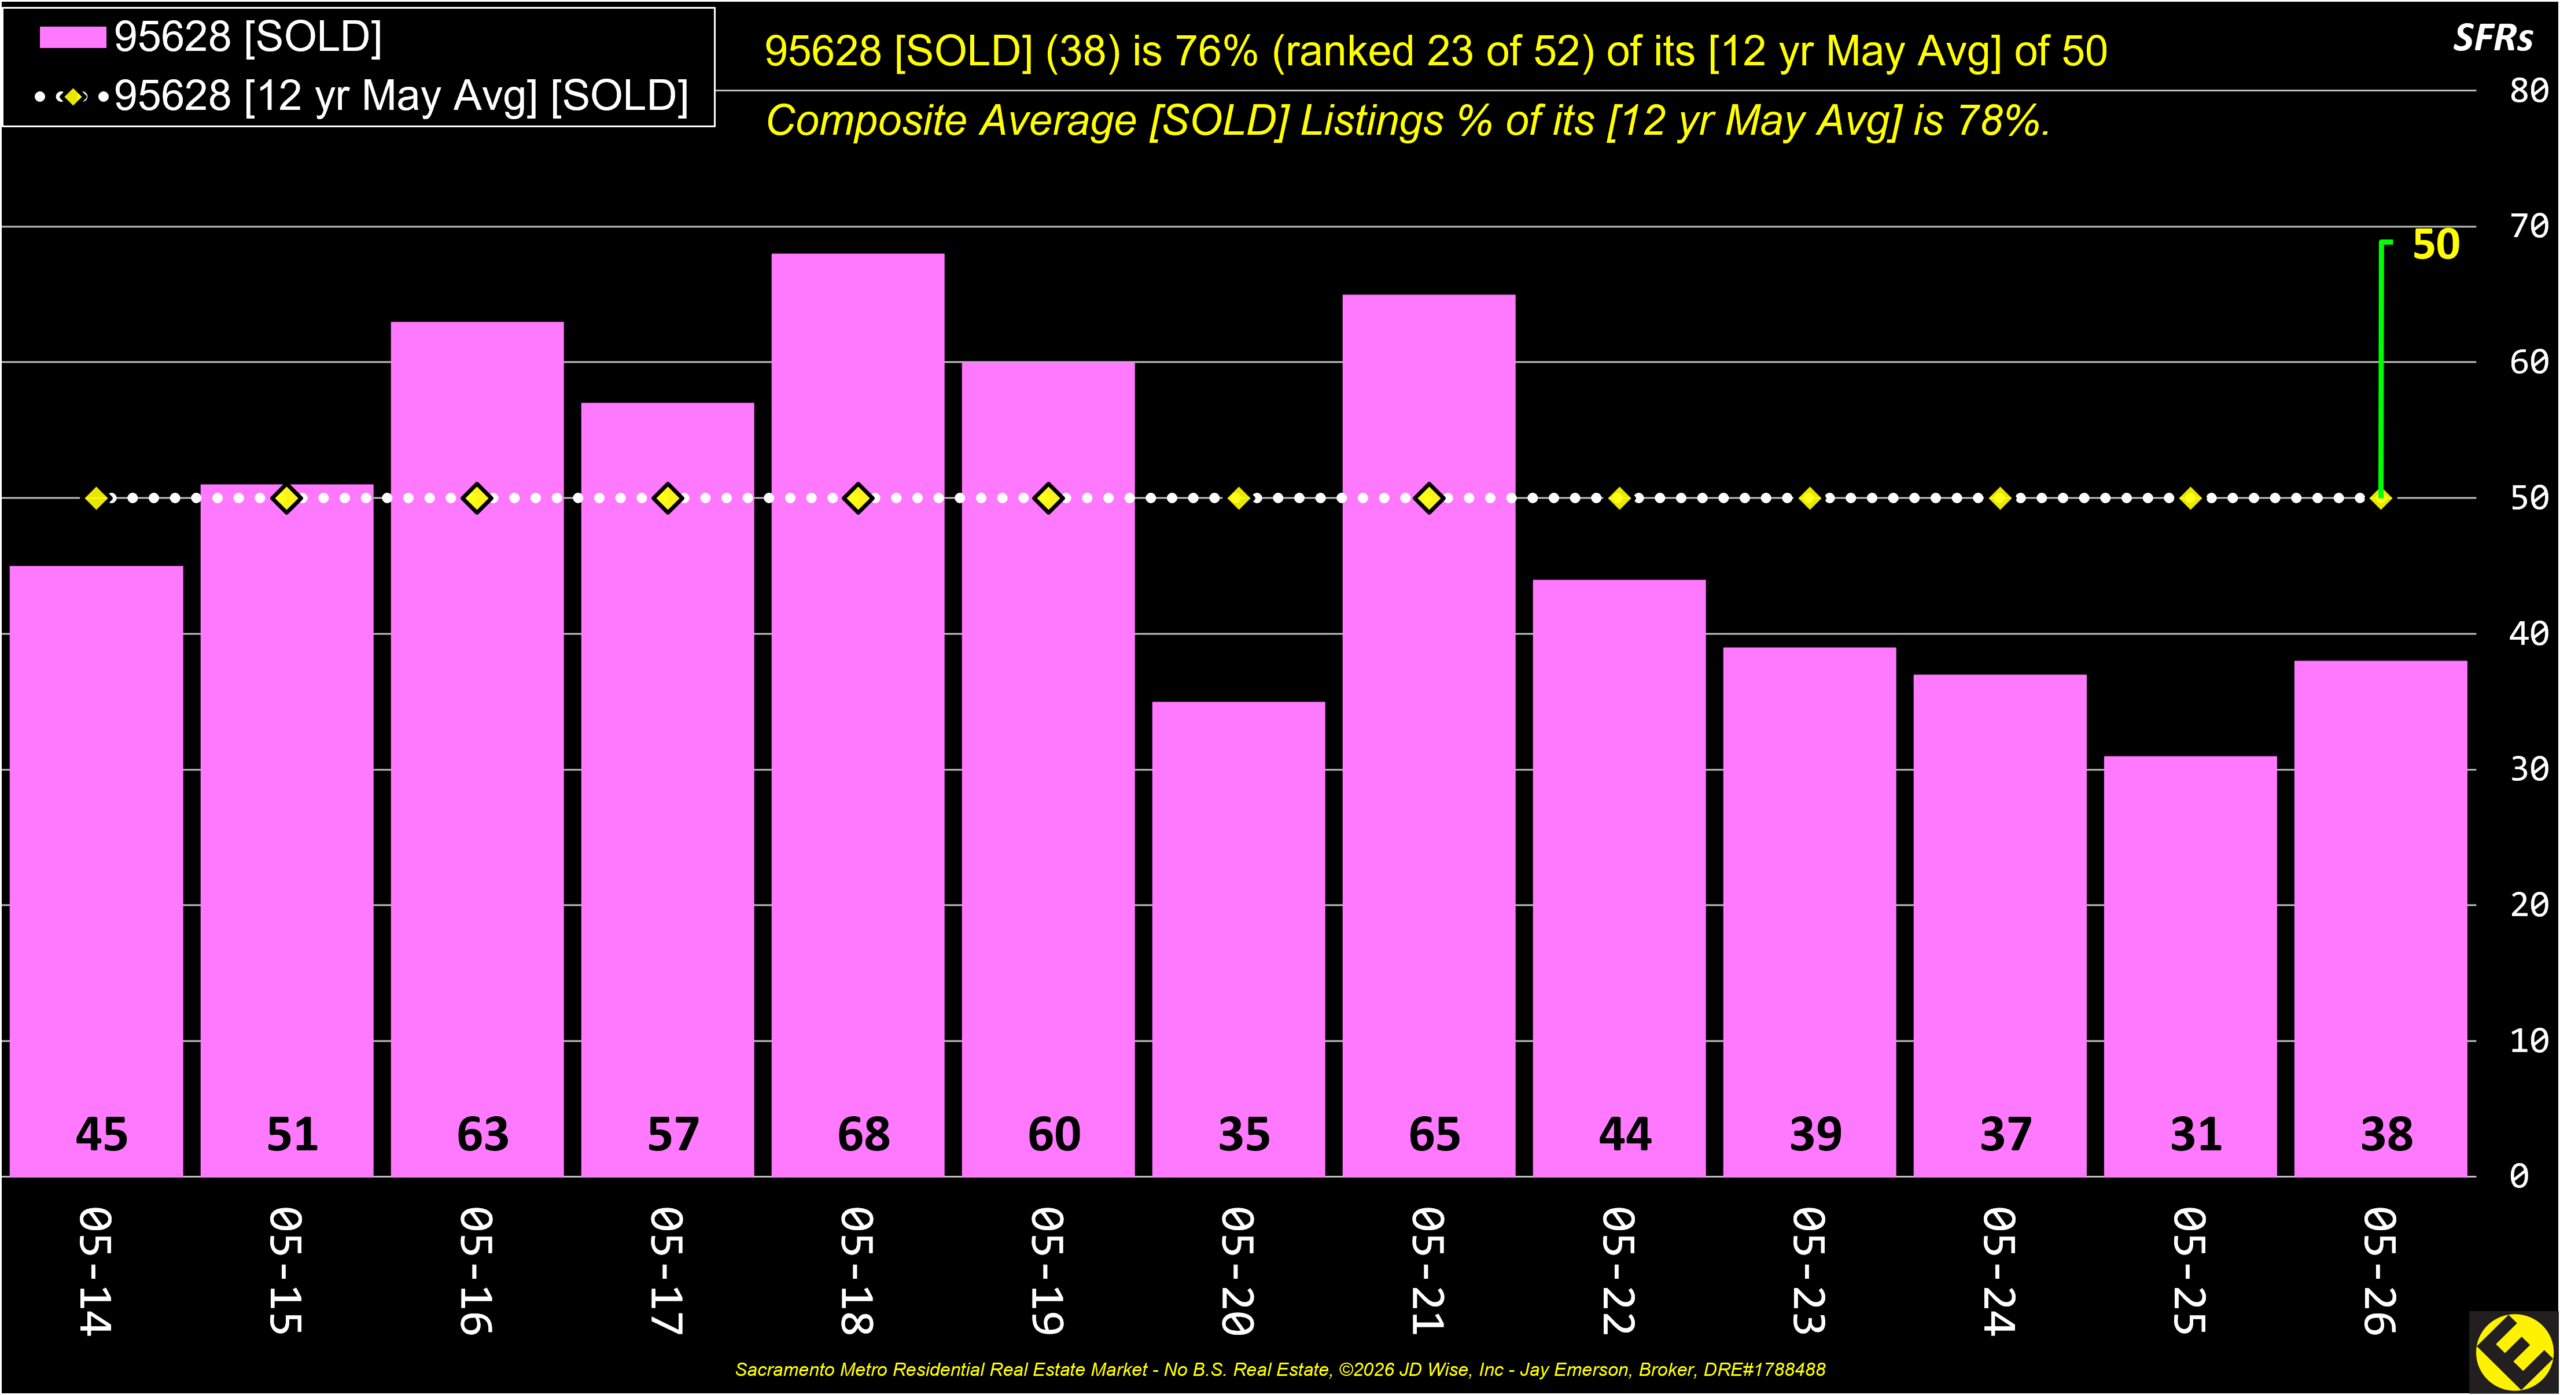
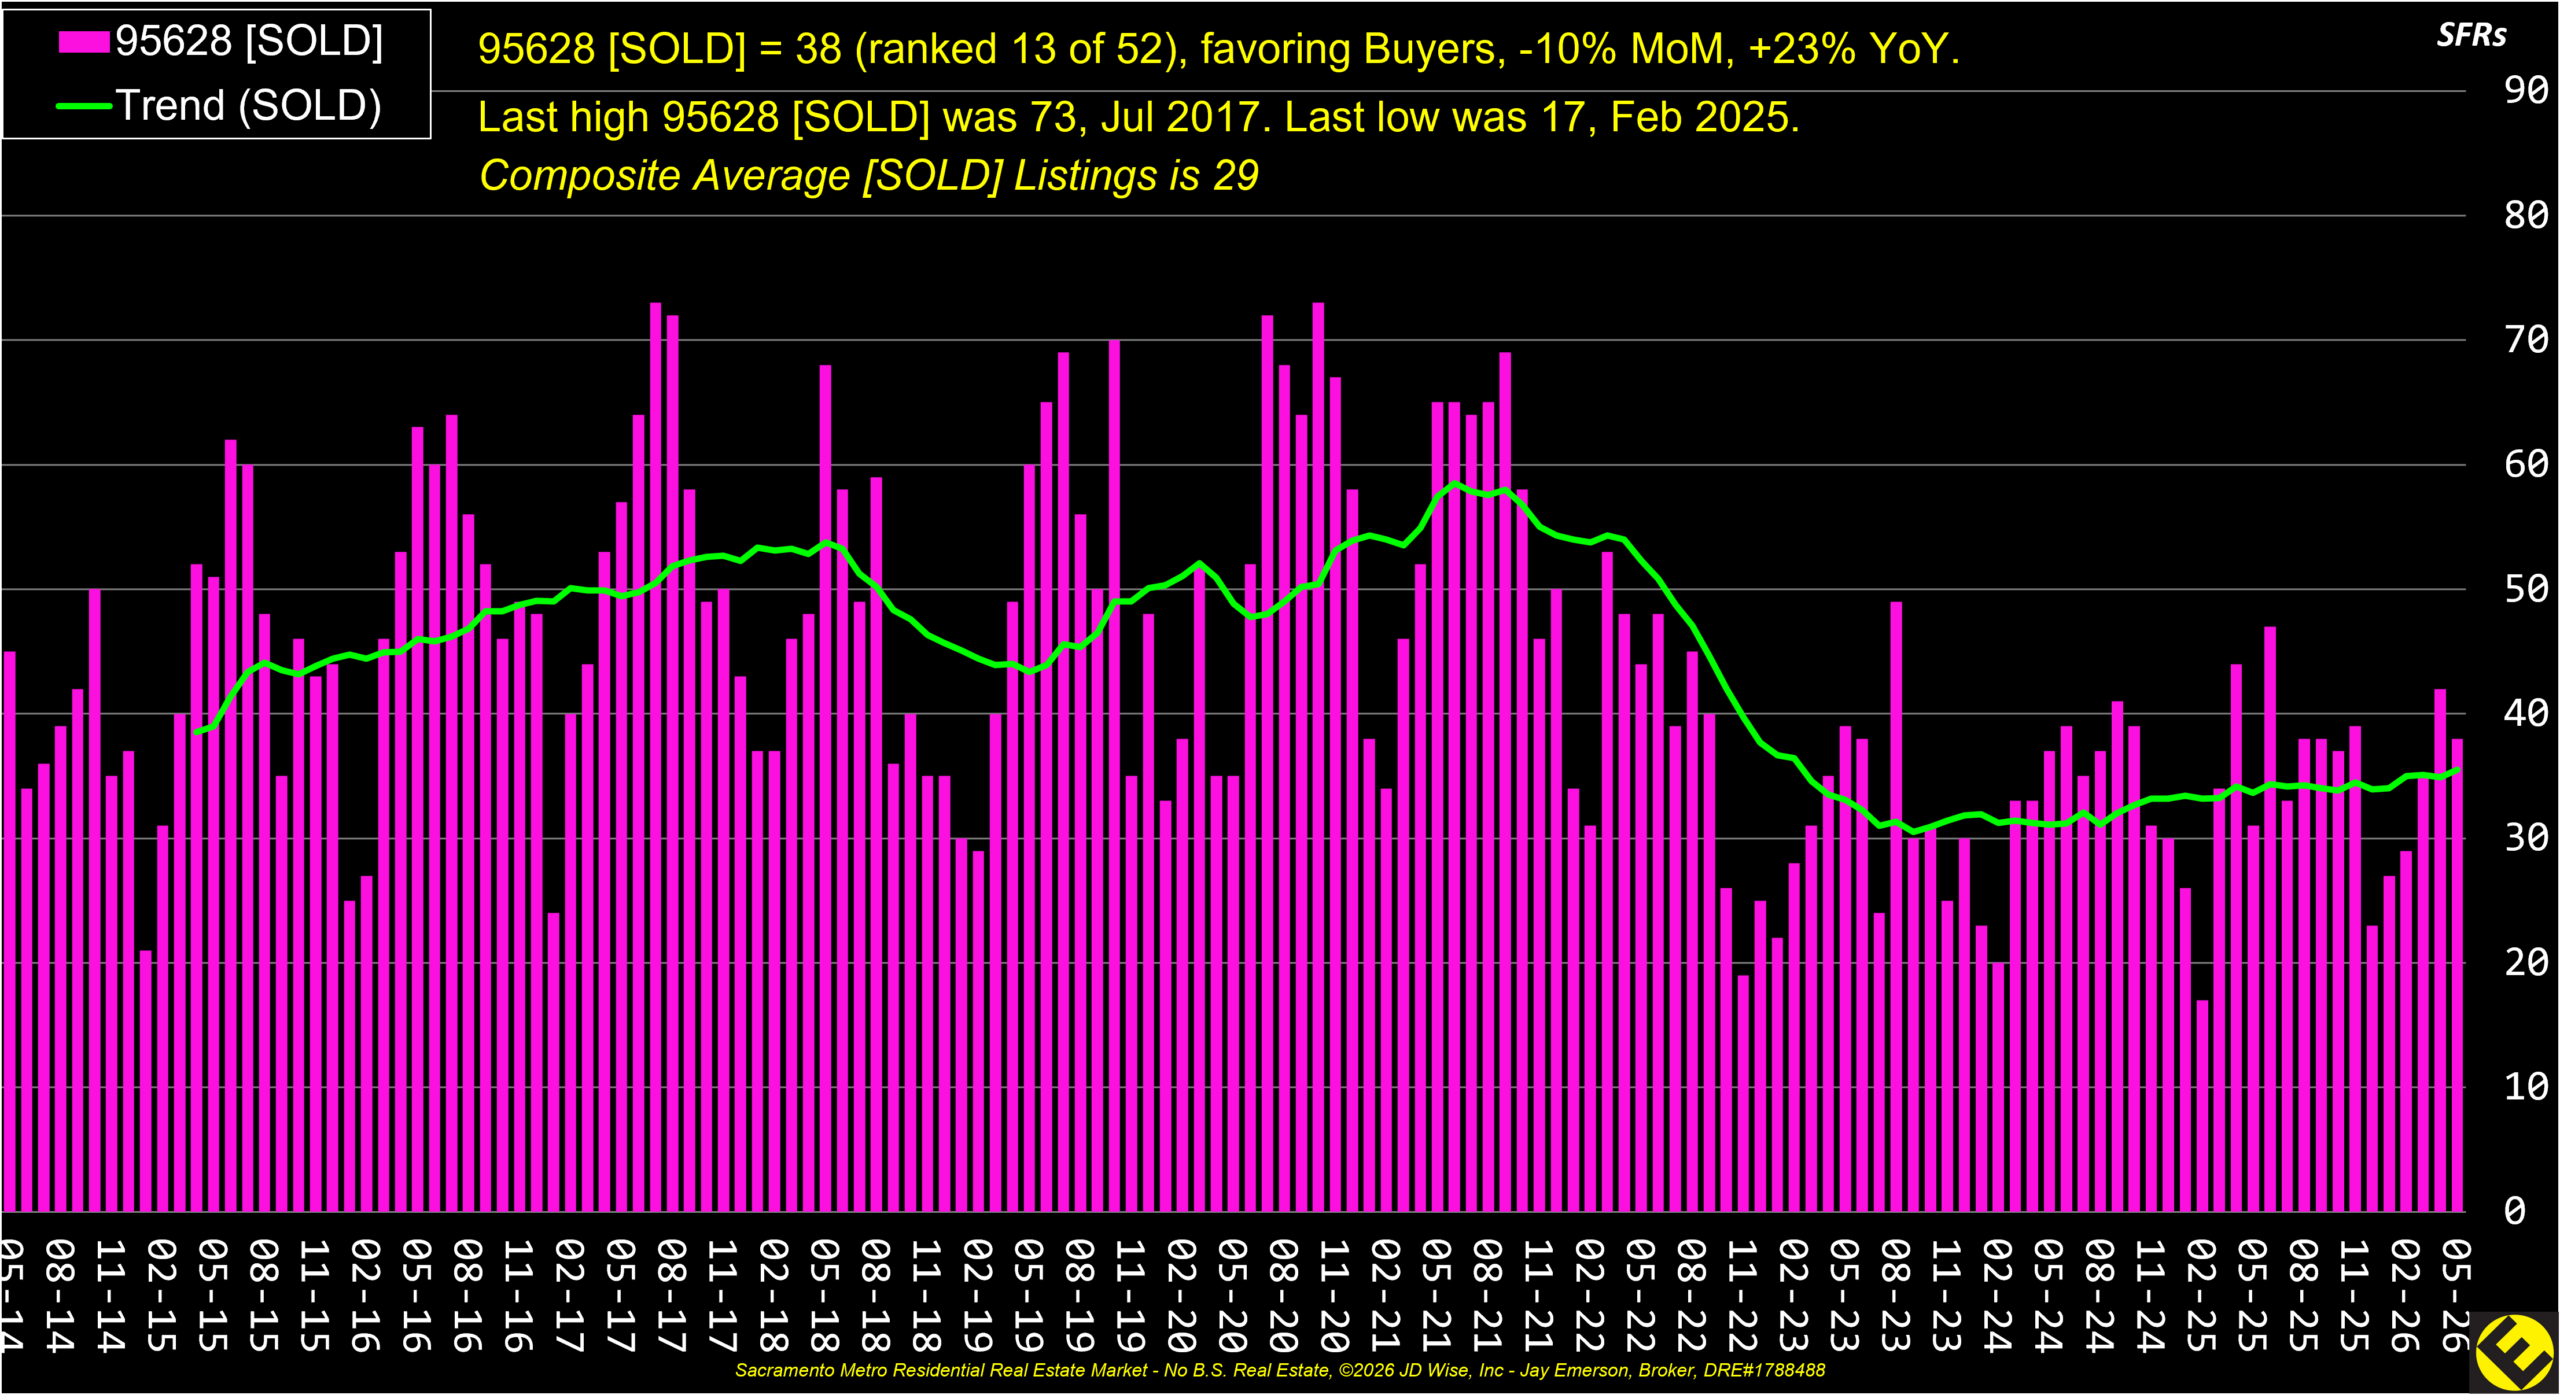
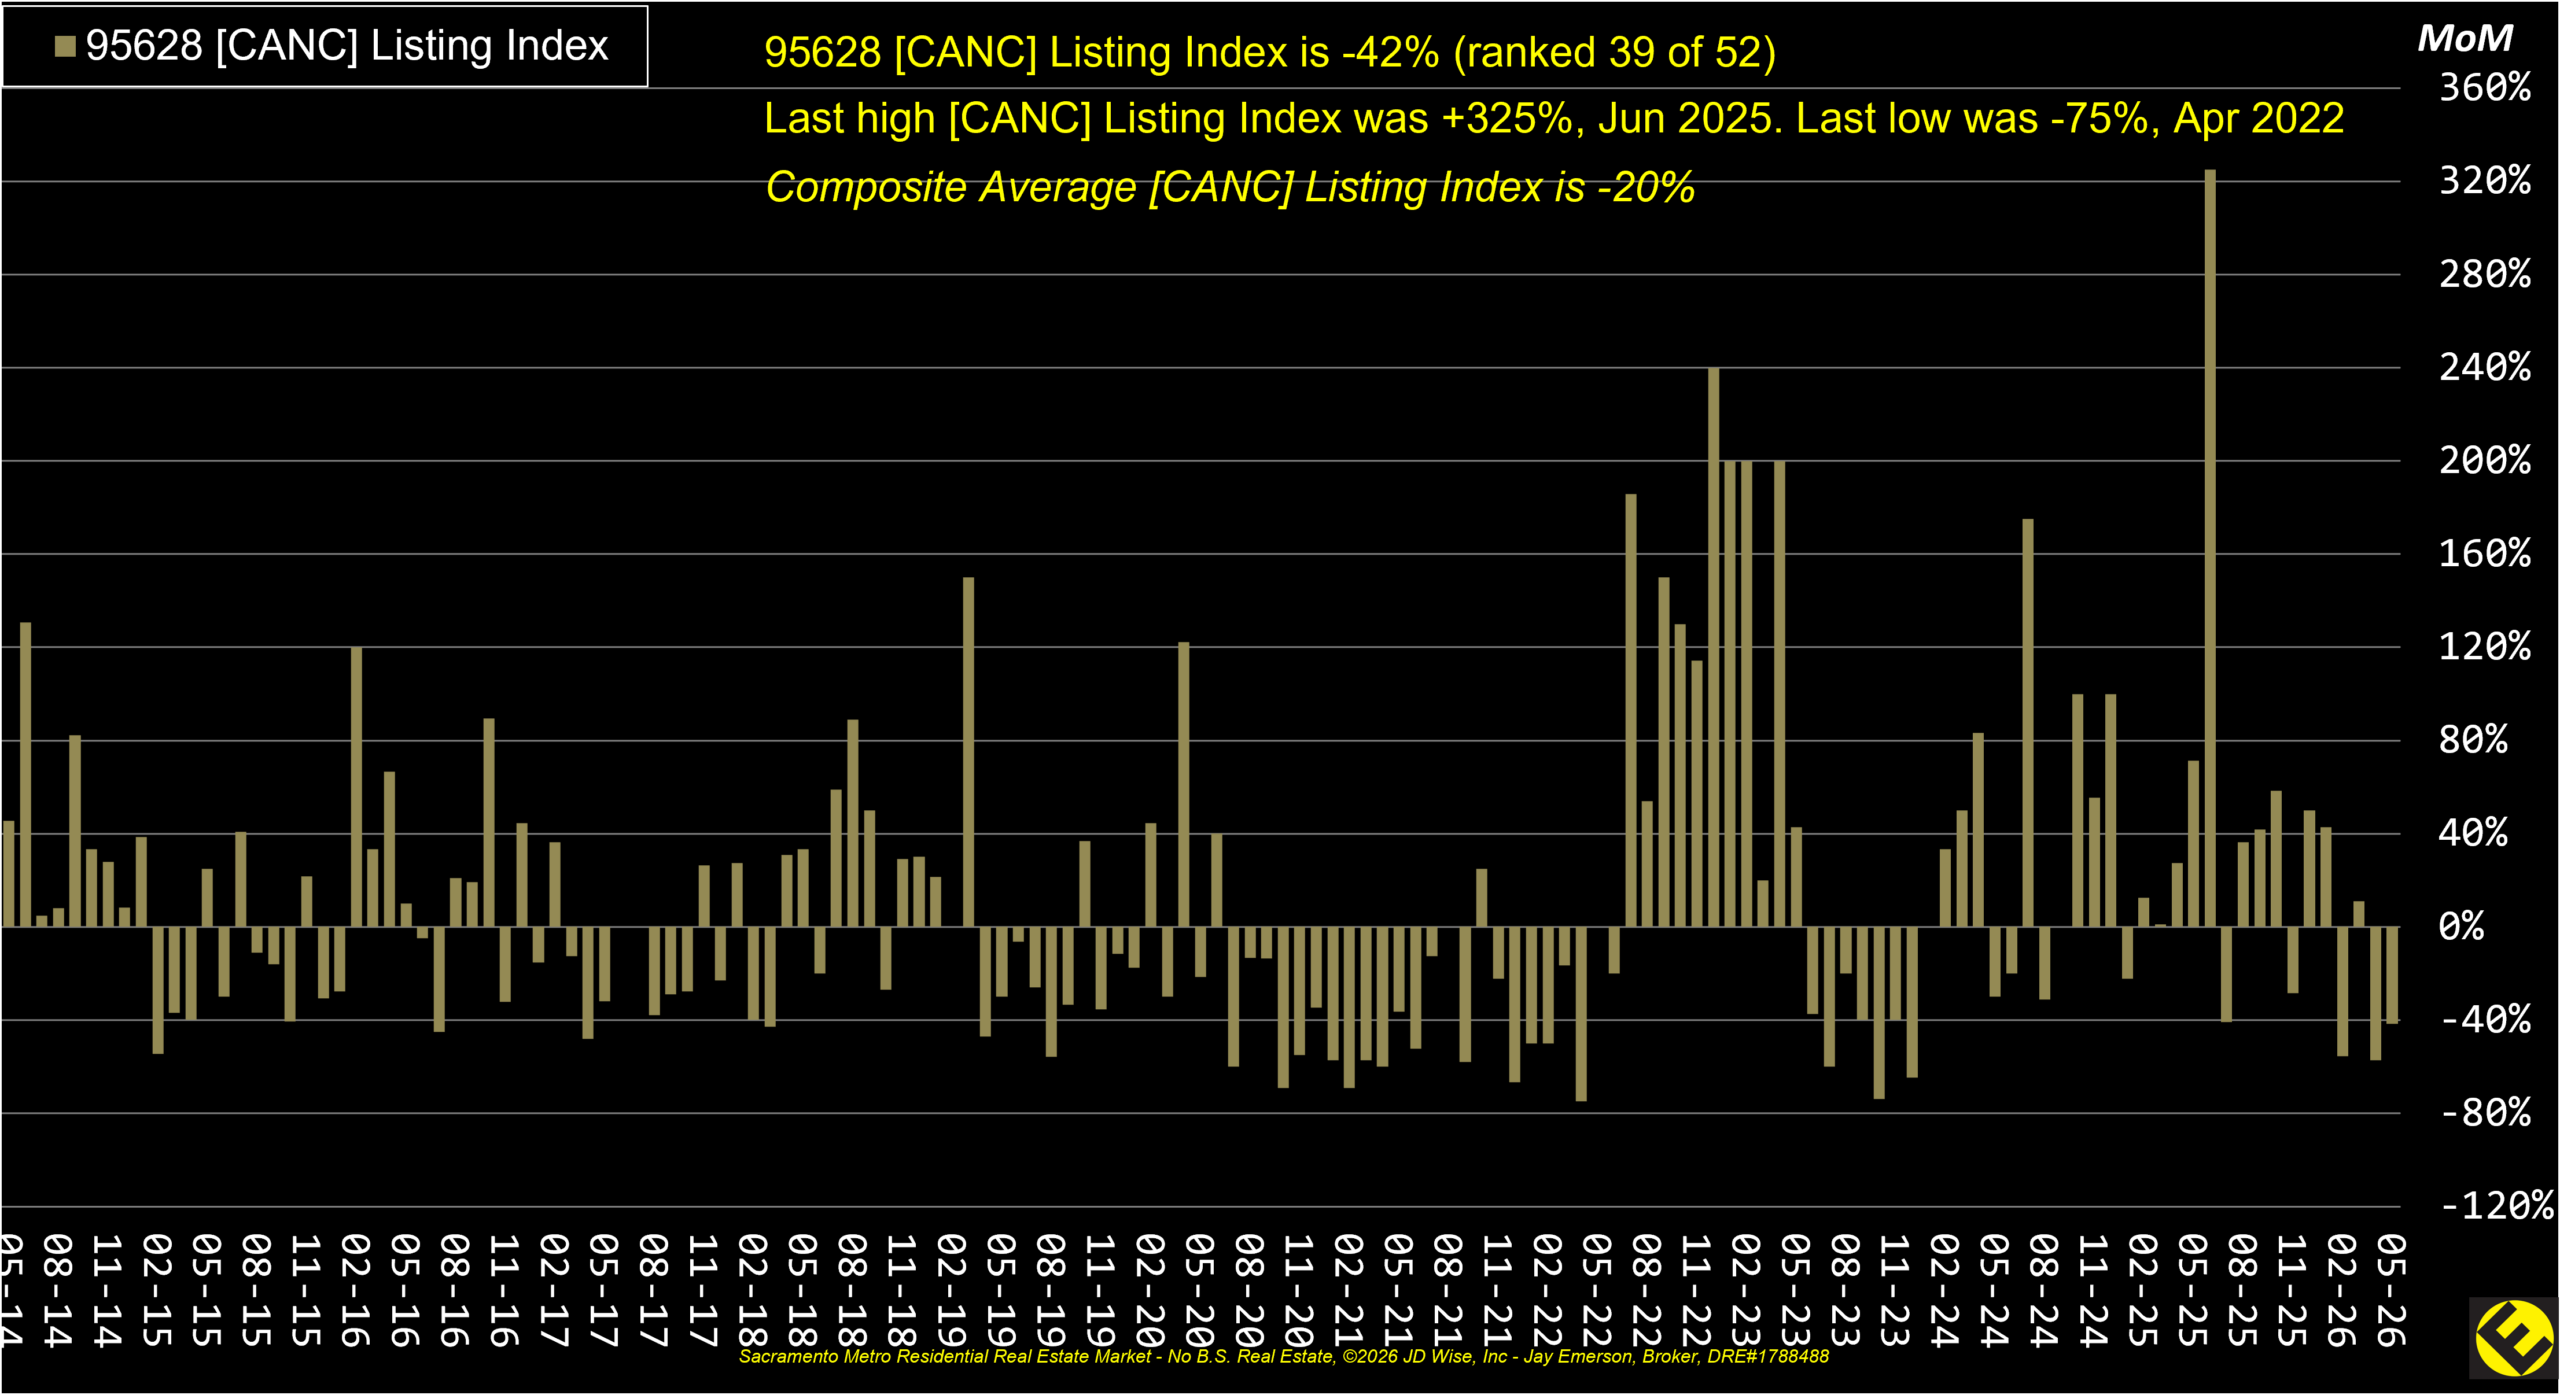
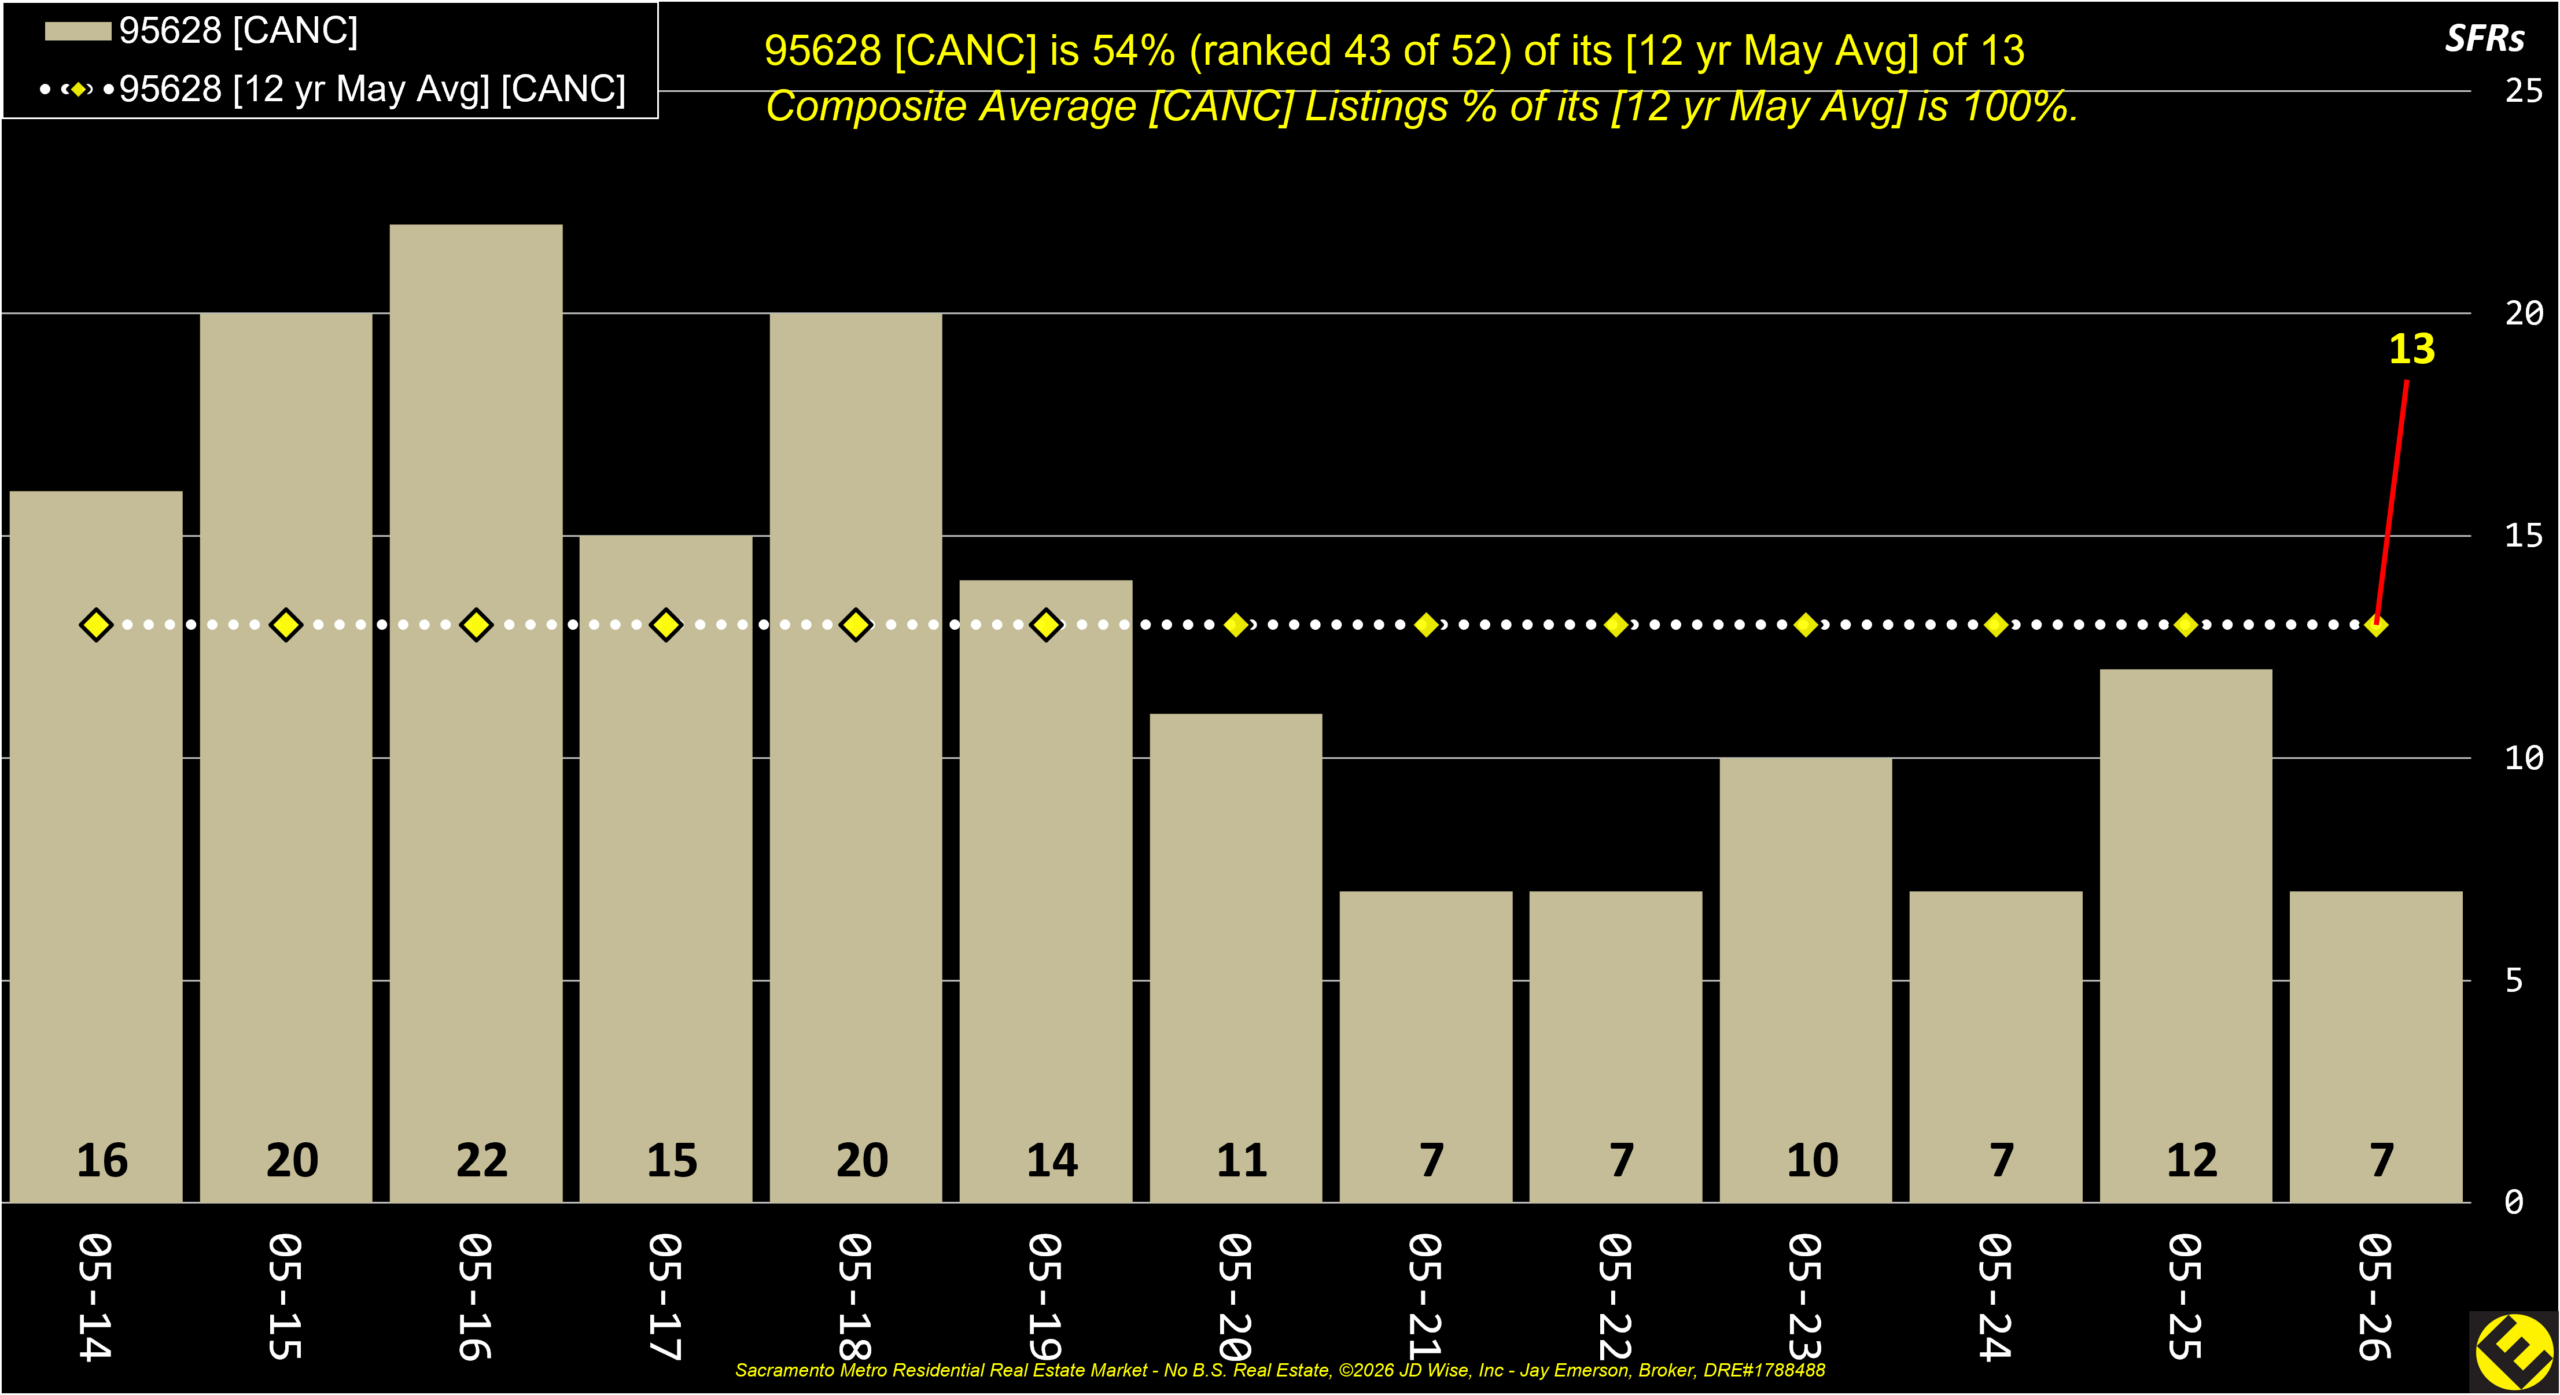
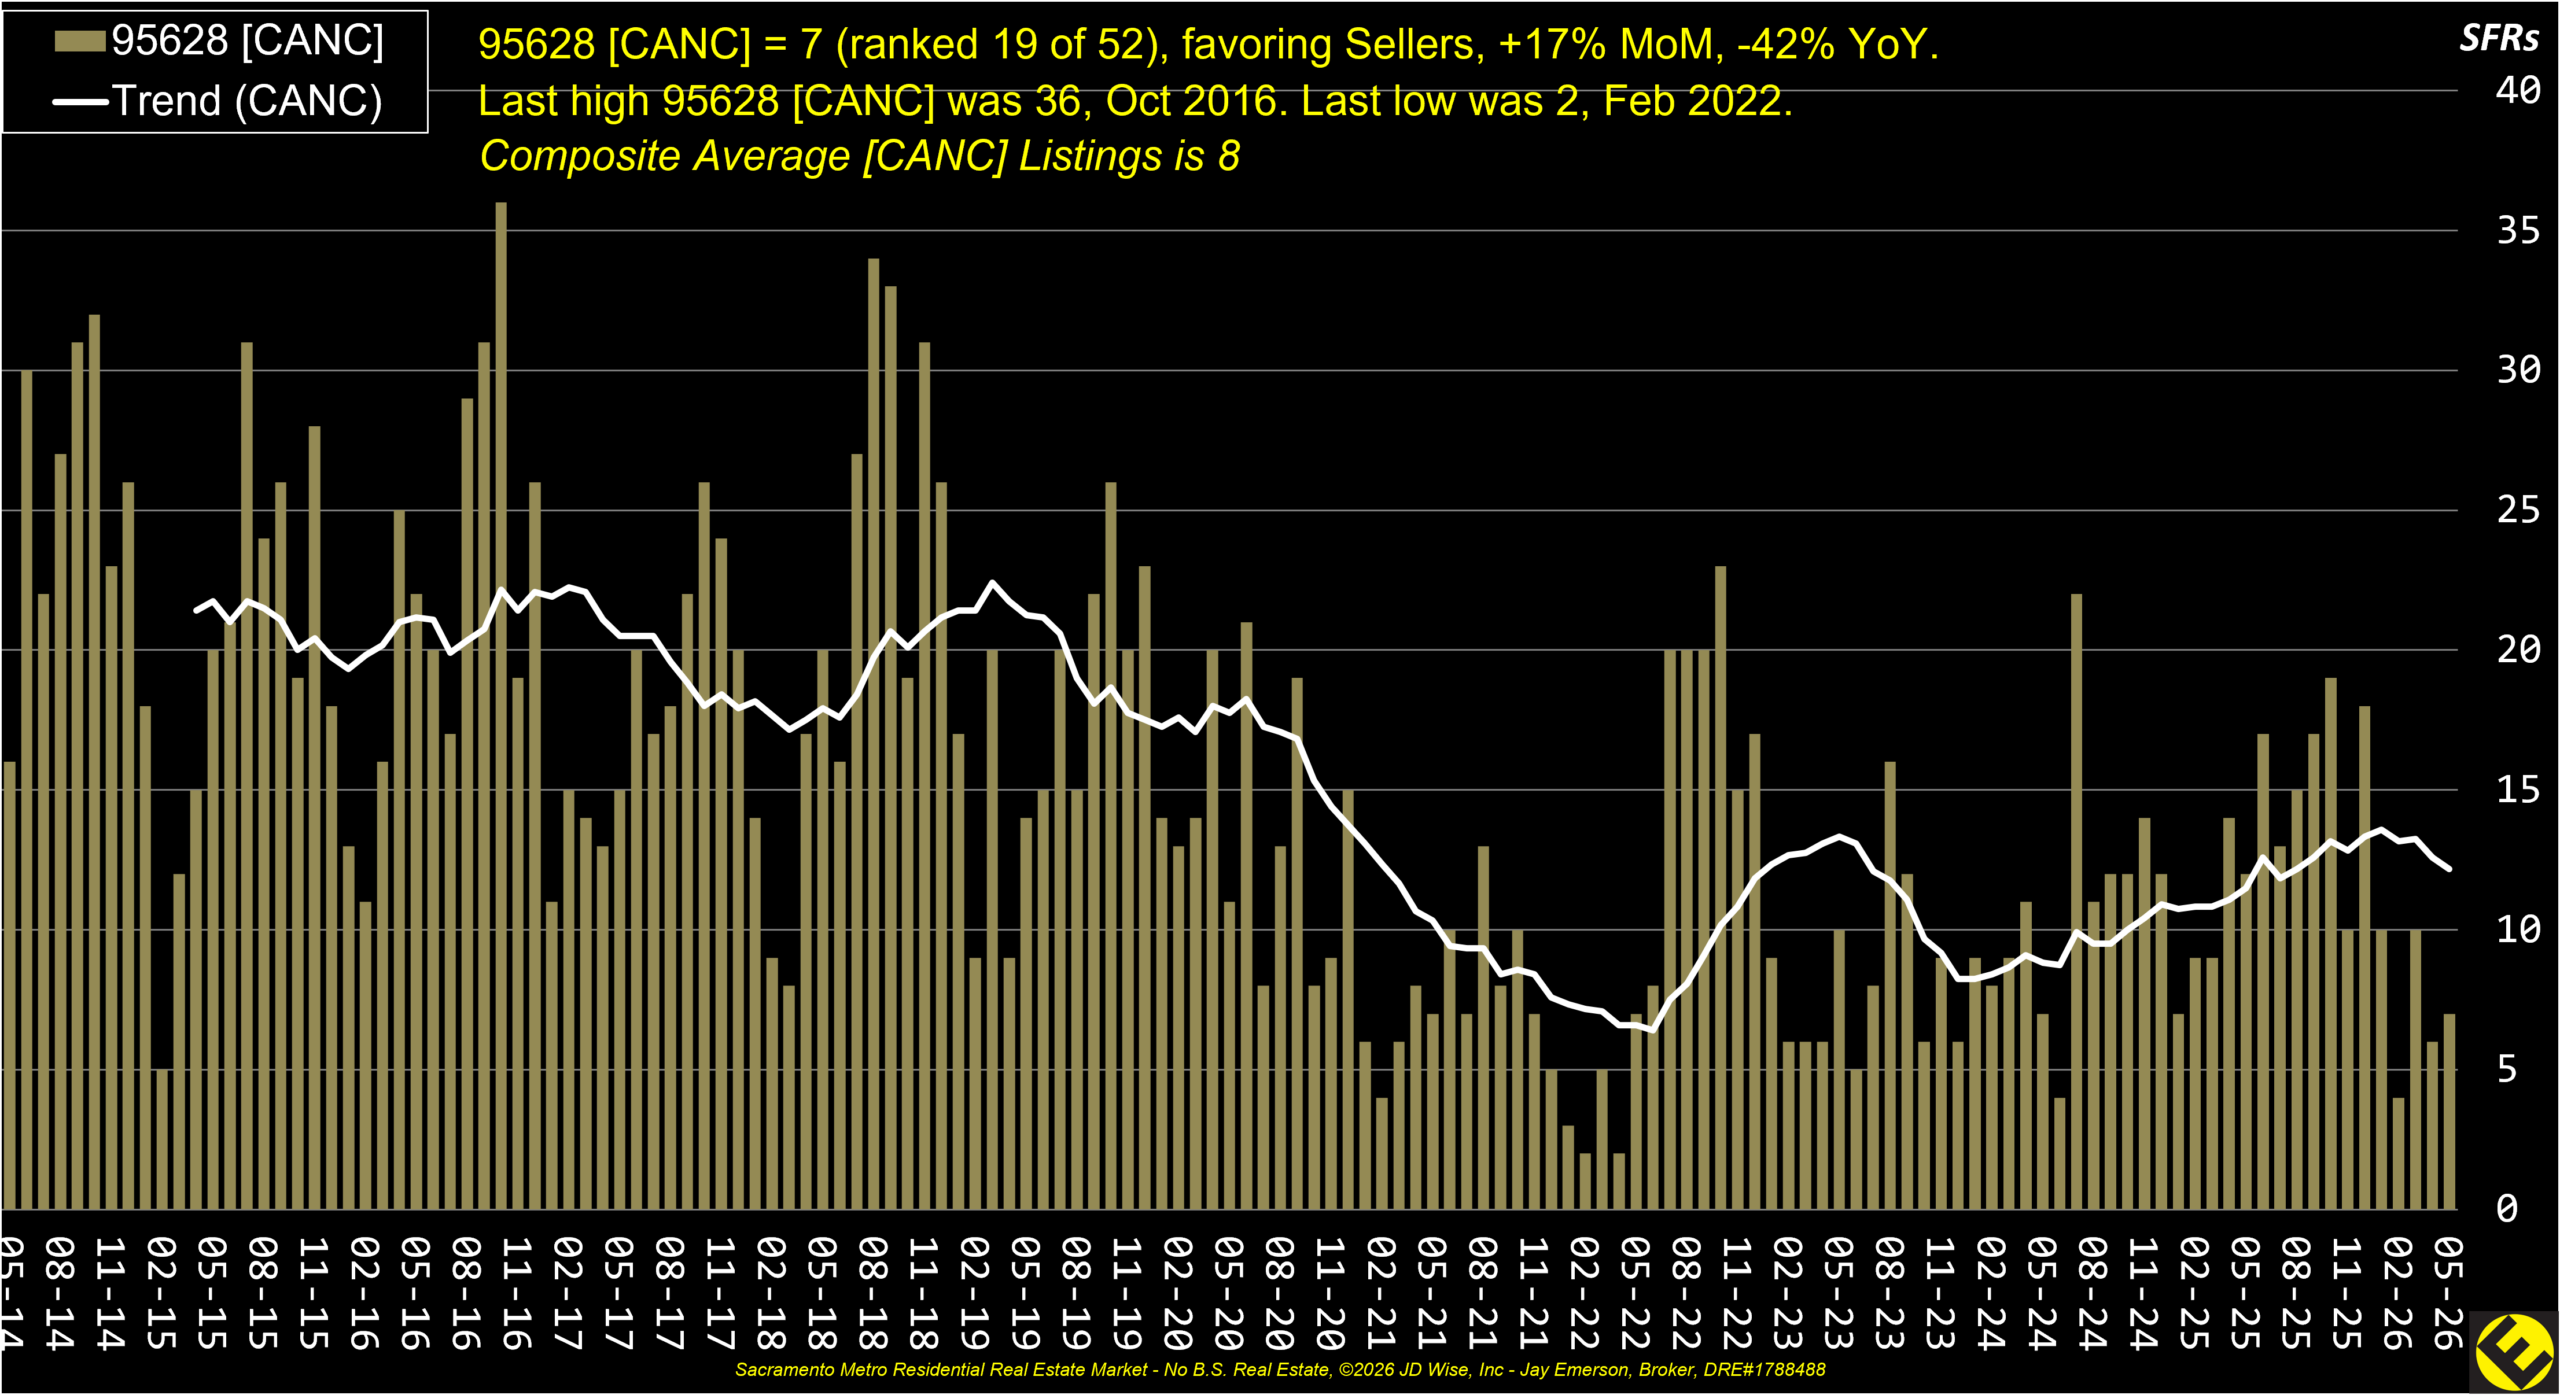
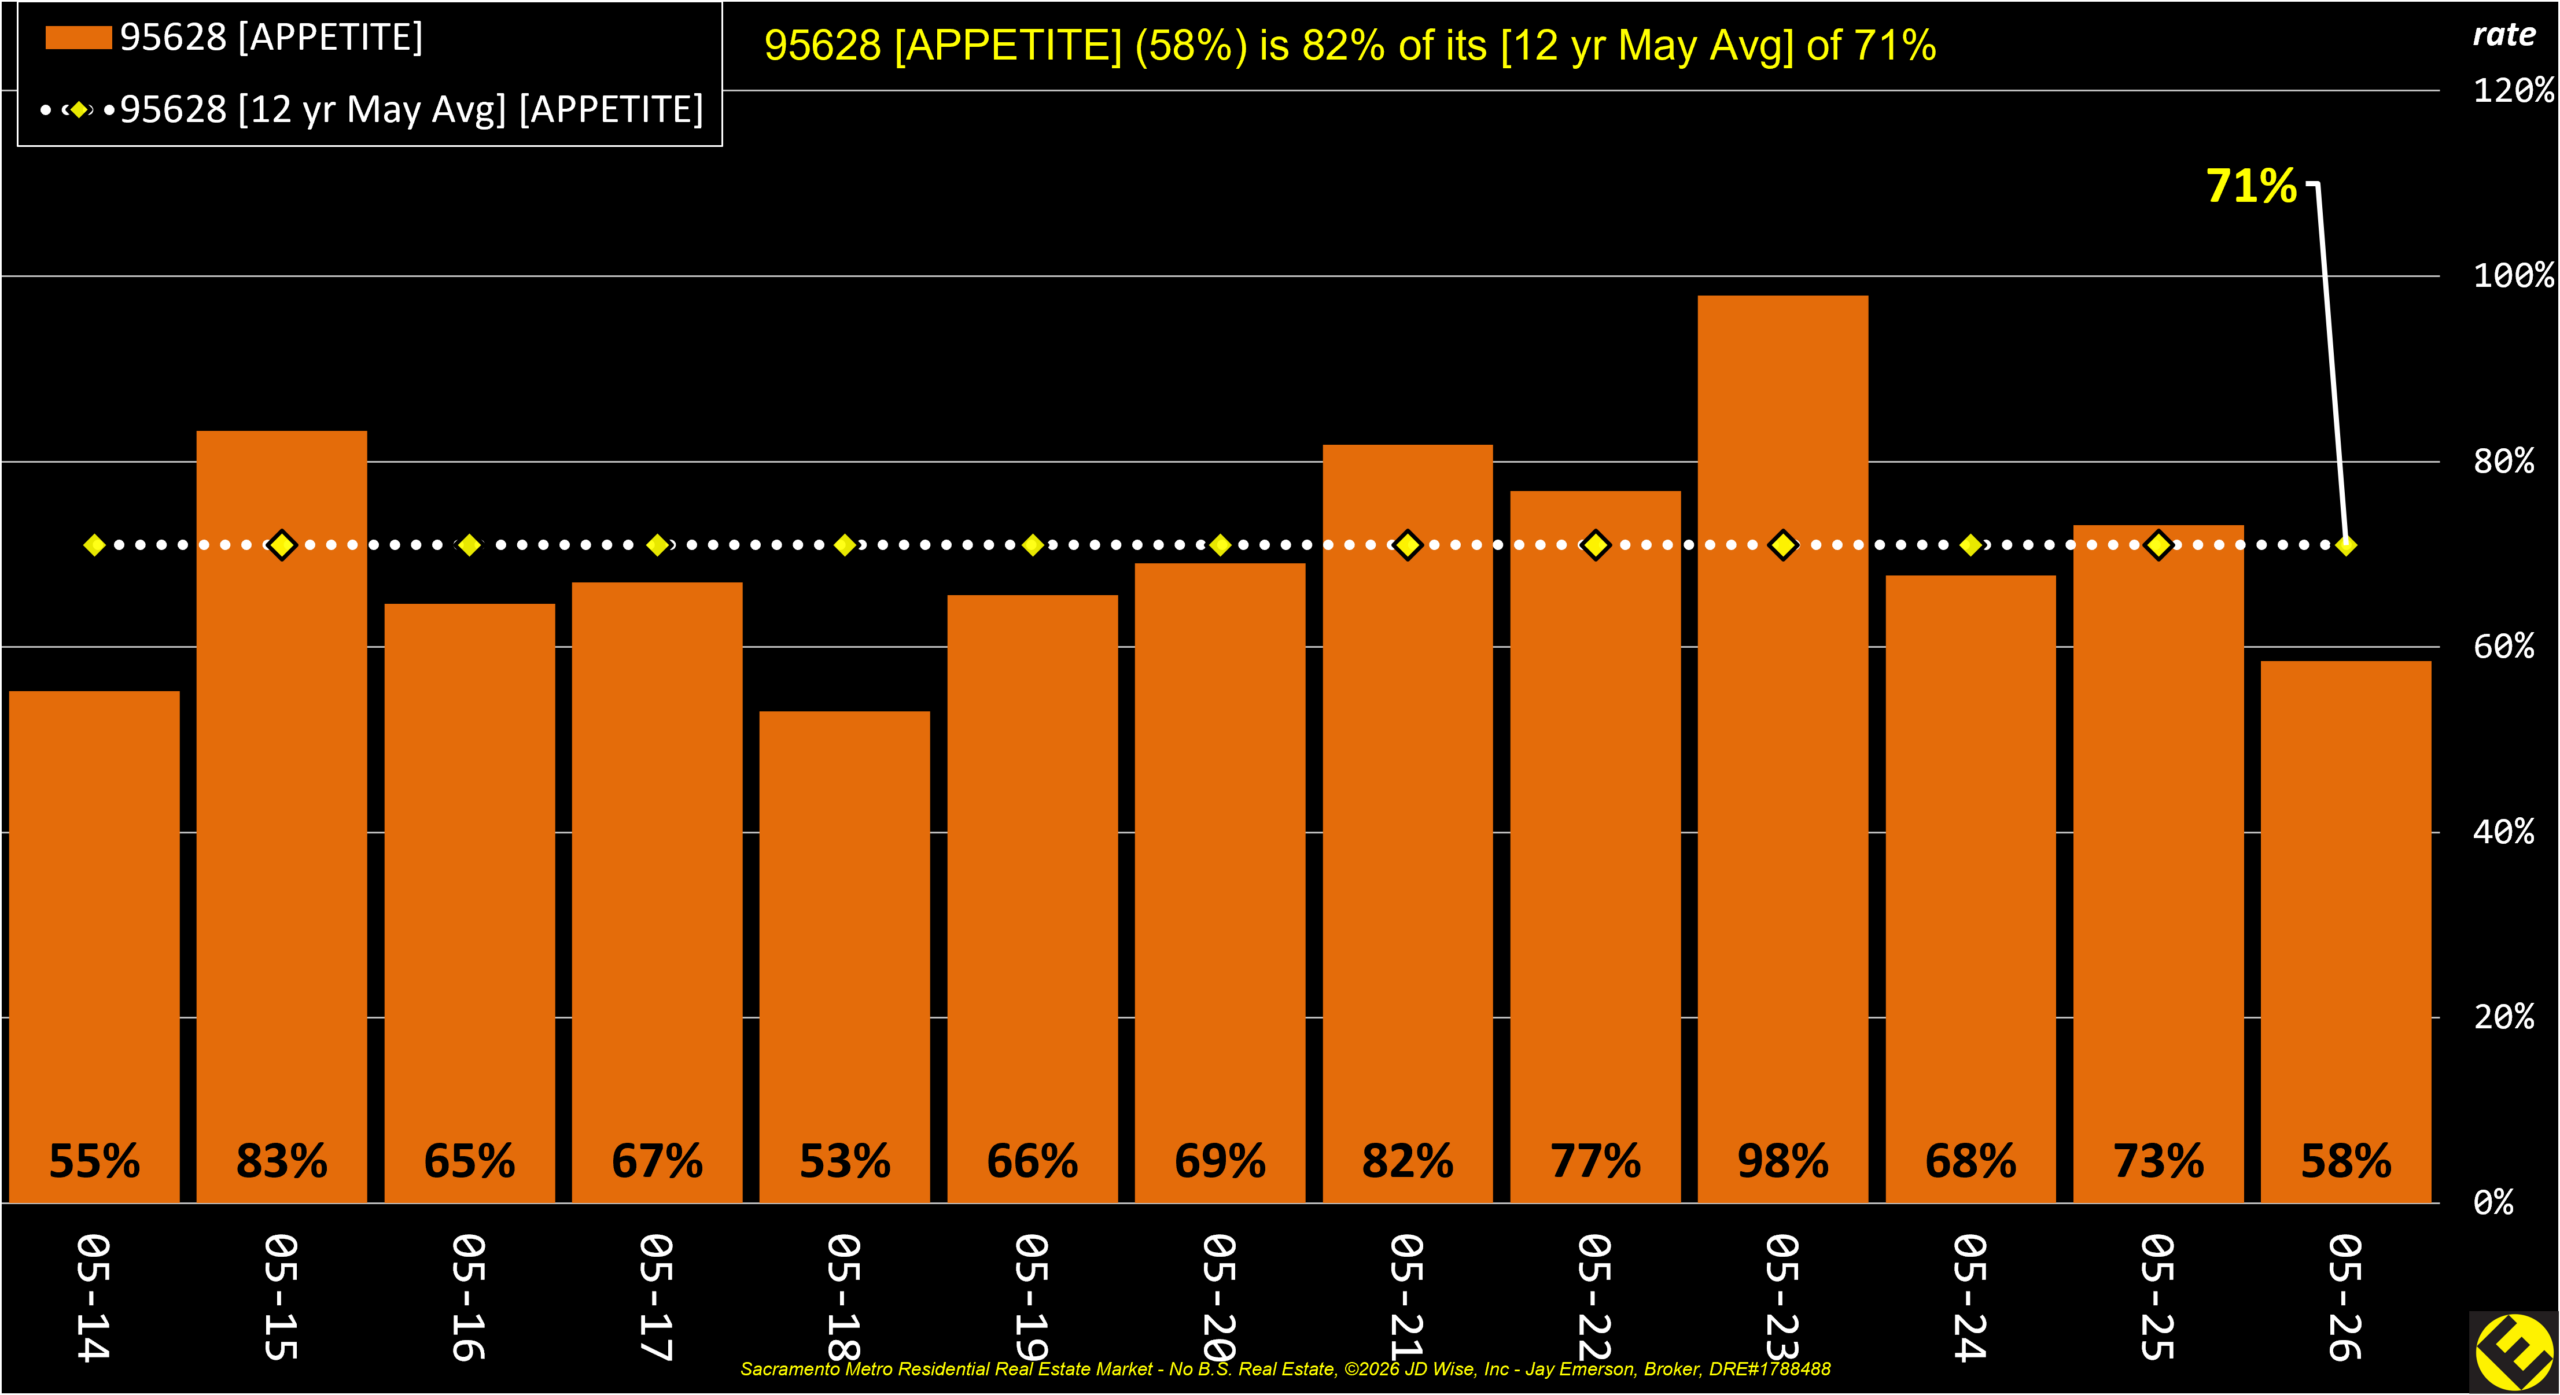
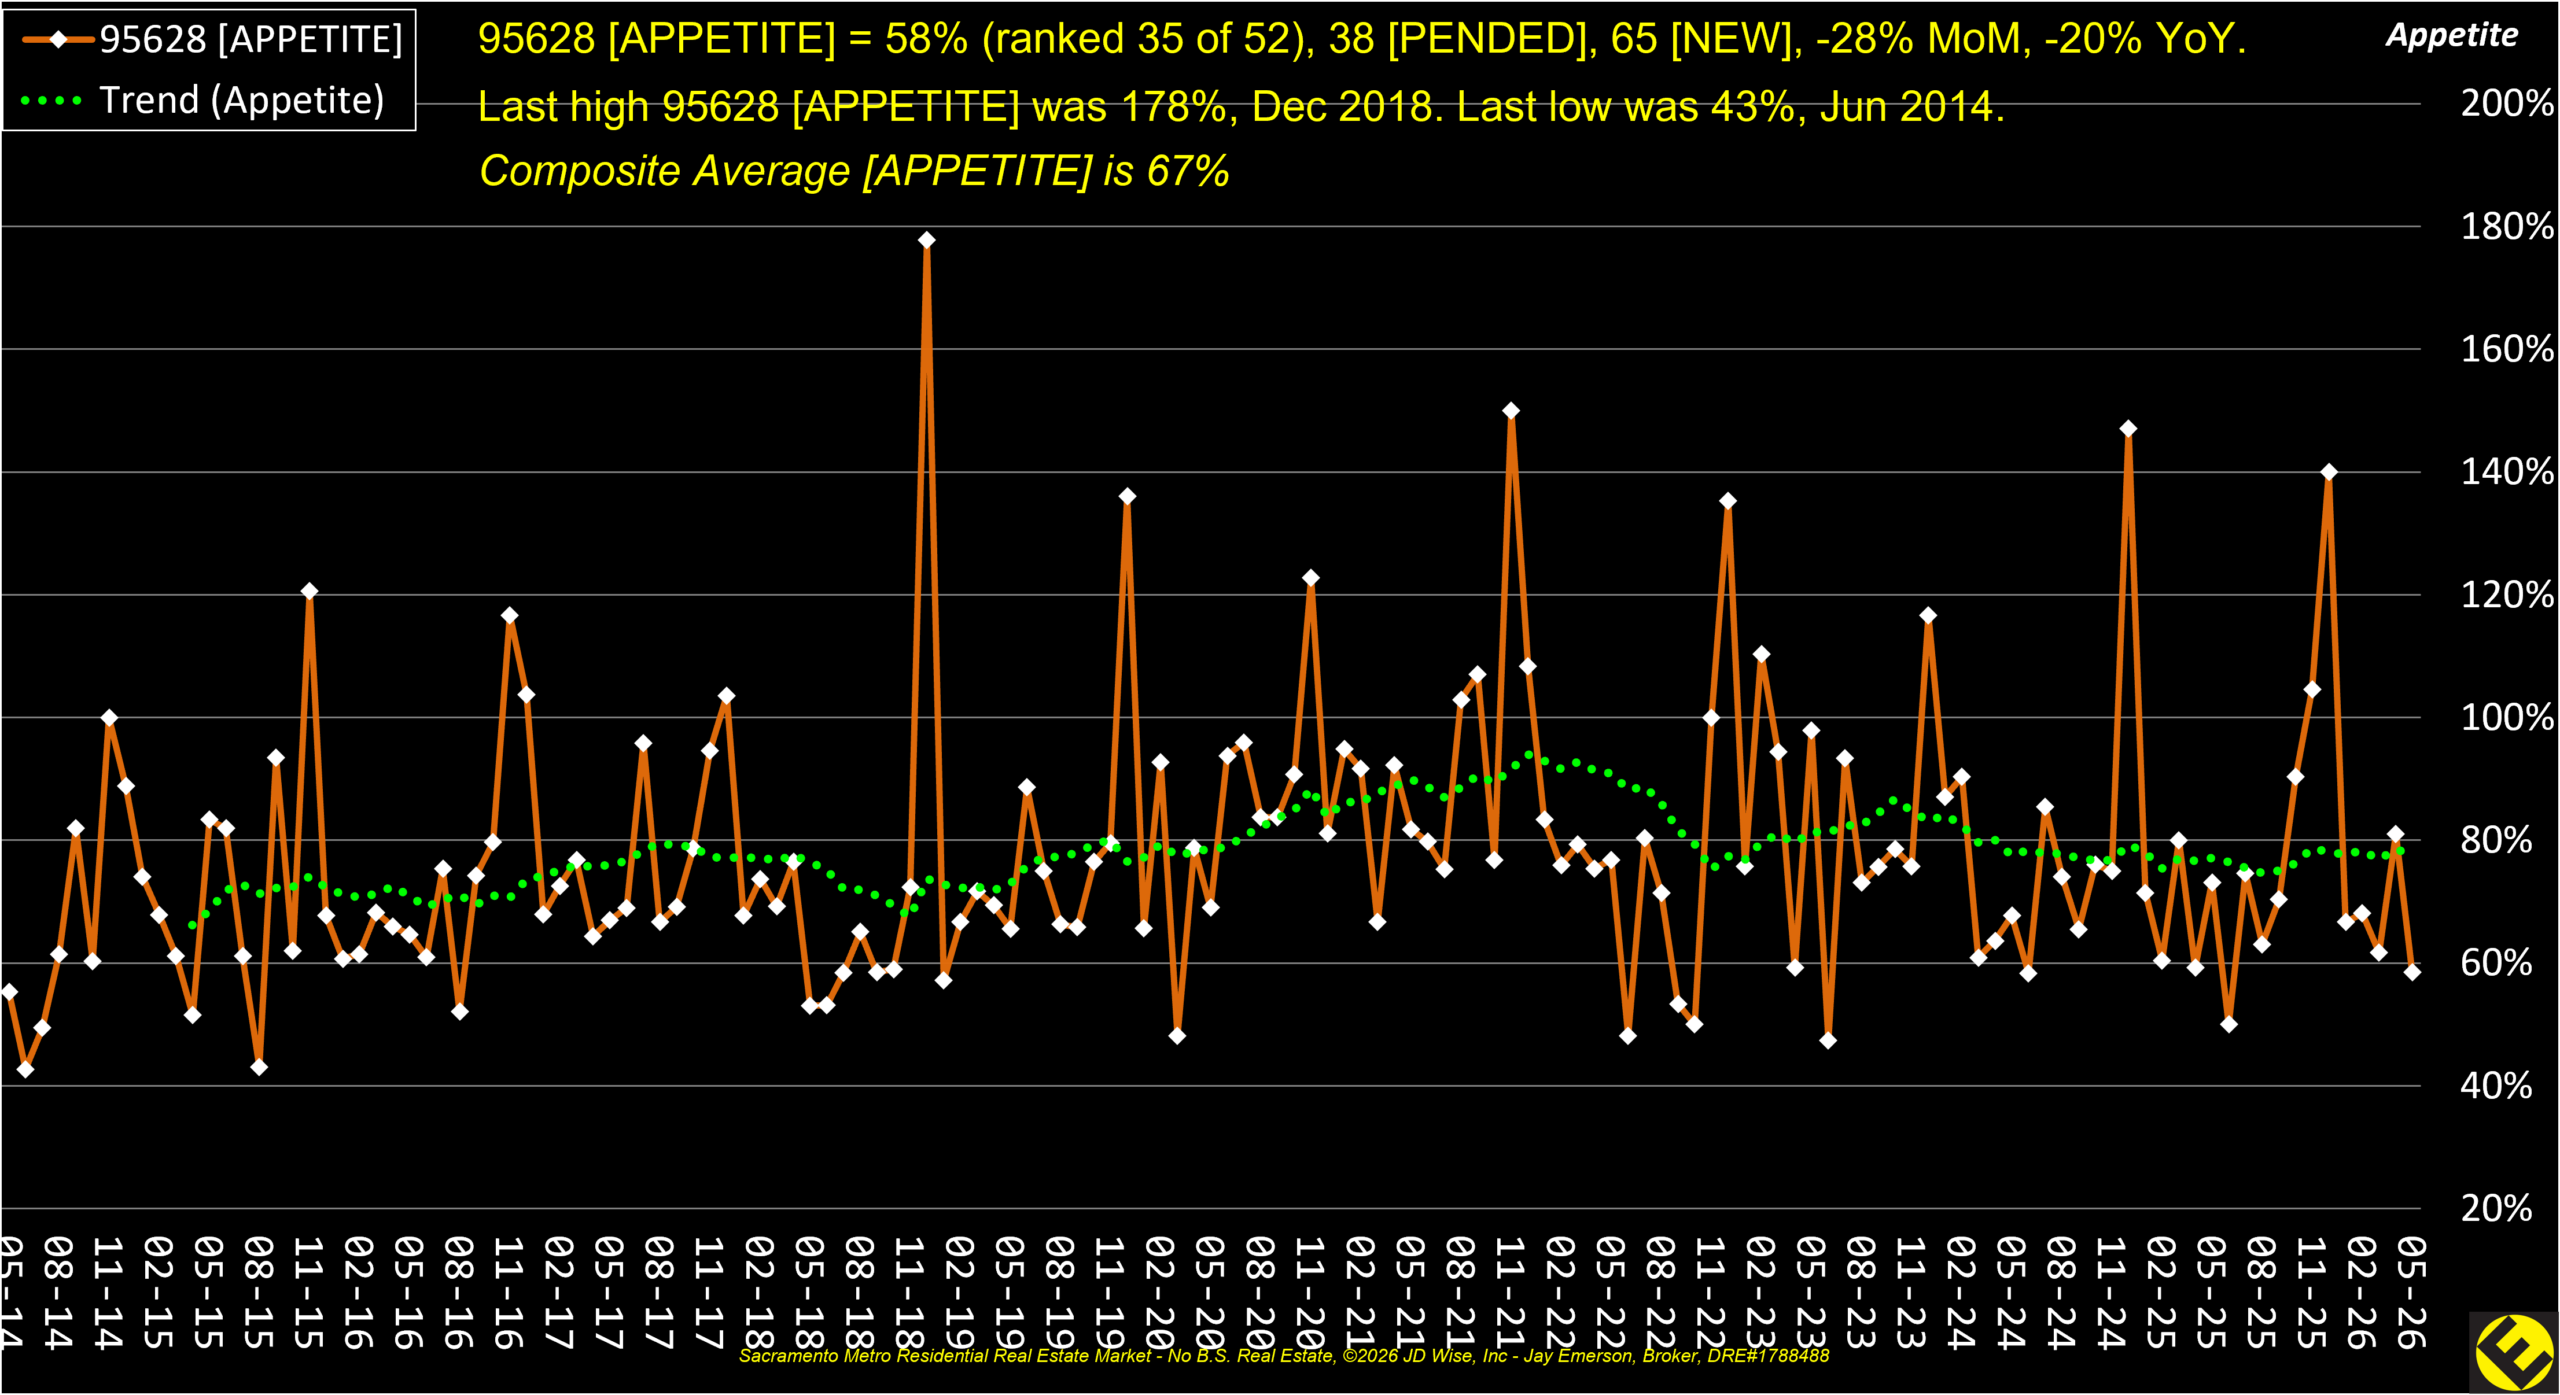
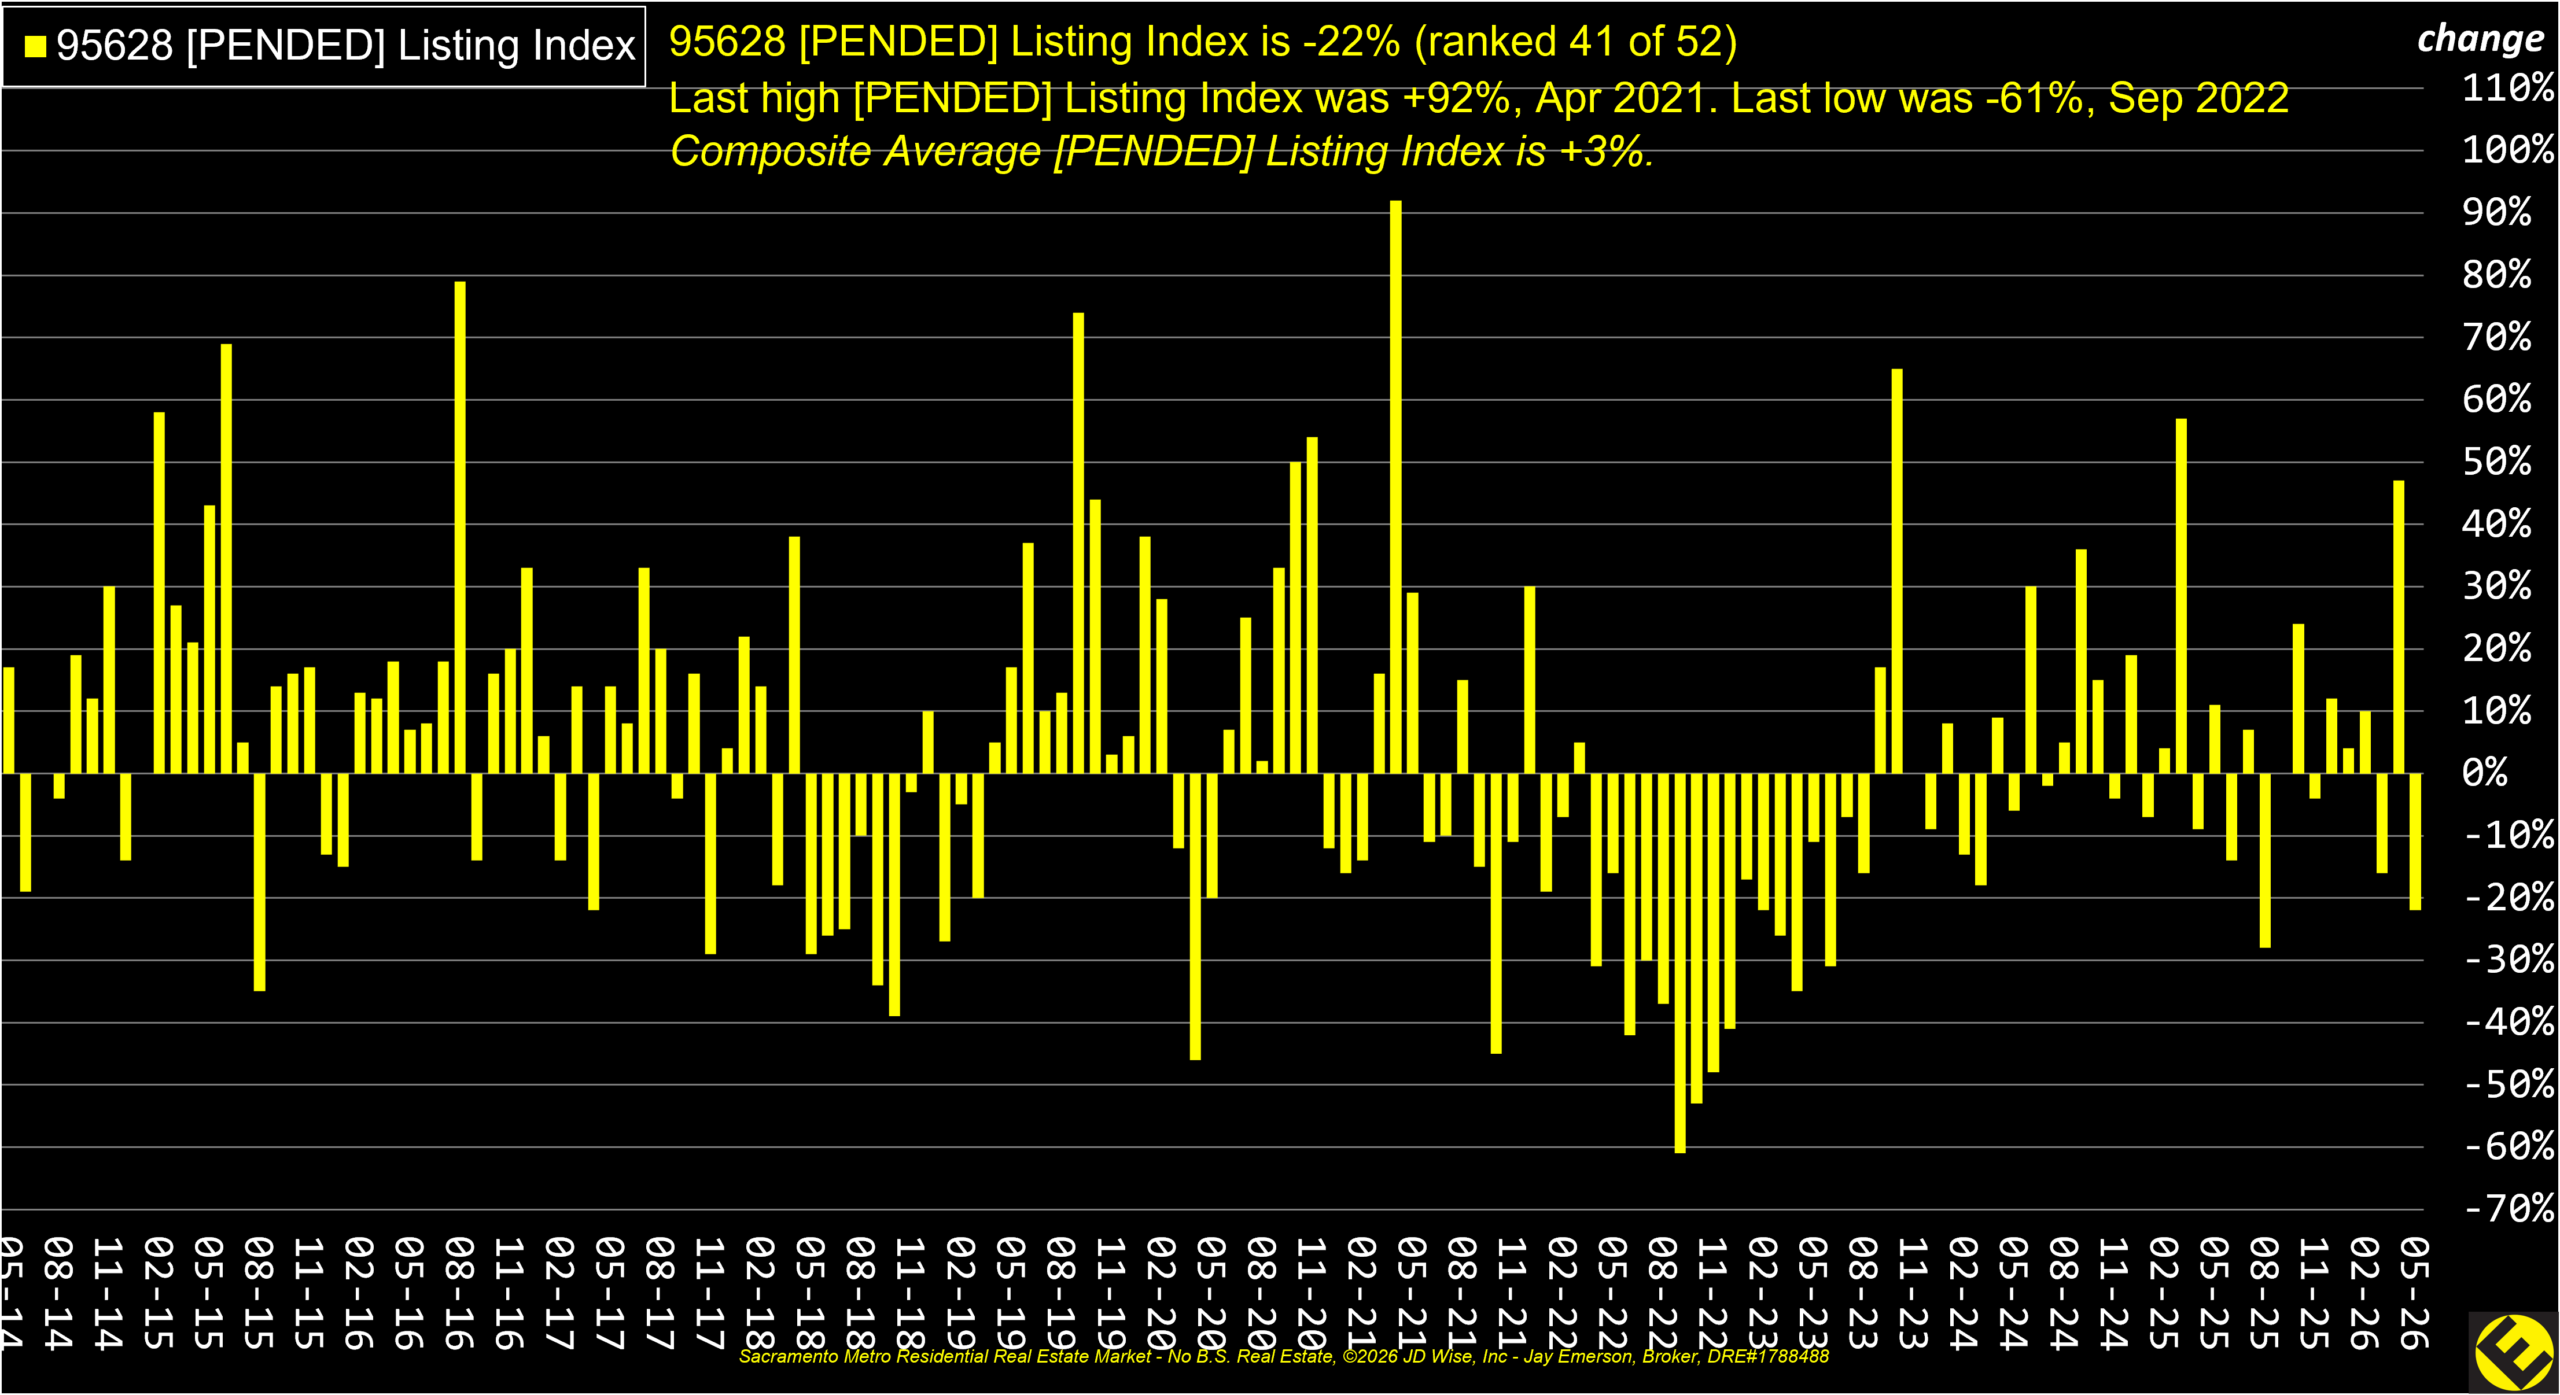
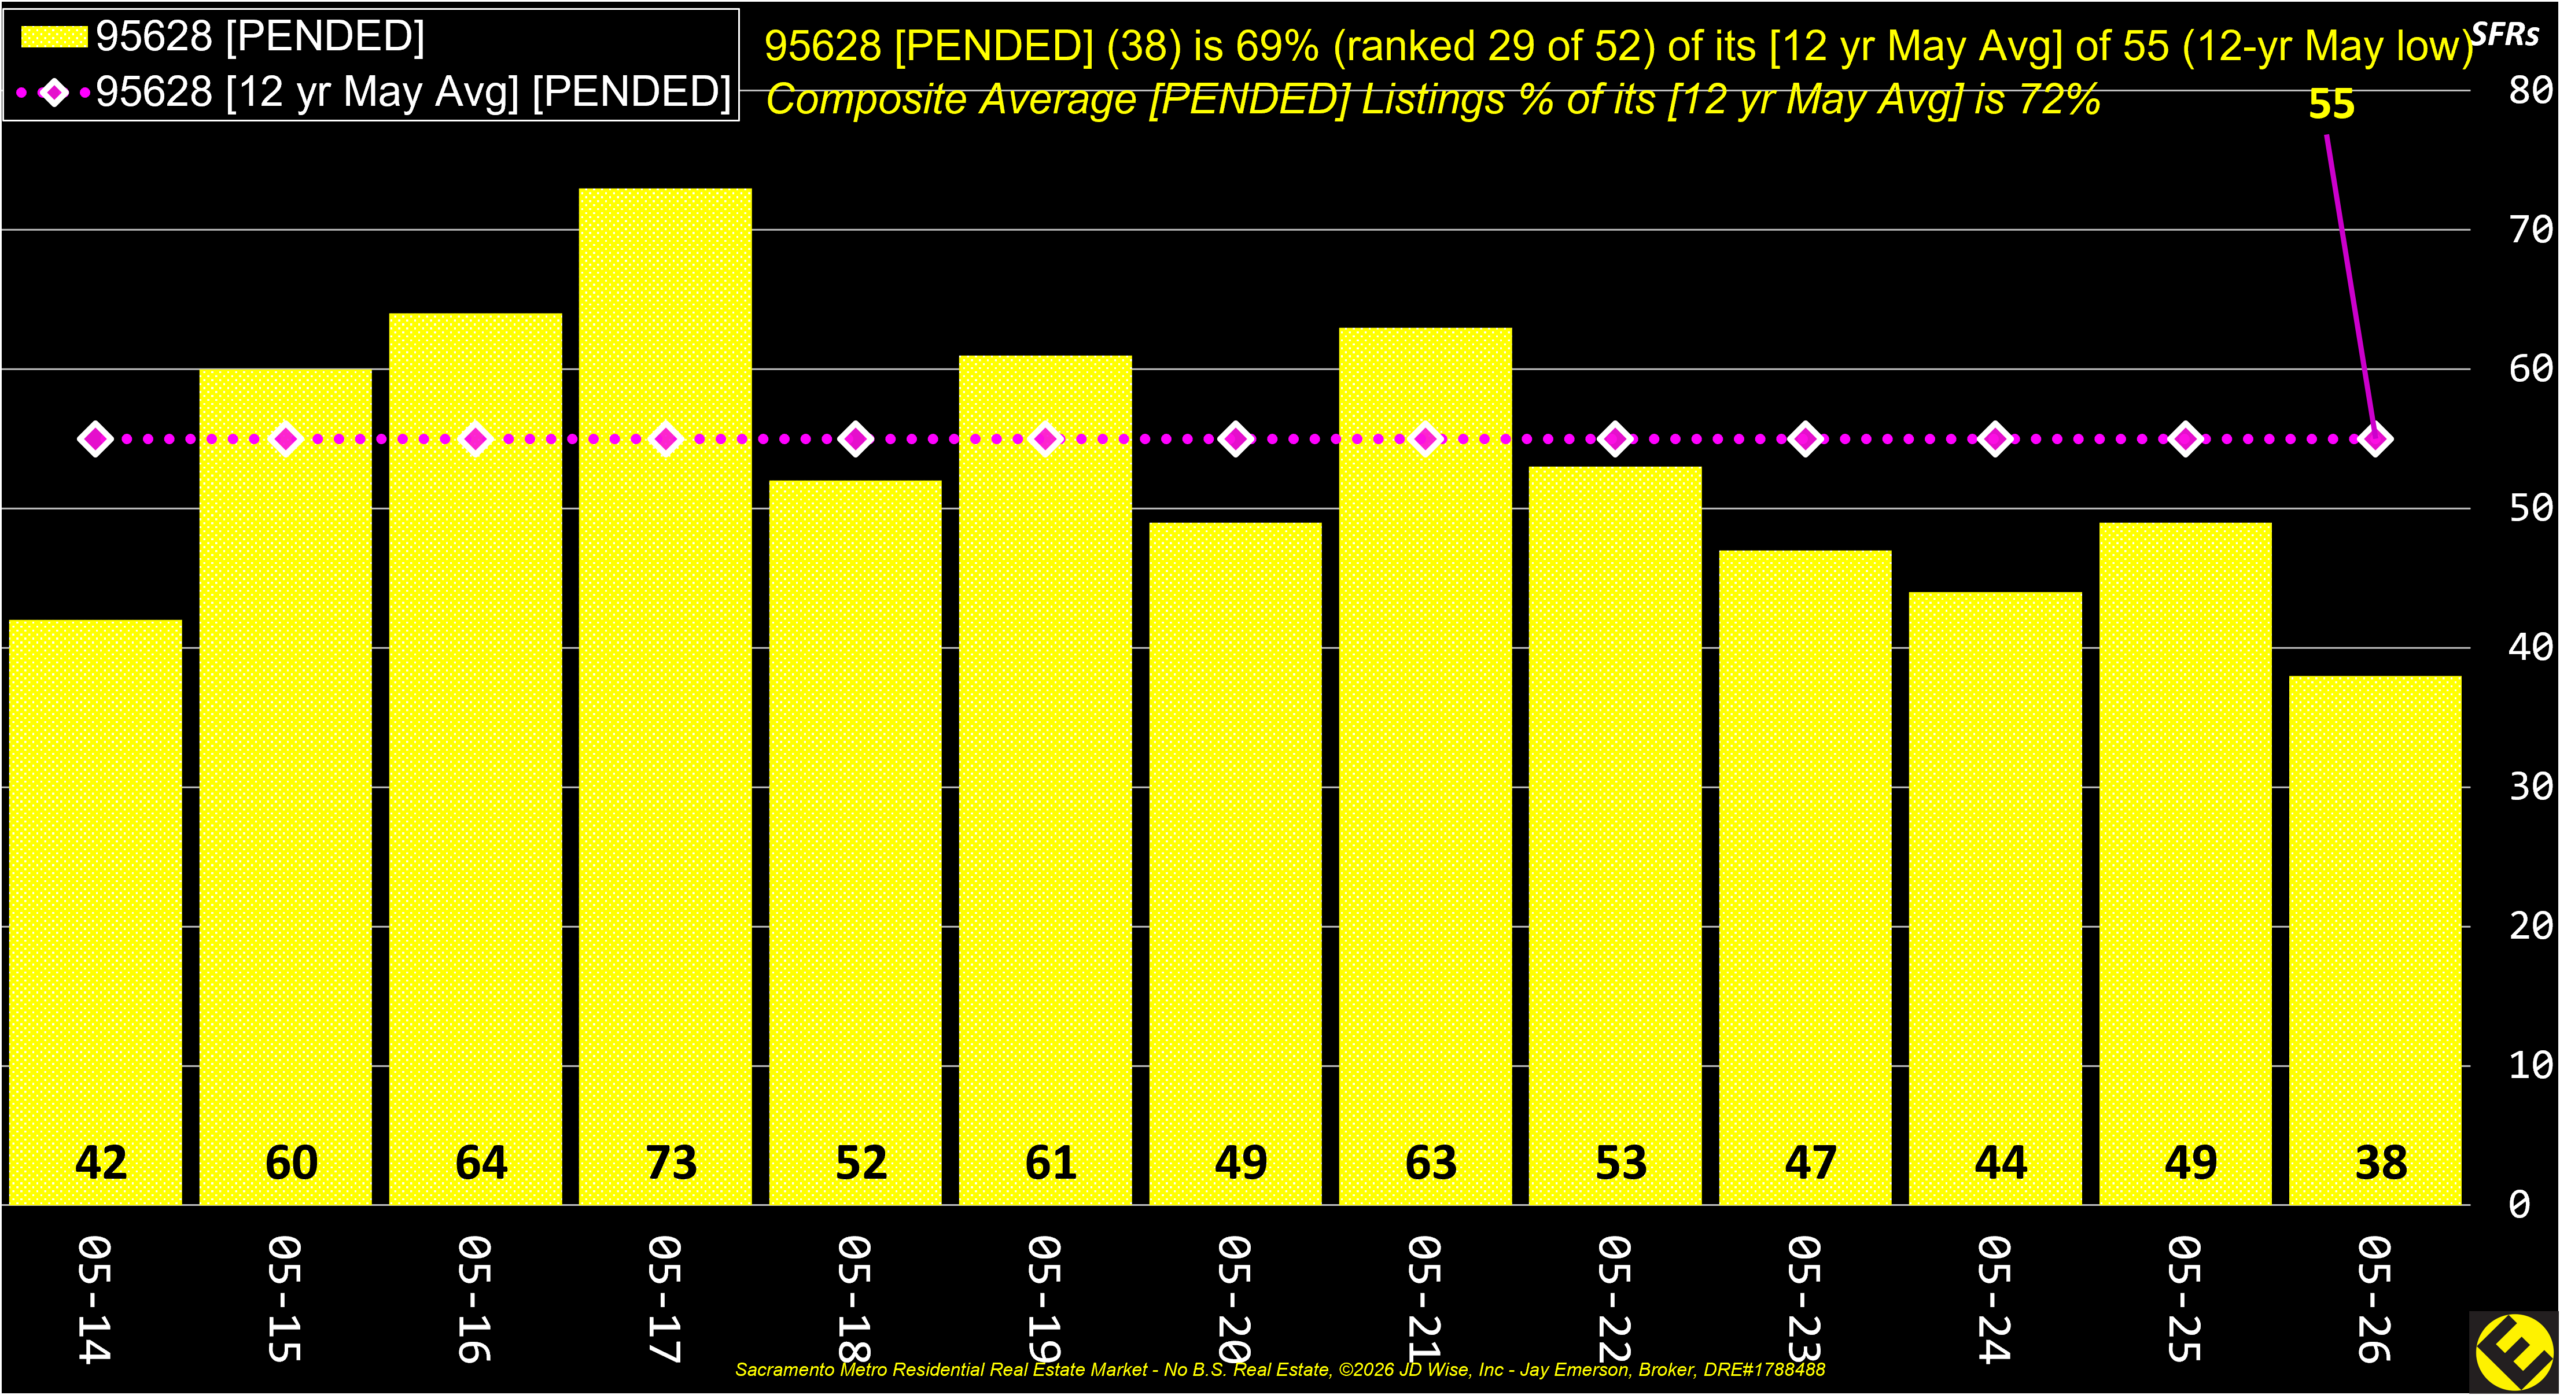
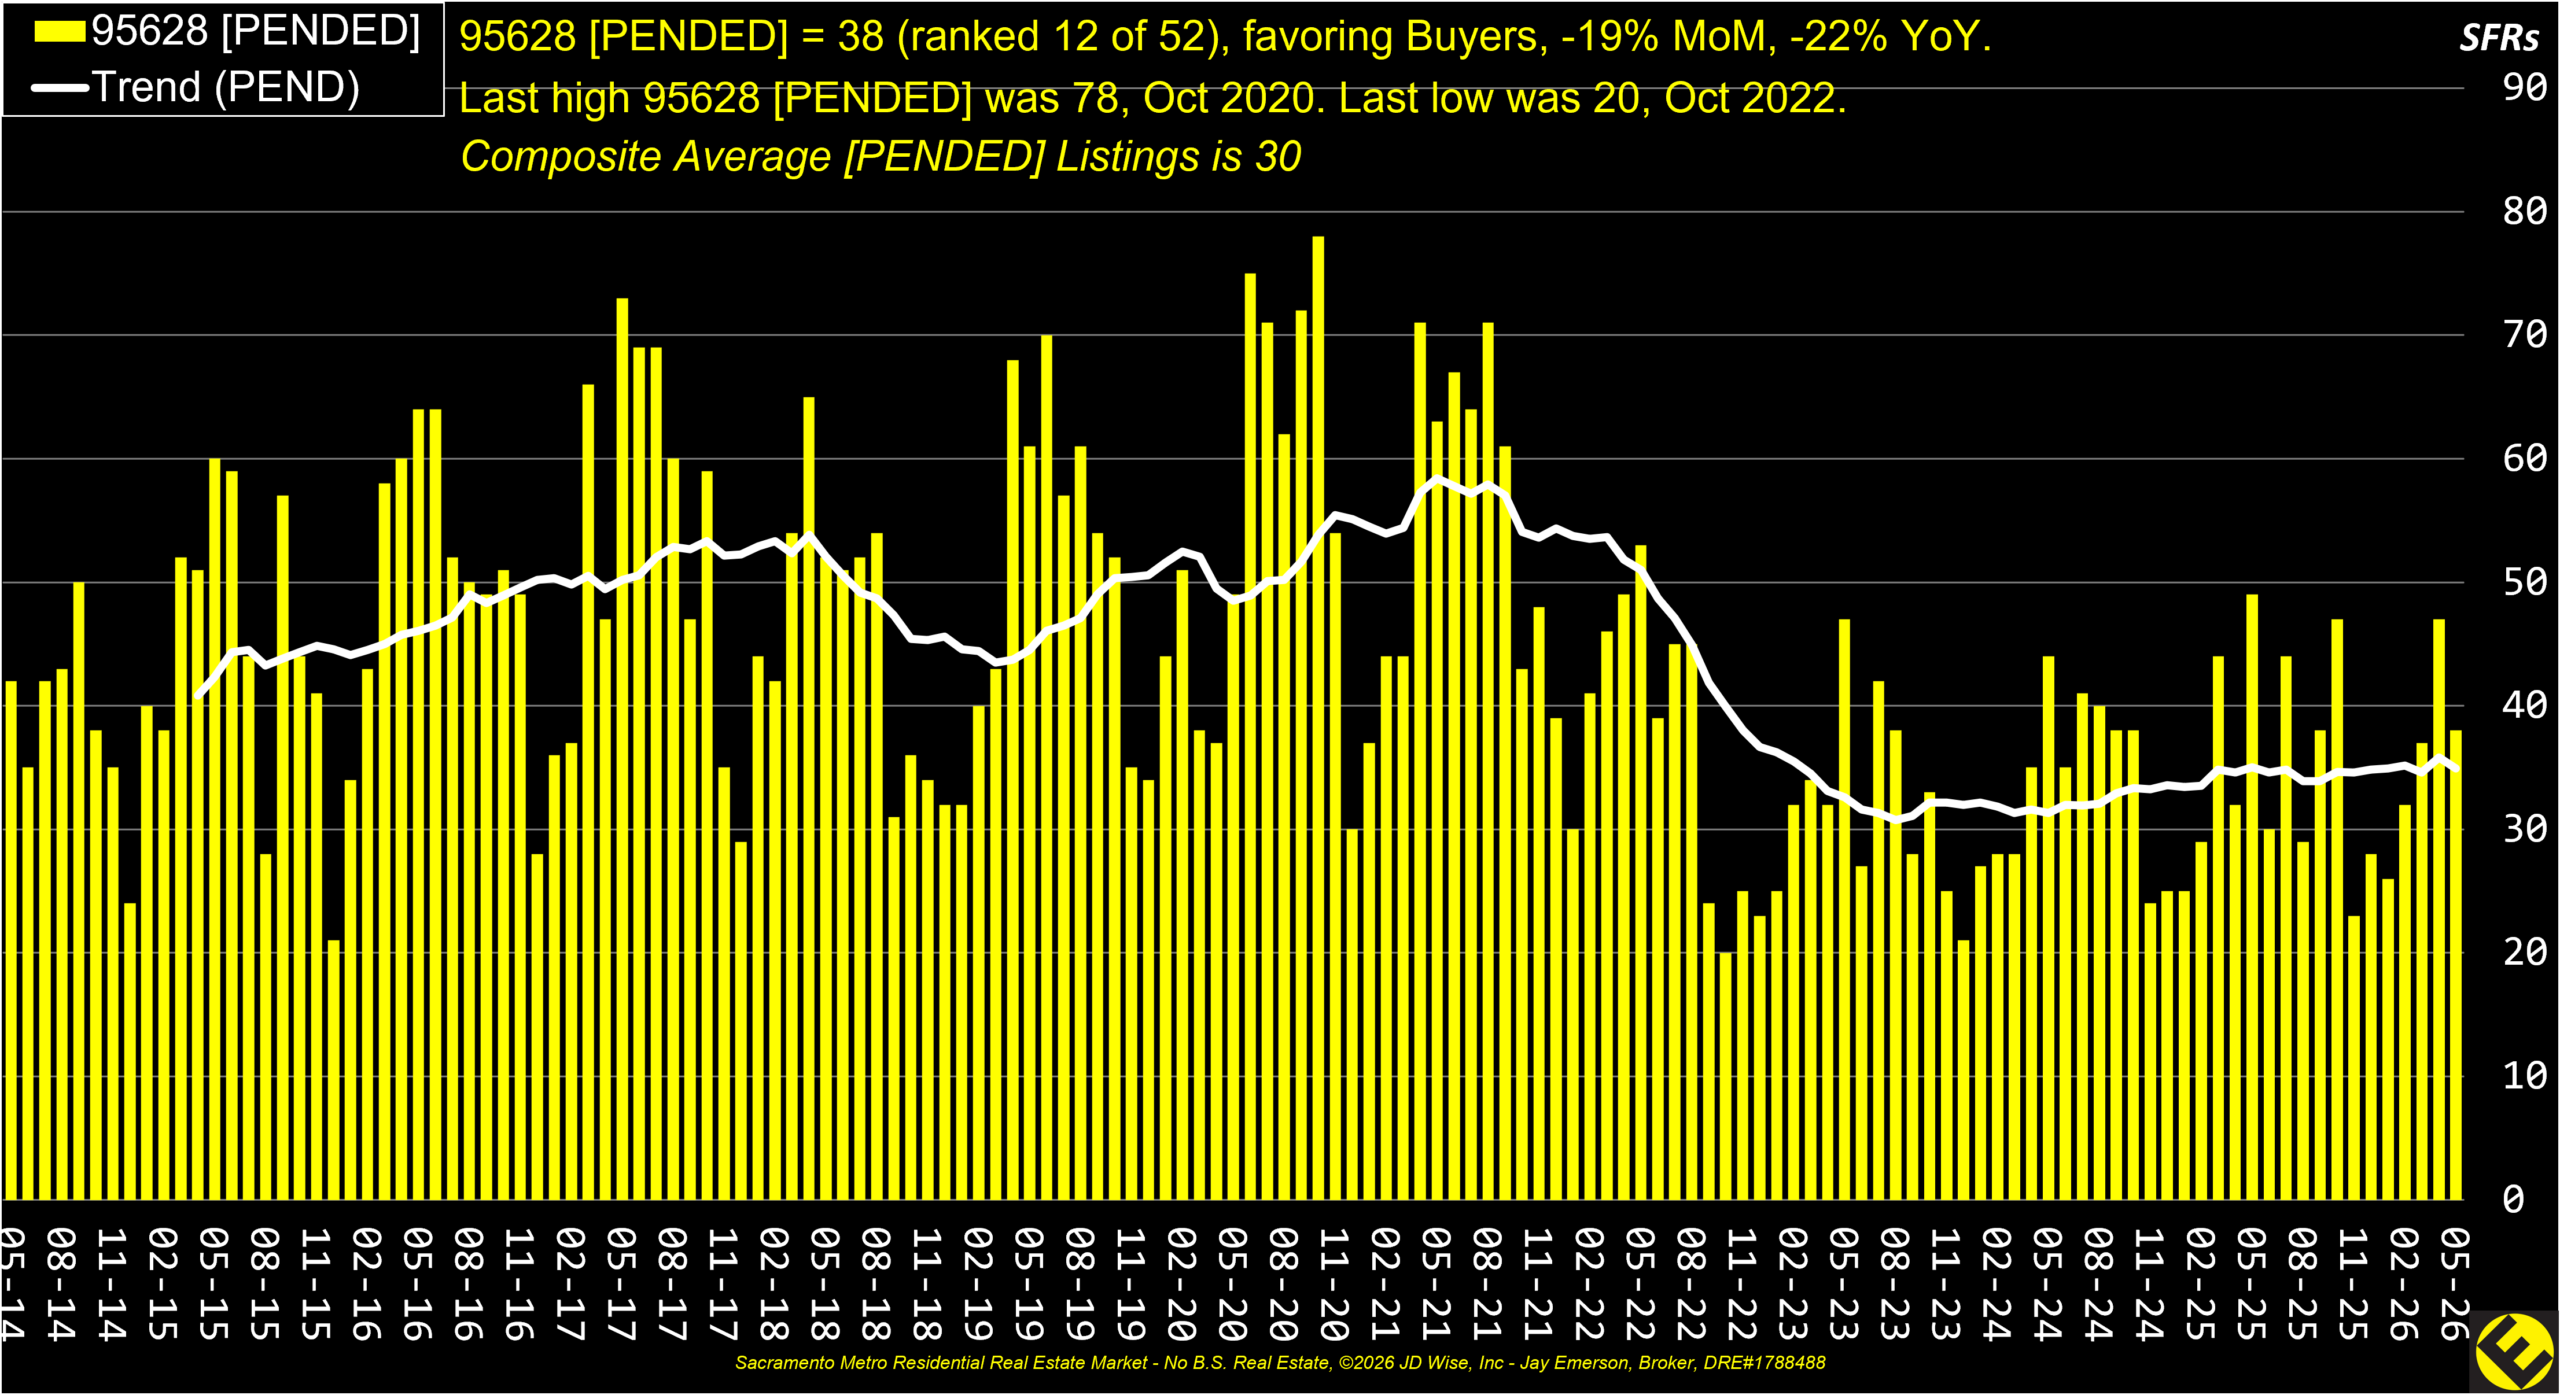
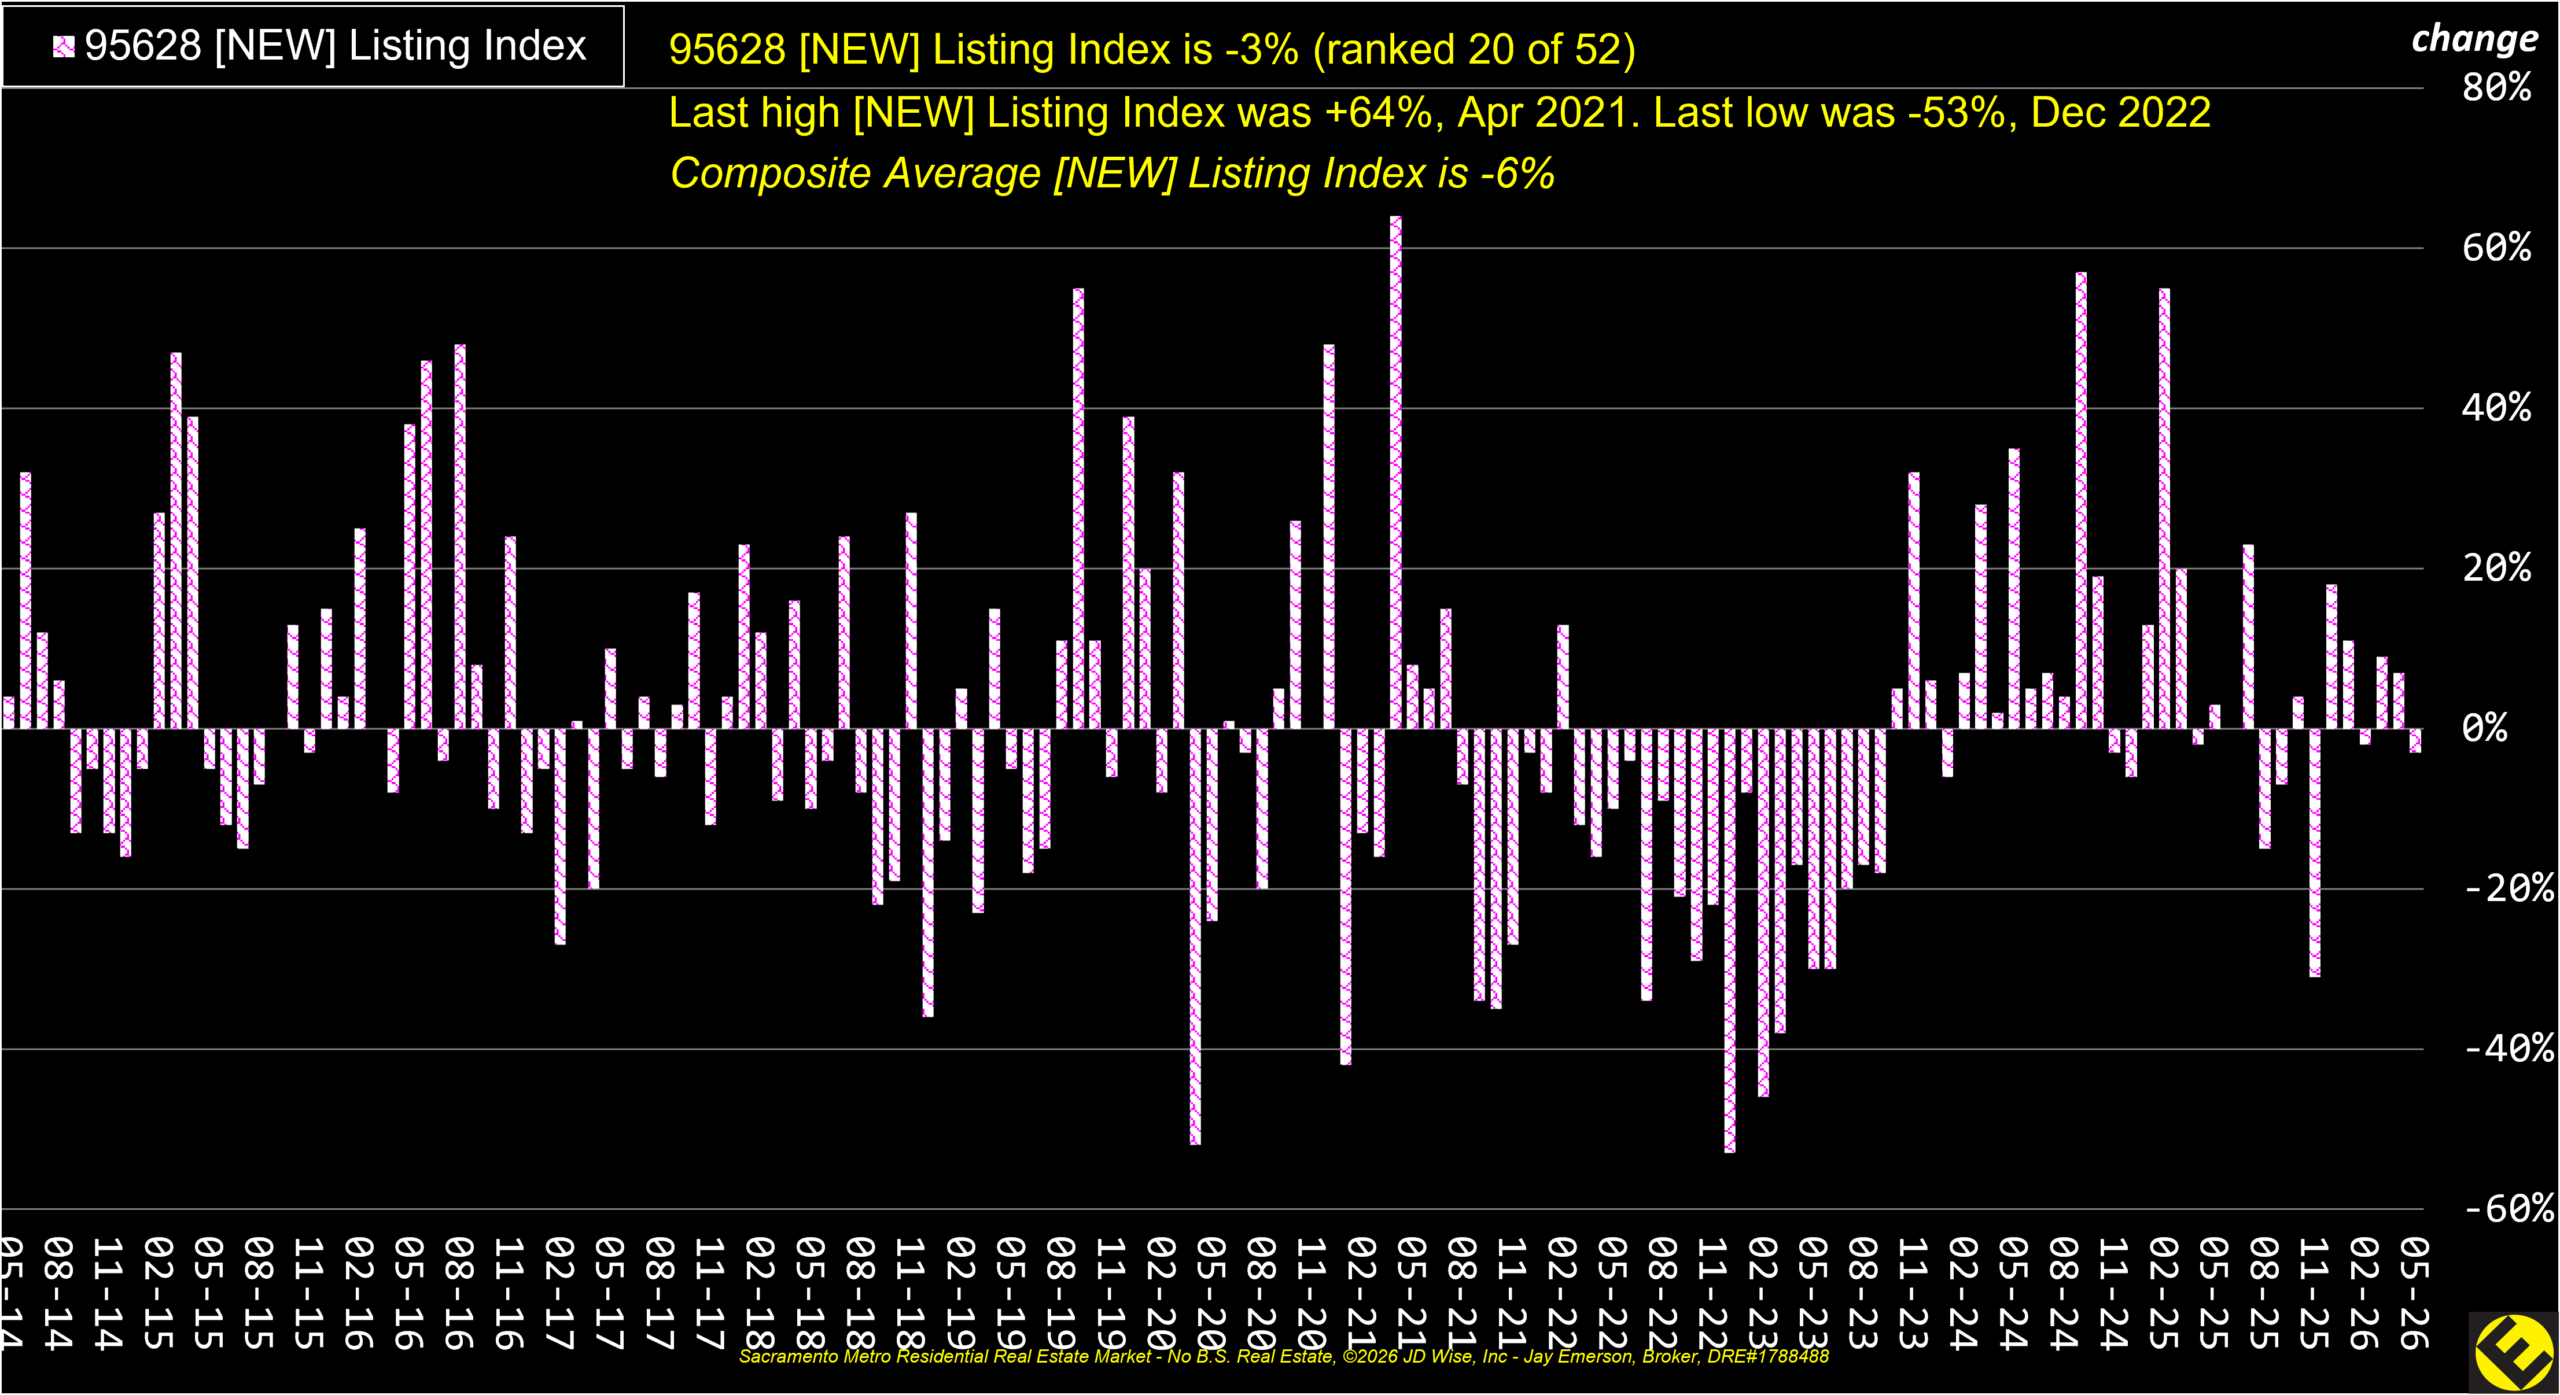
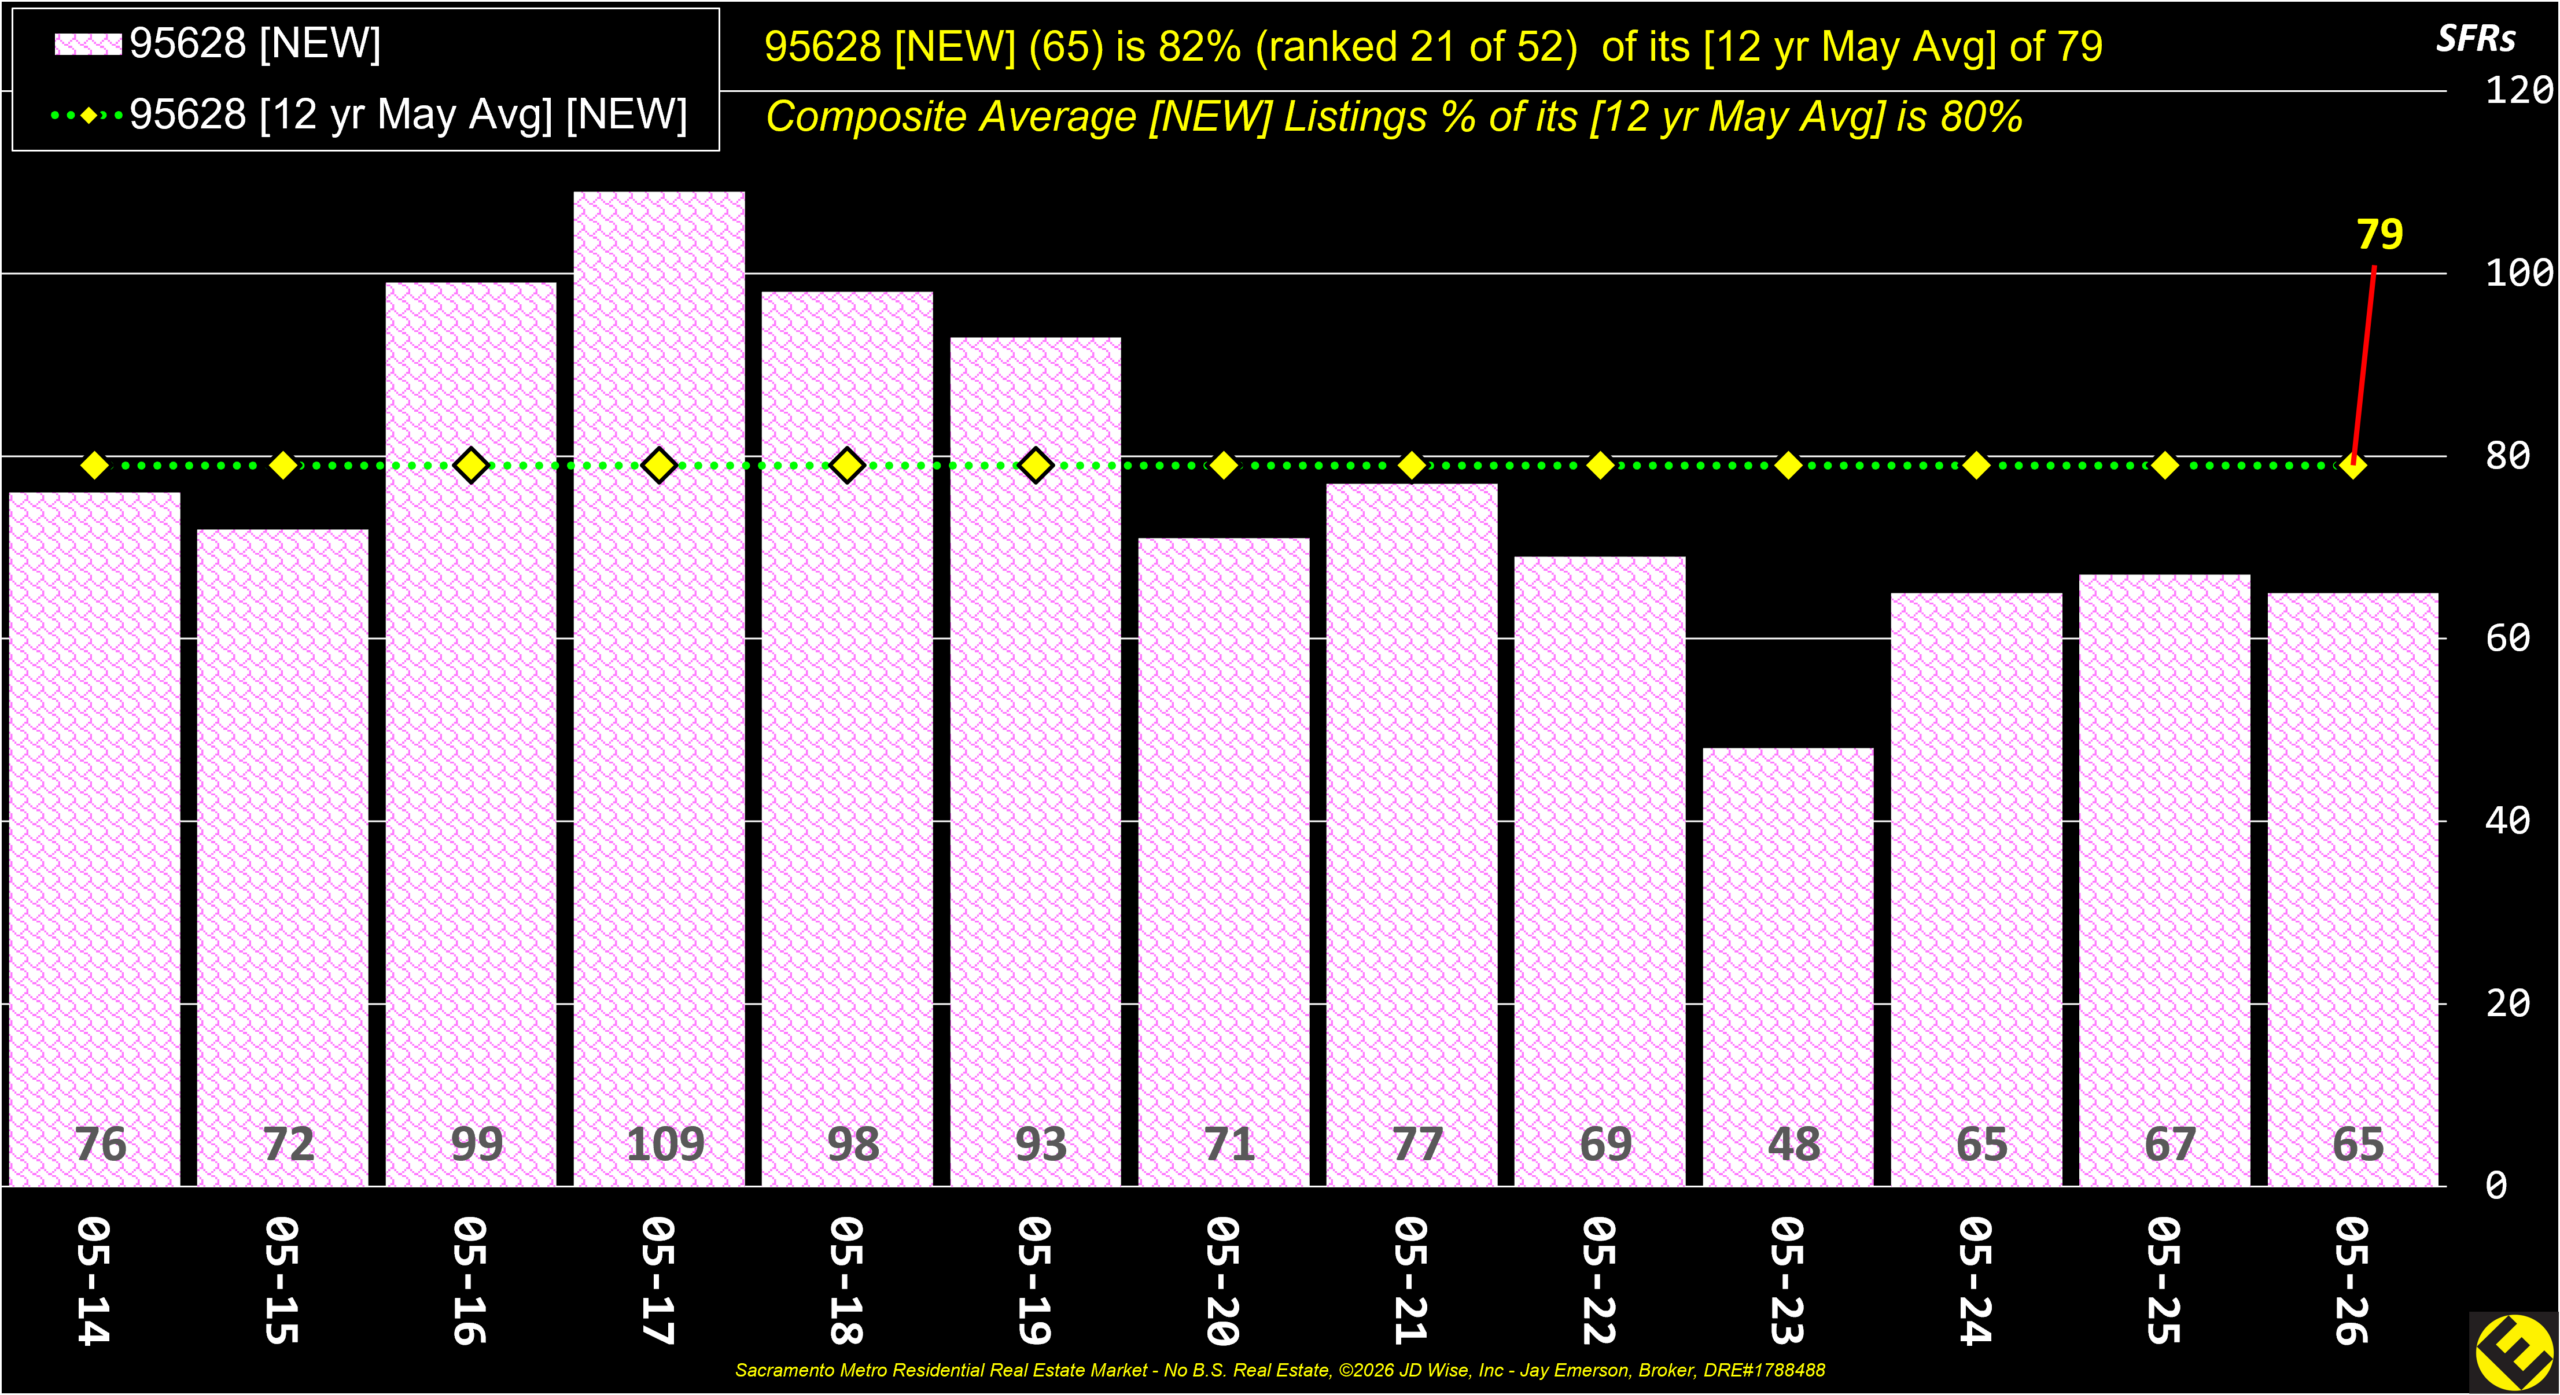
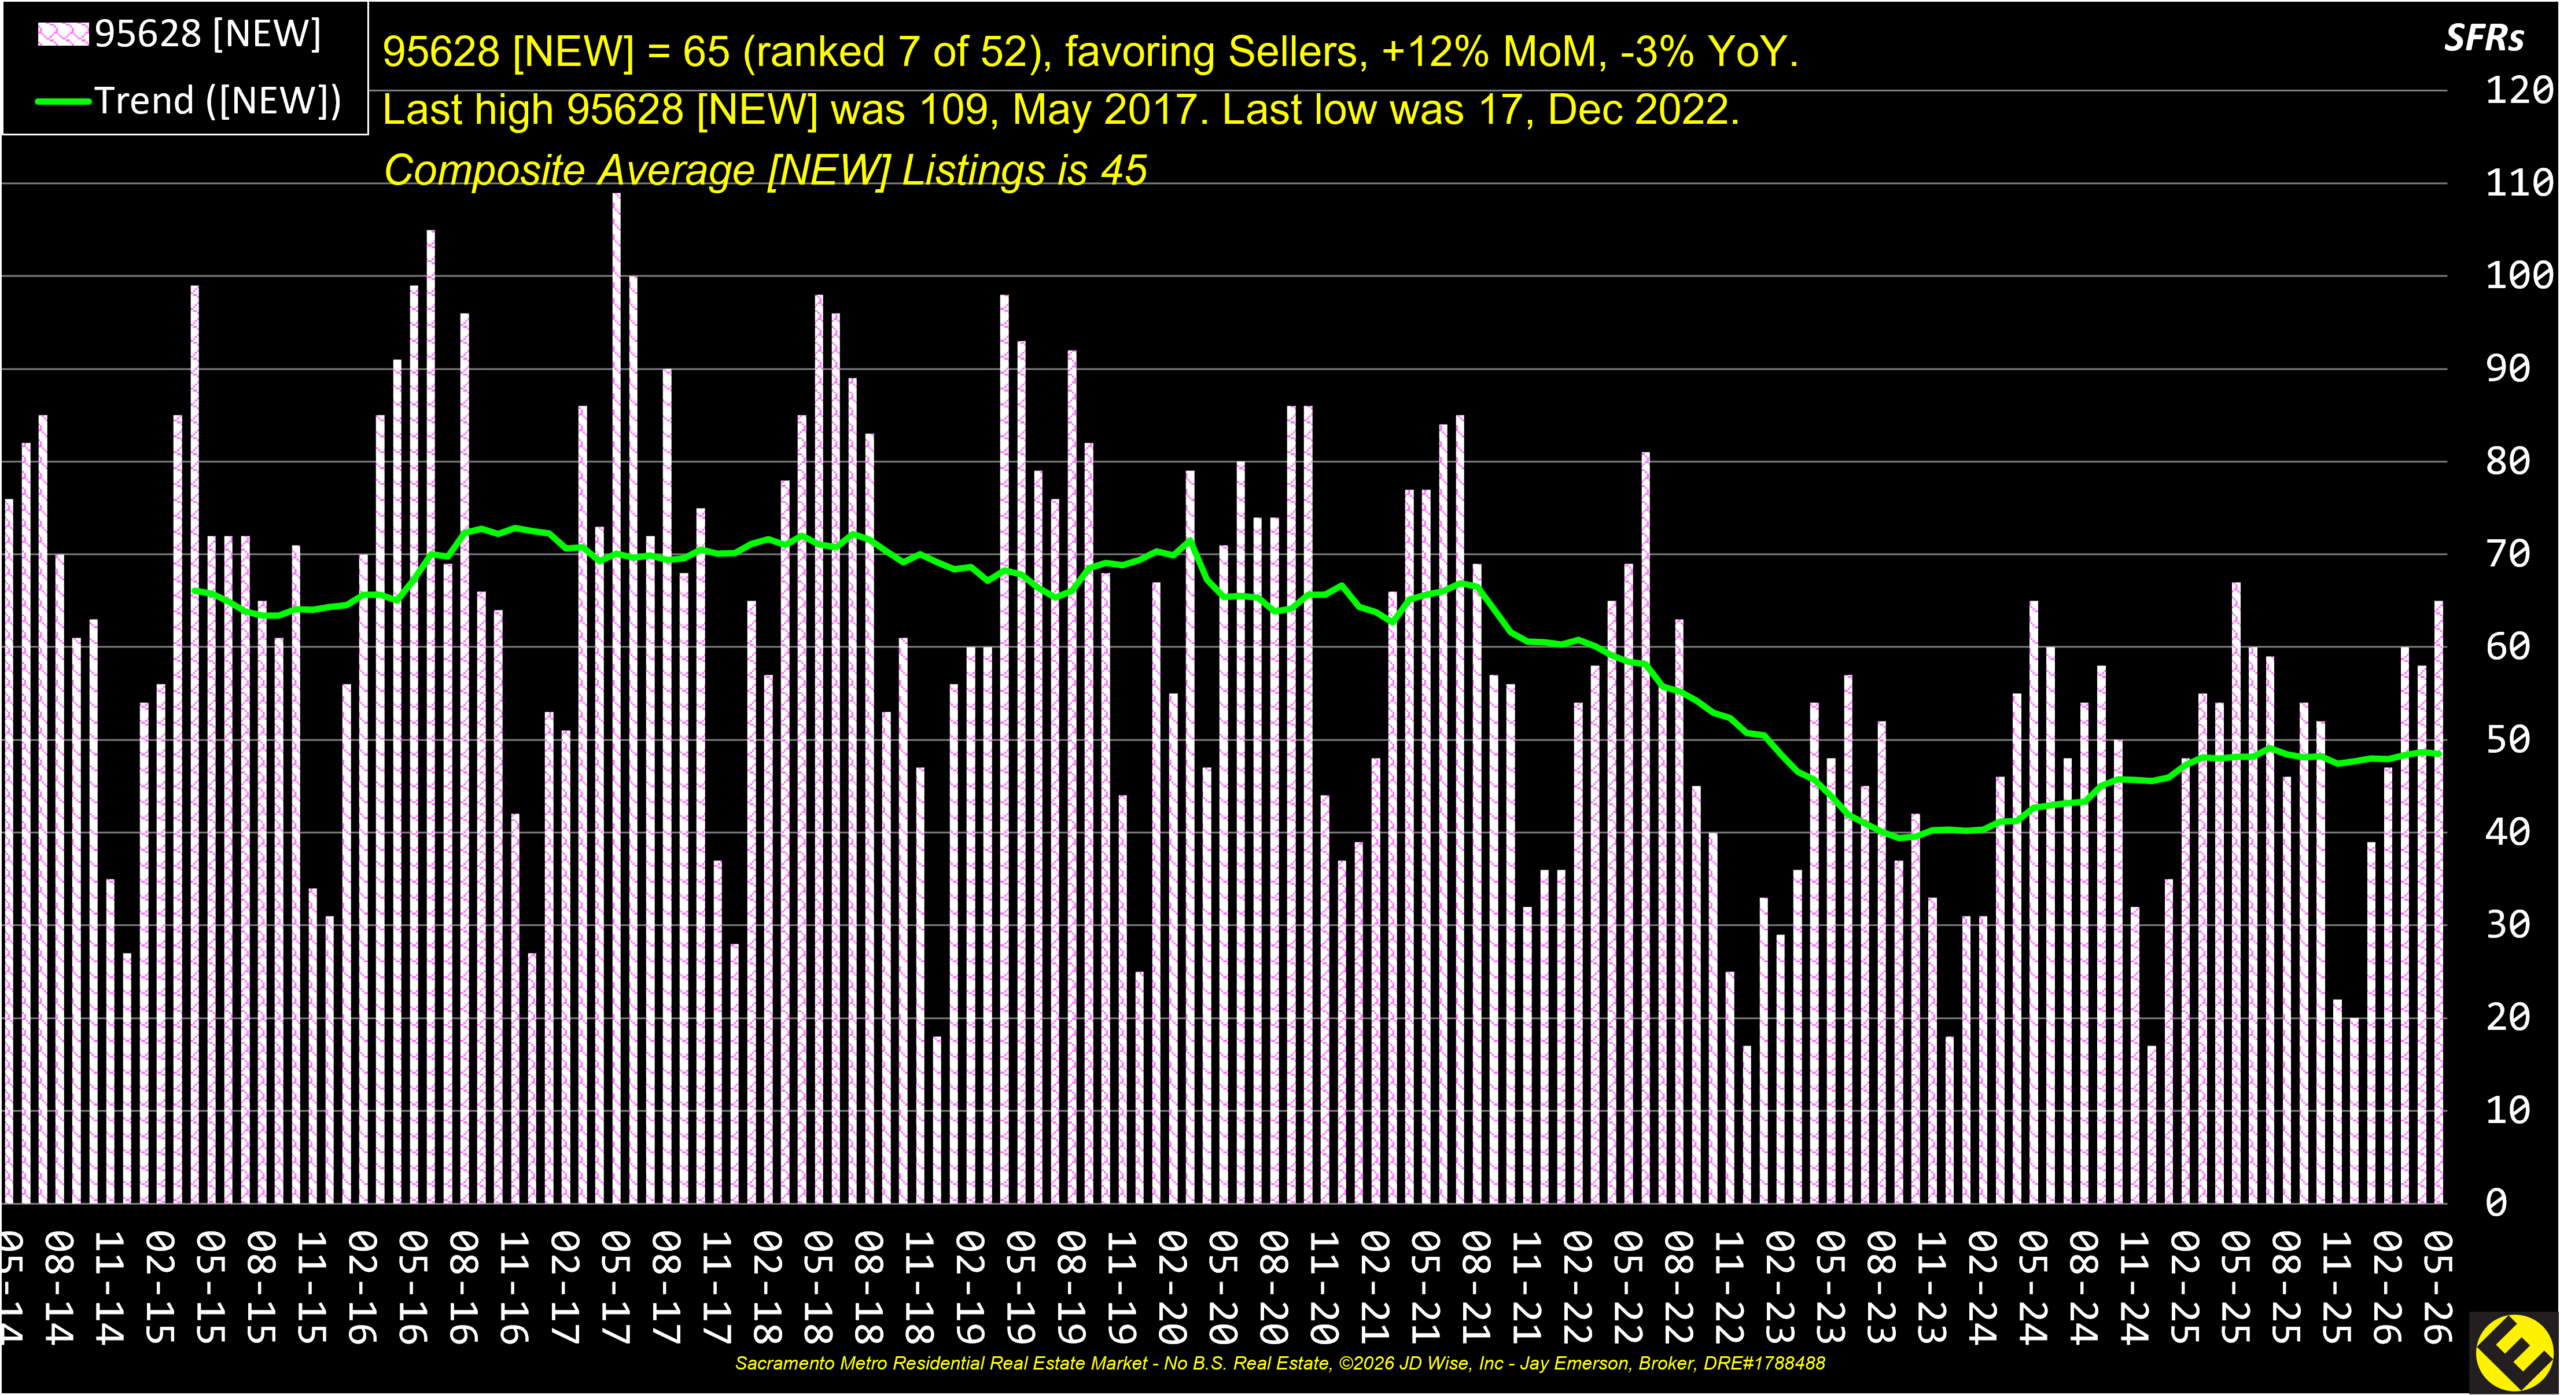
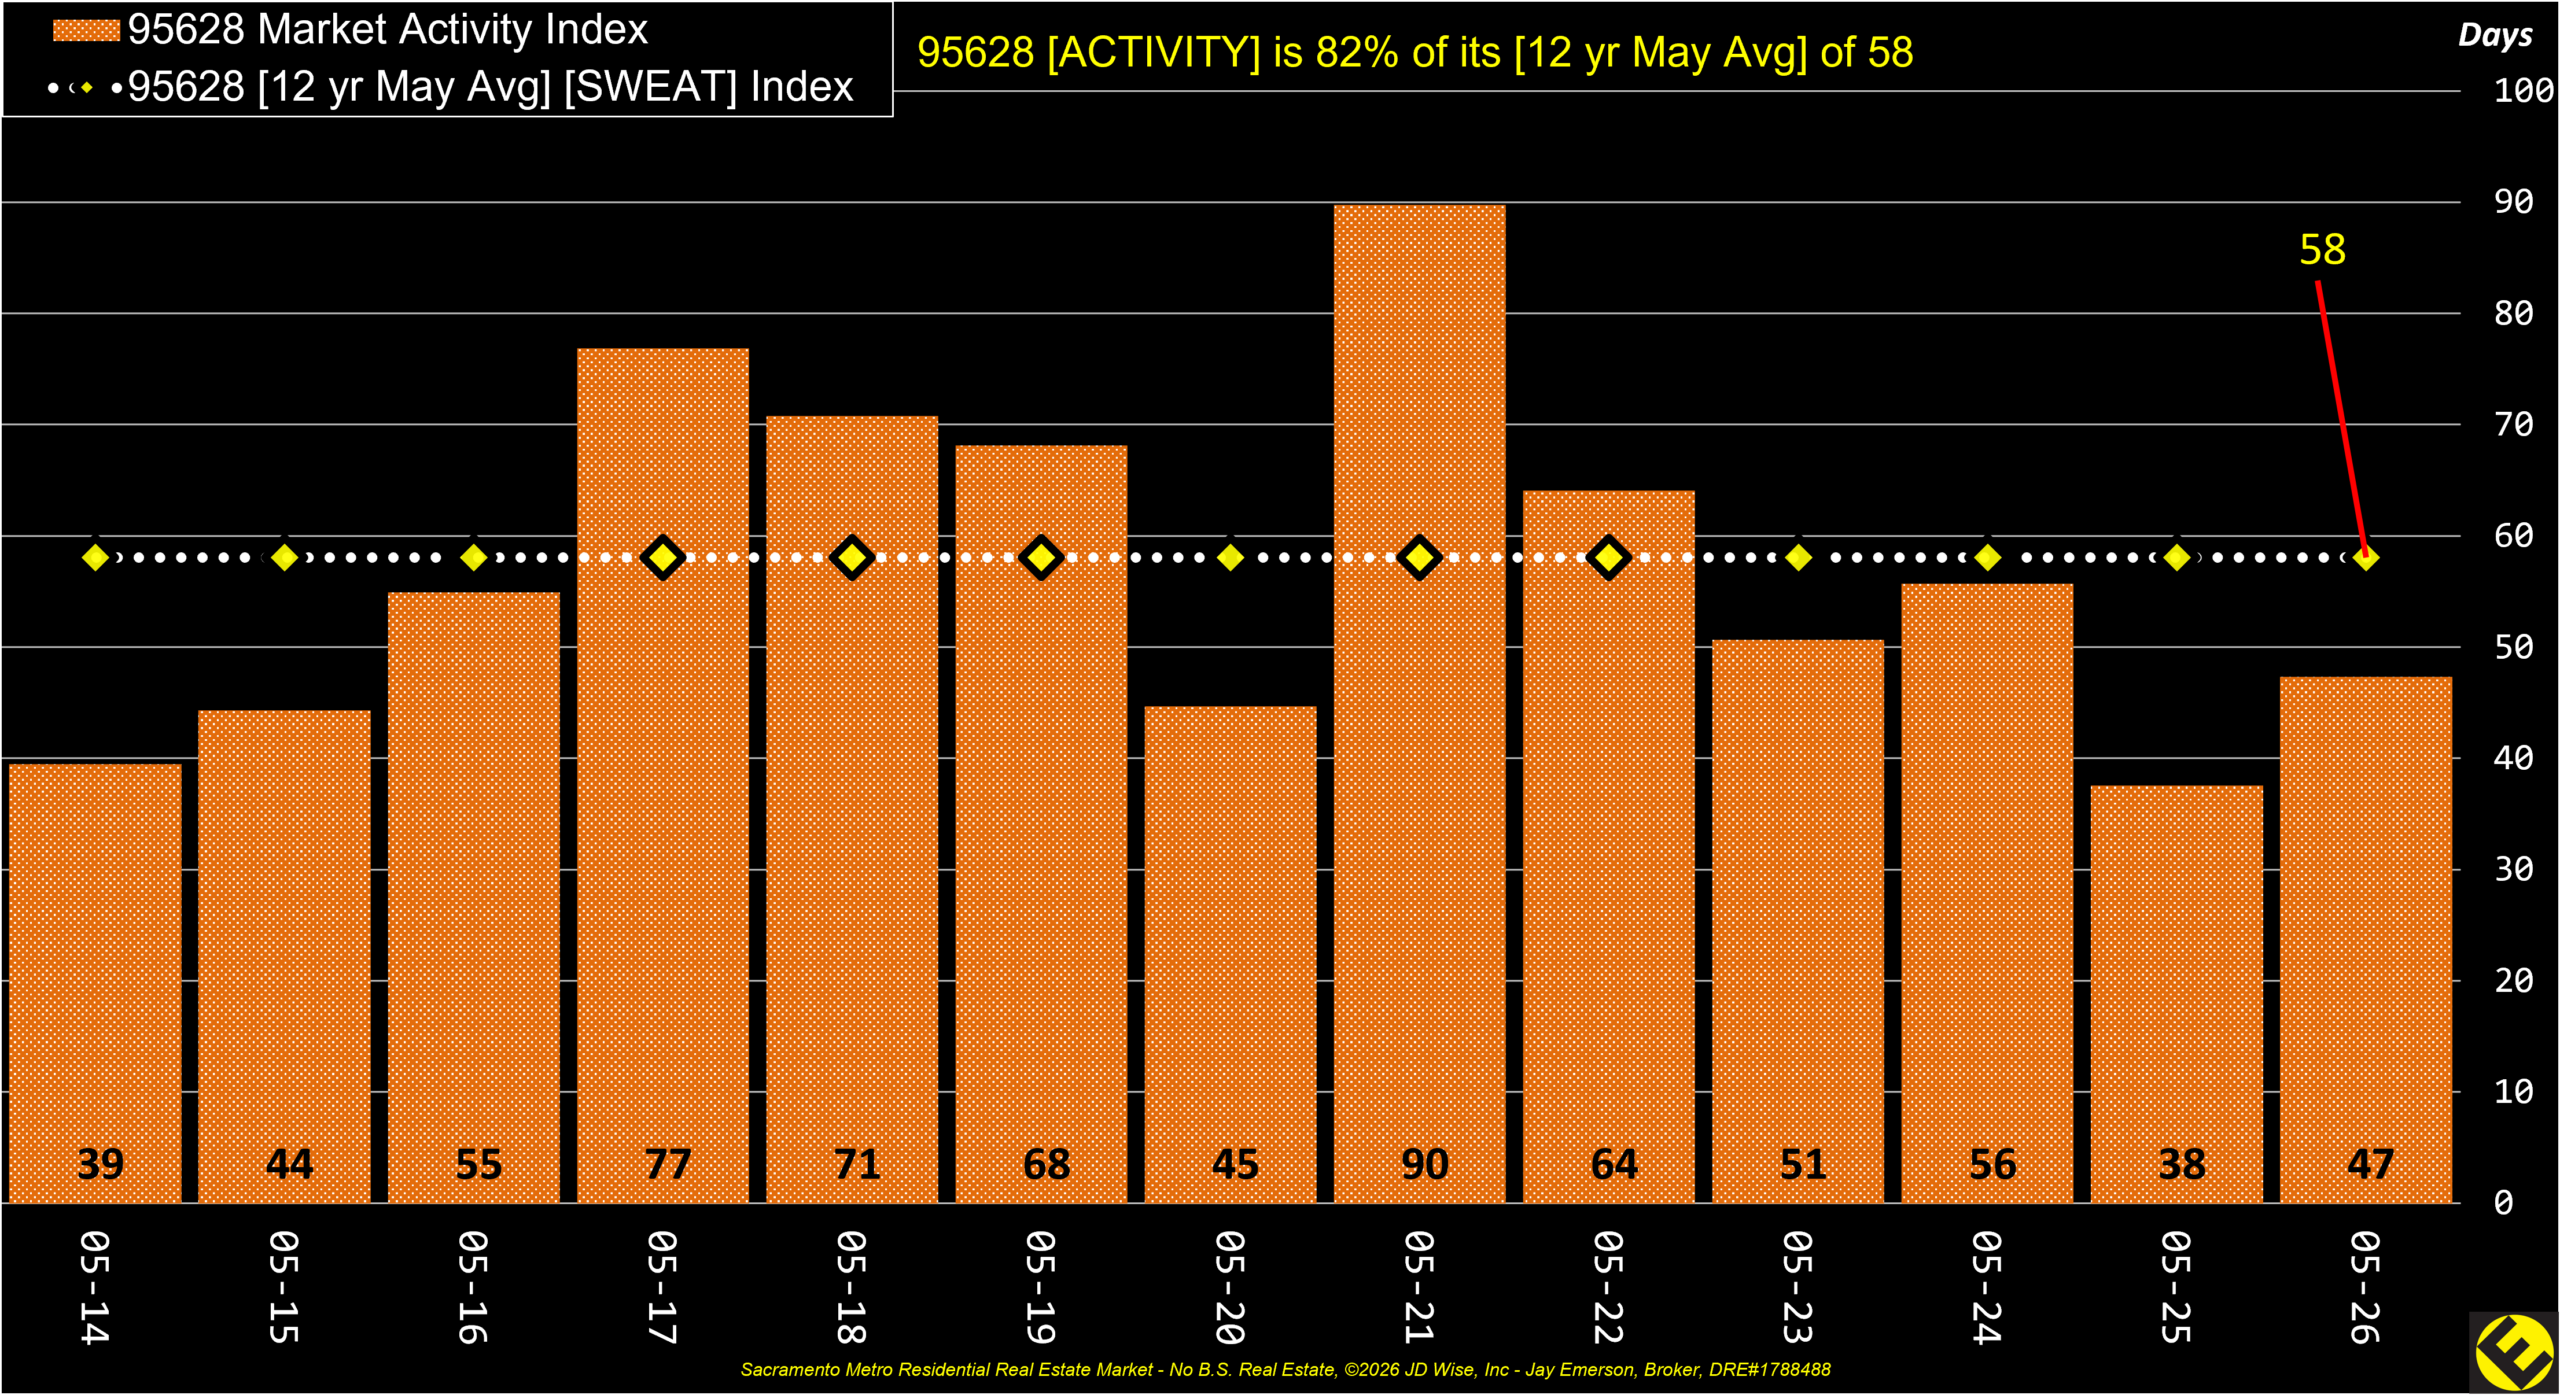
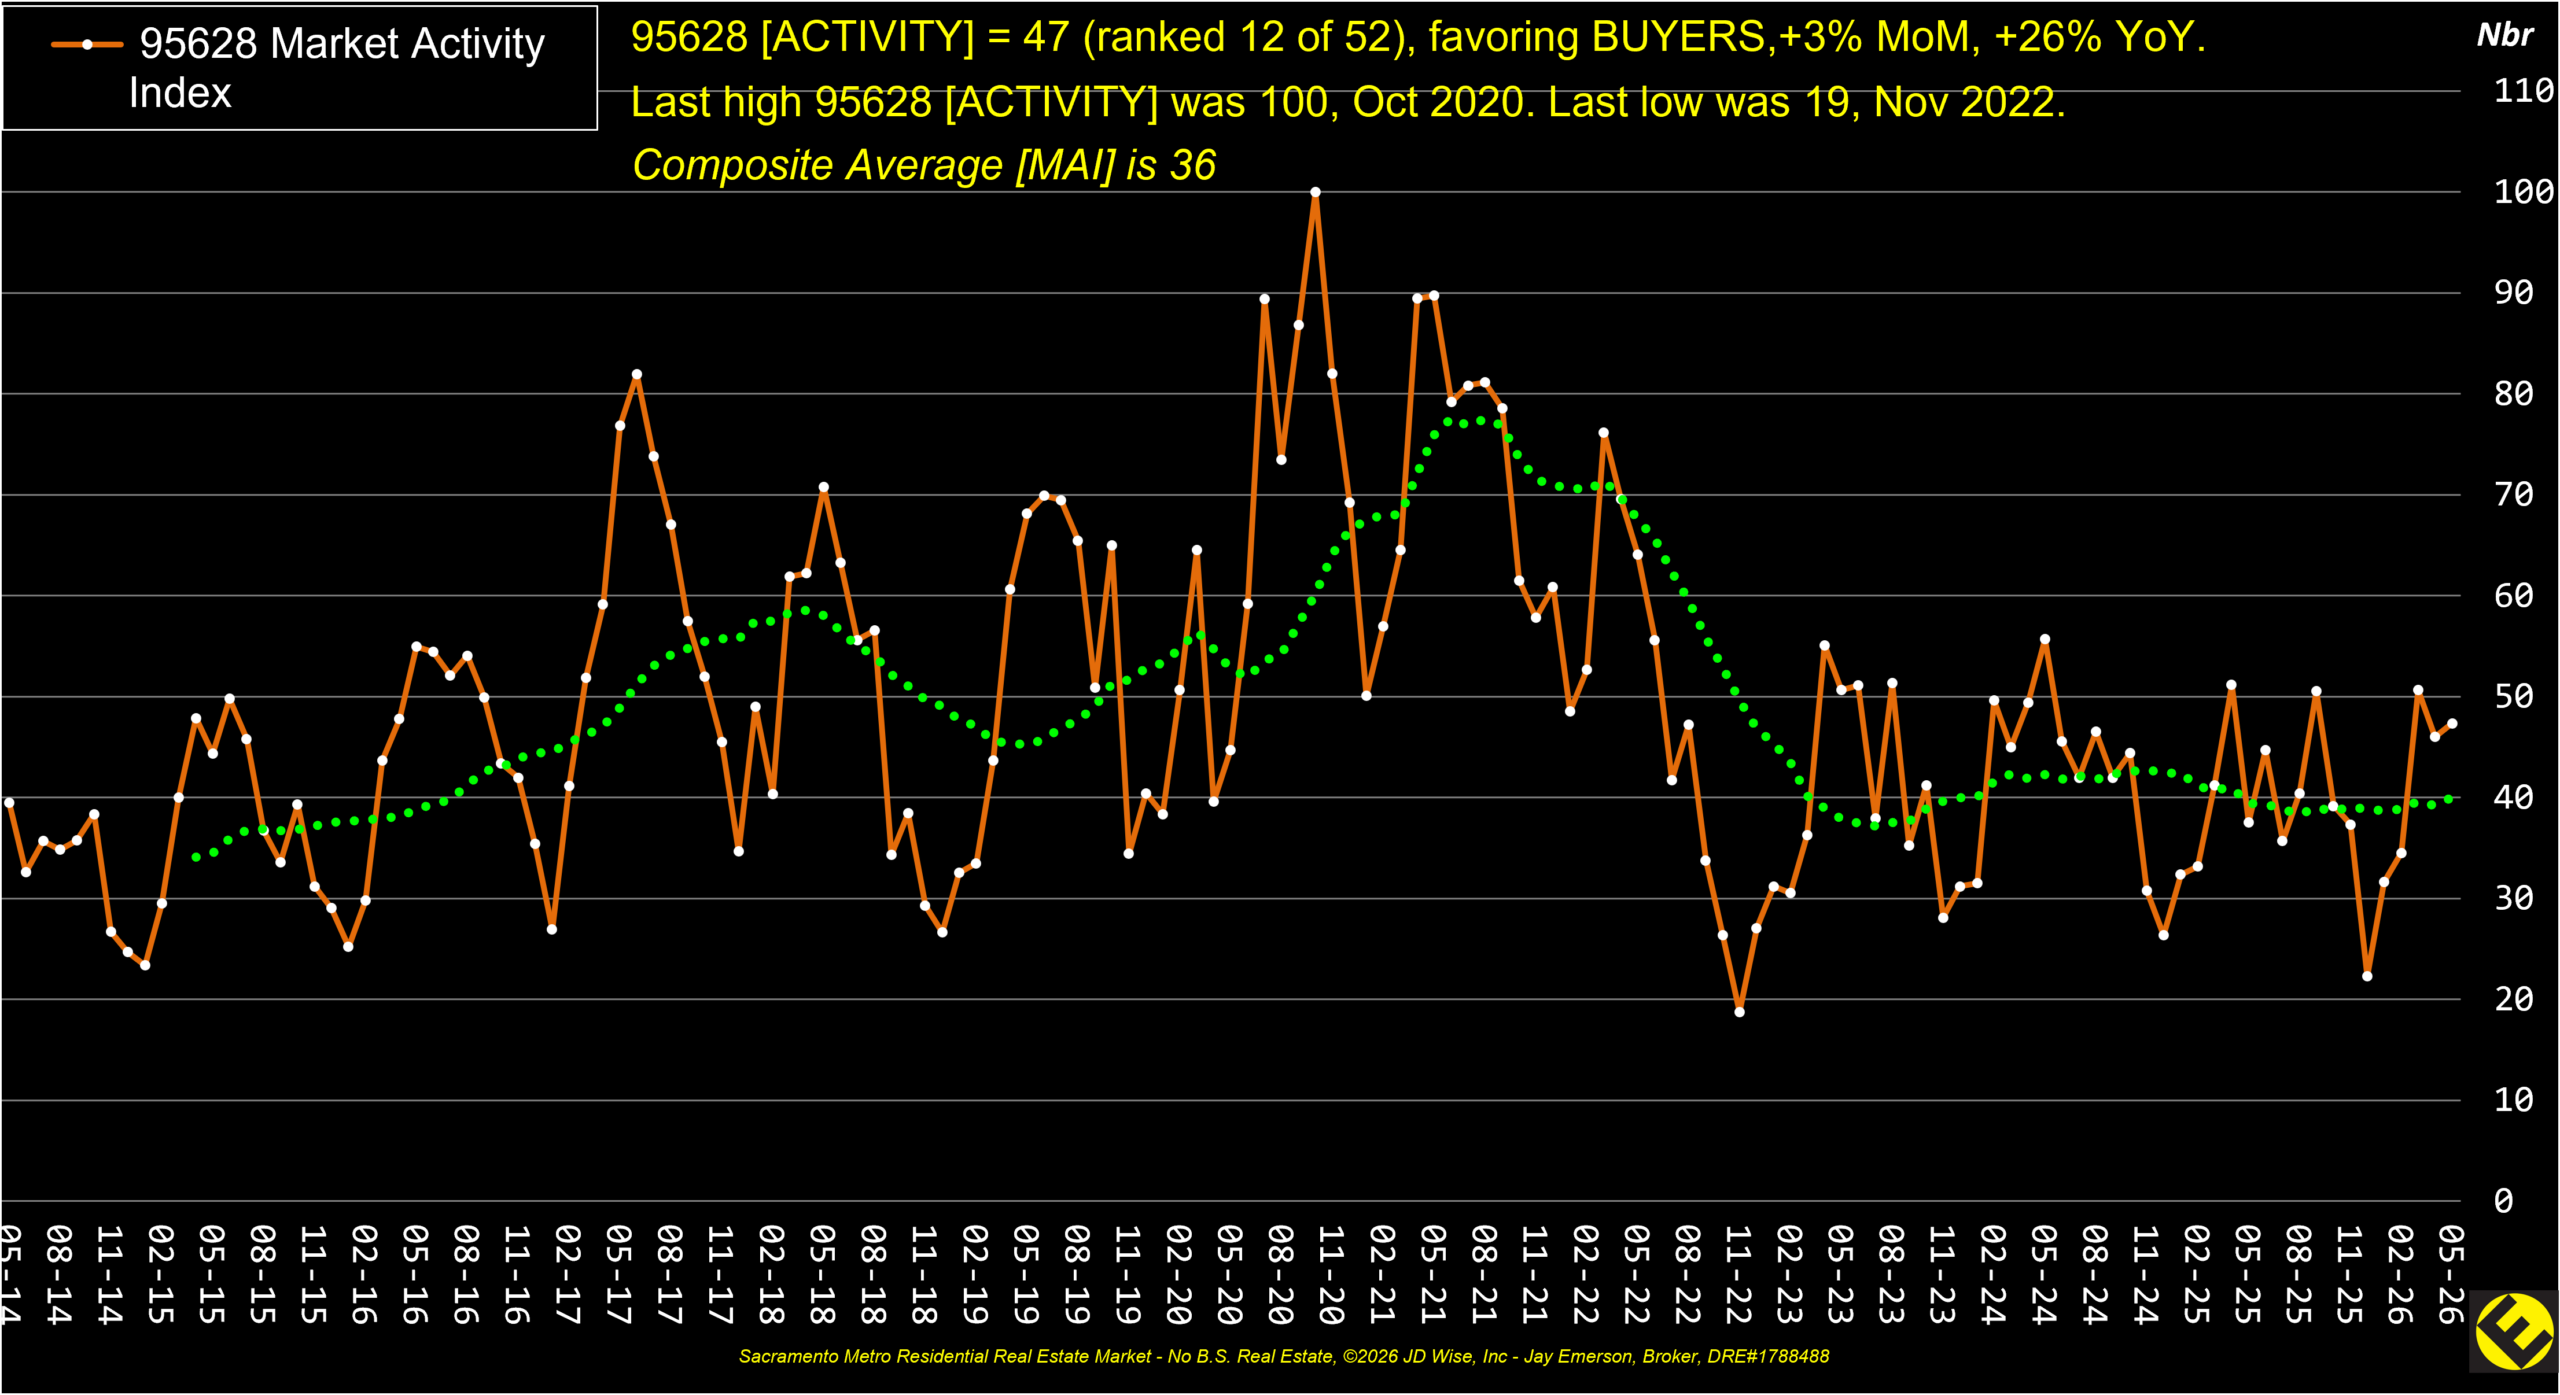
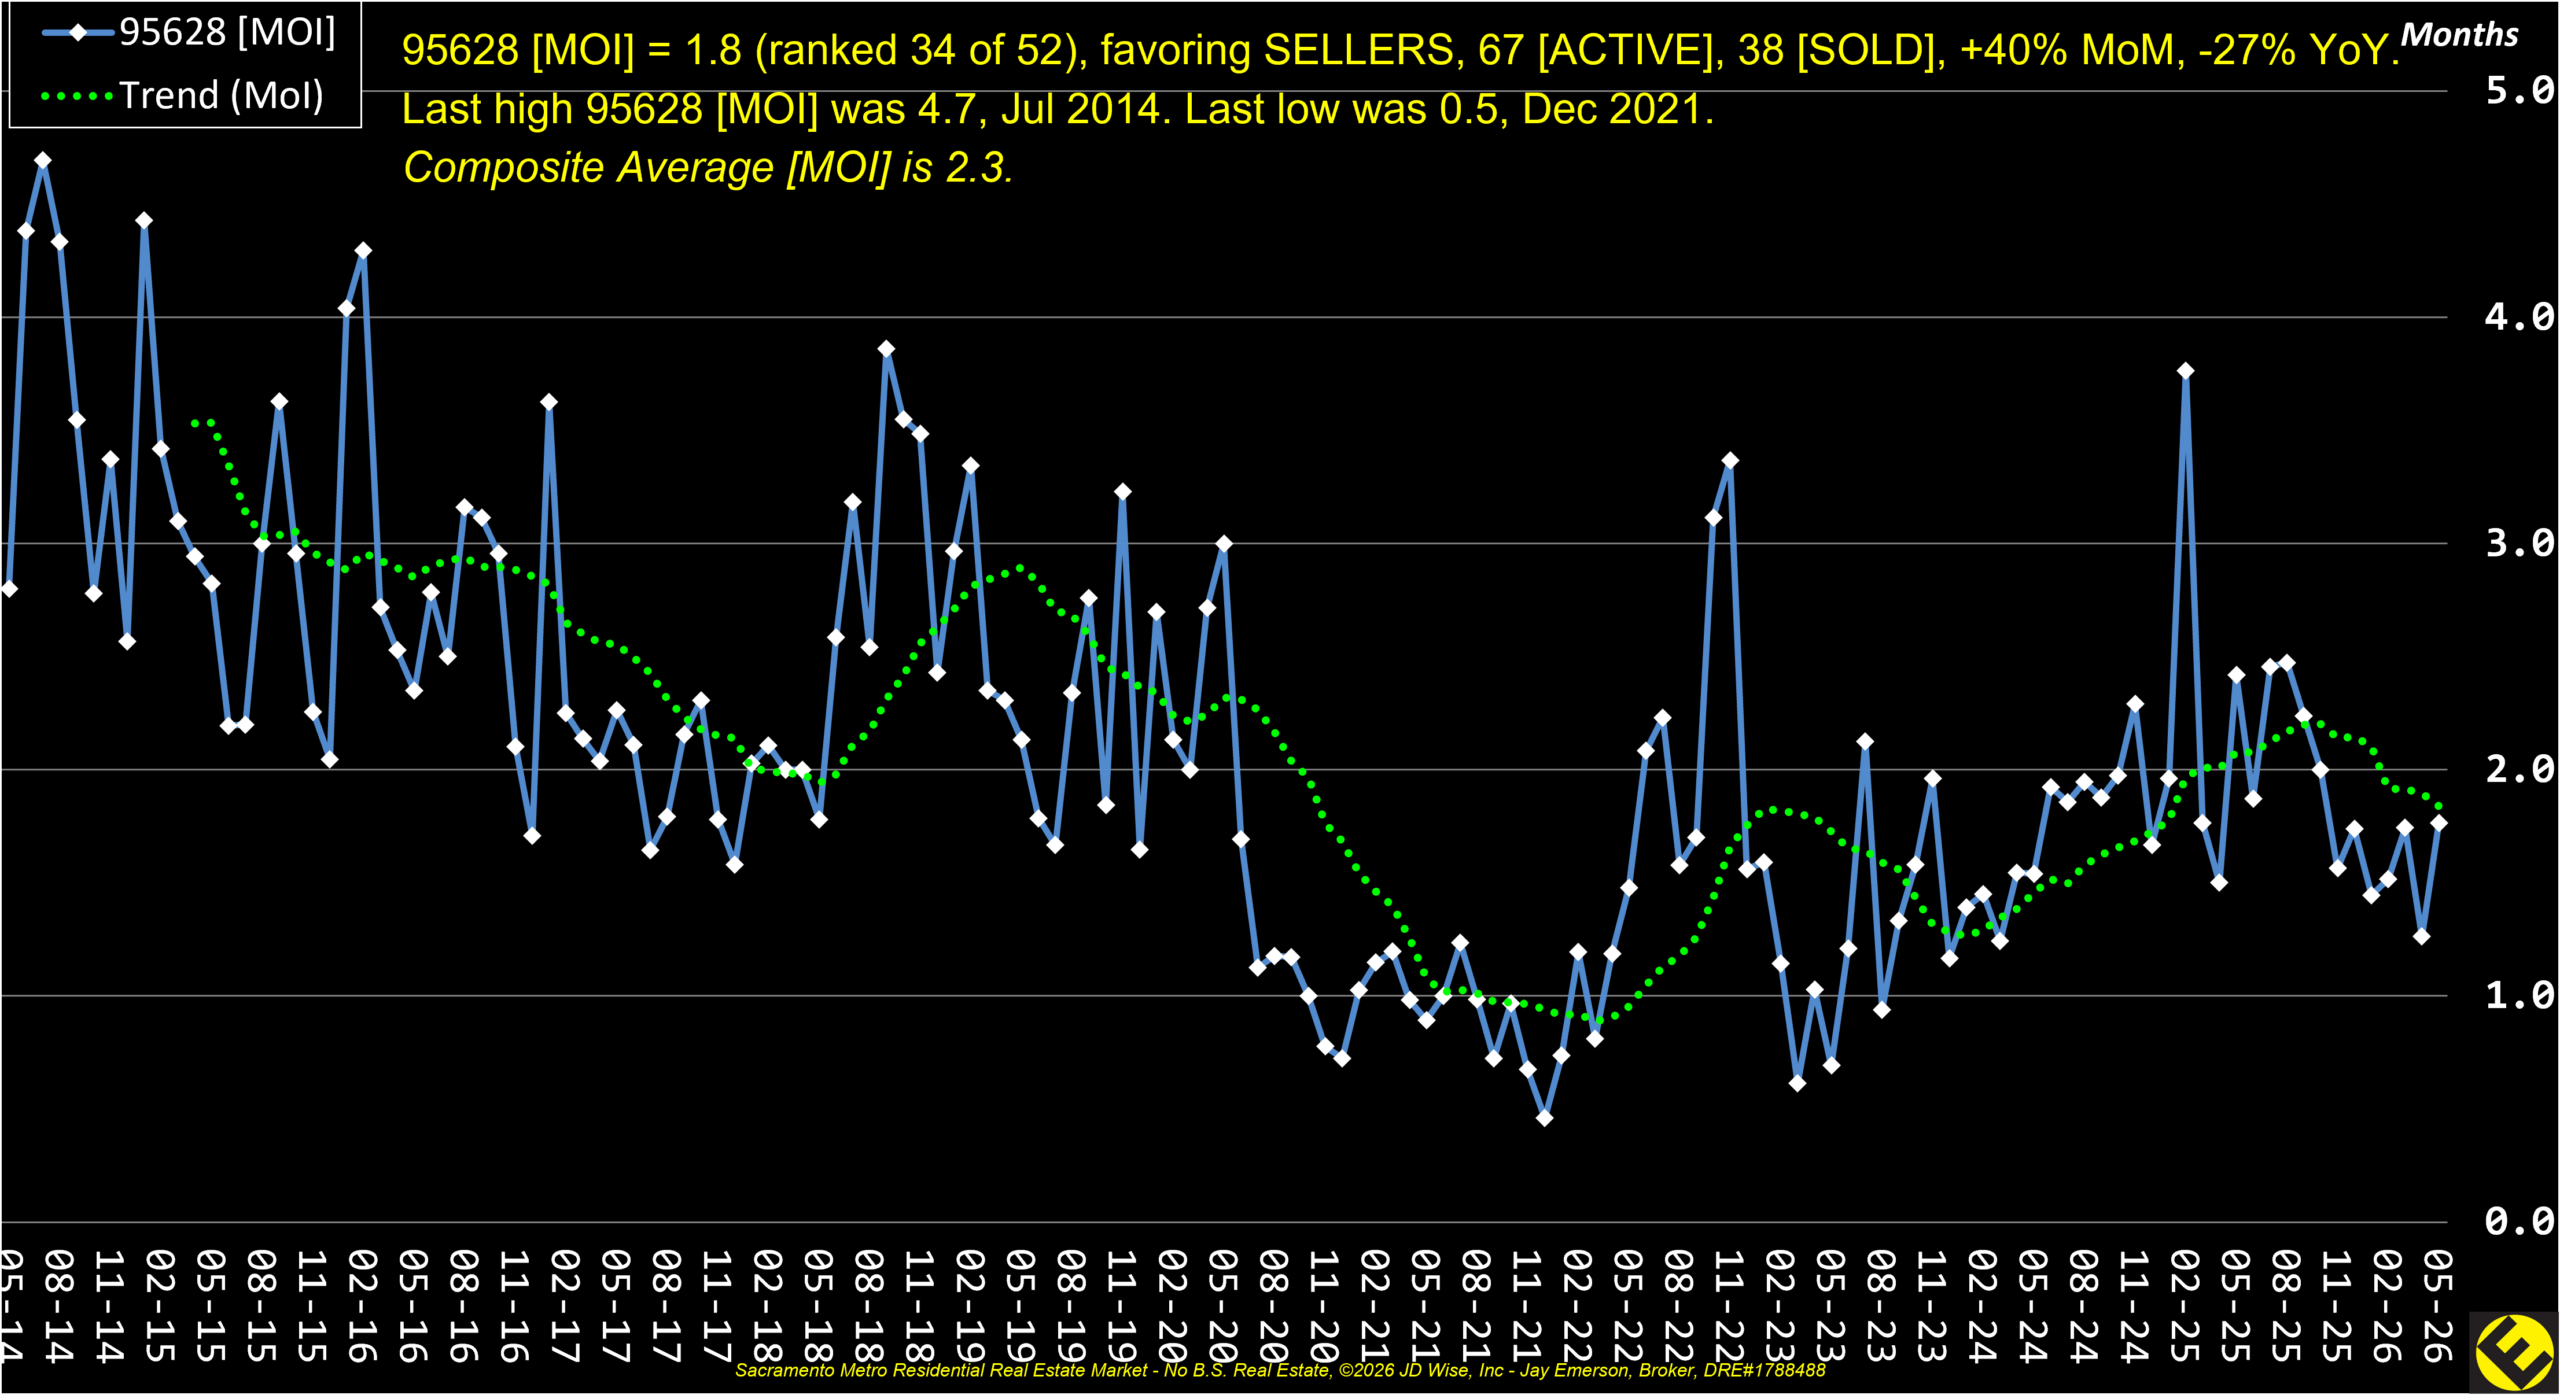
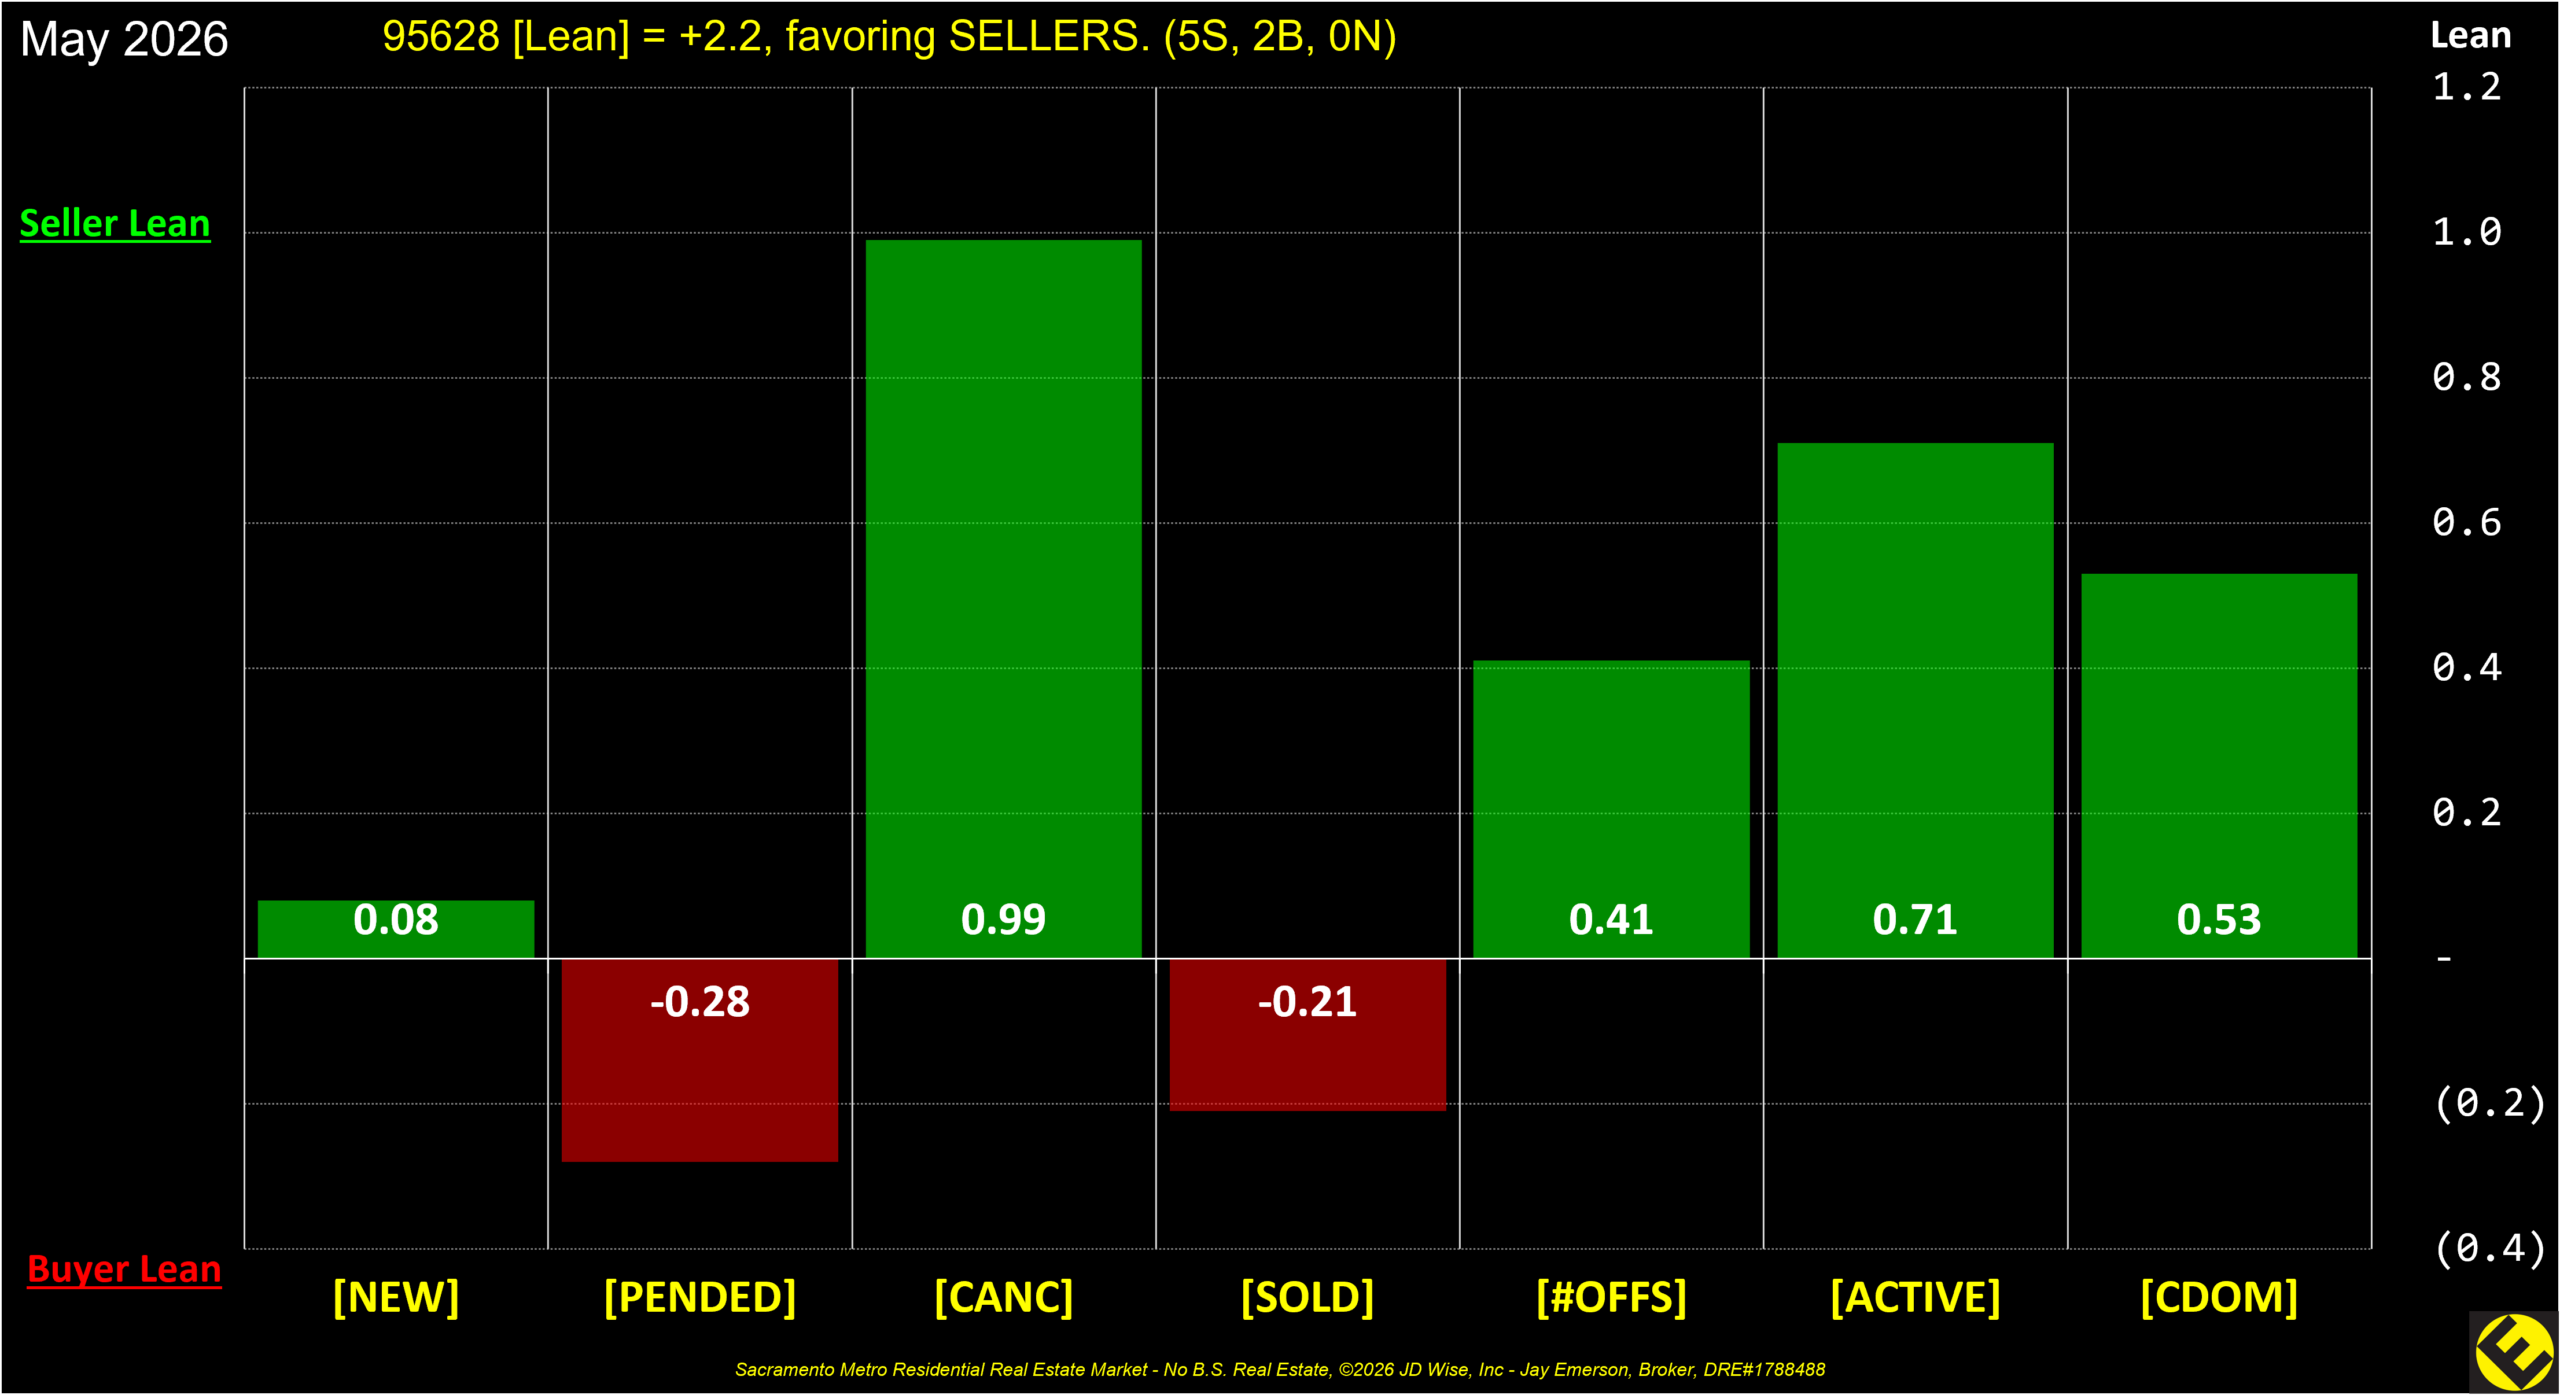
Monthly changes in data, trends, momentum and indices.