Sacramento Metro Real Estate Market

Metro Counties

  • Market Menu
  • Counties
  • Zip Menu

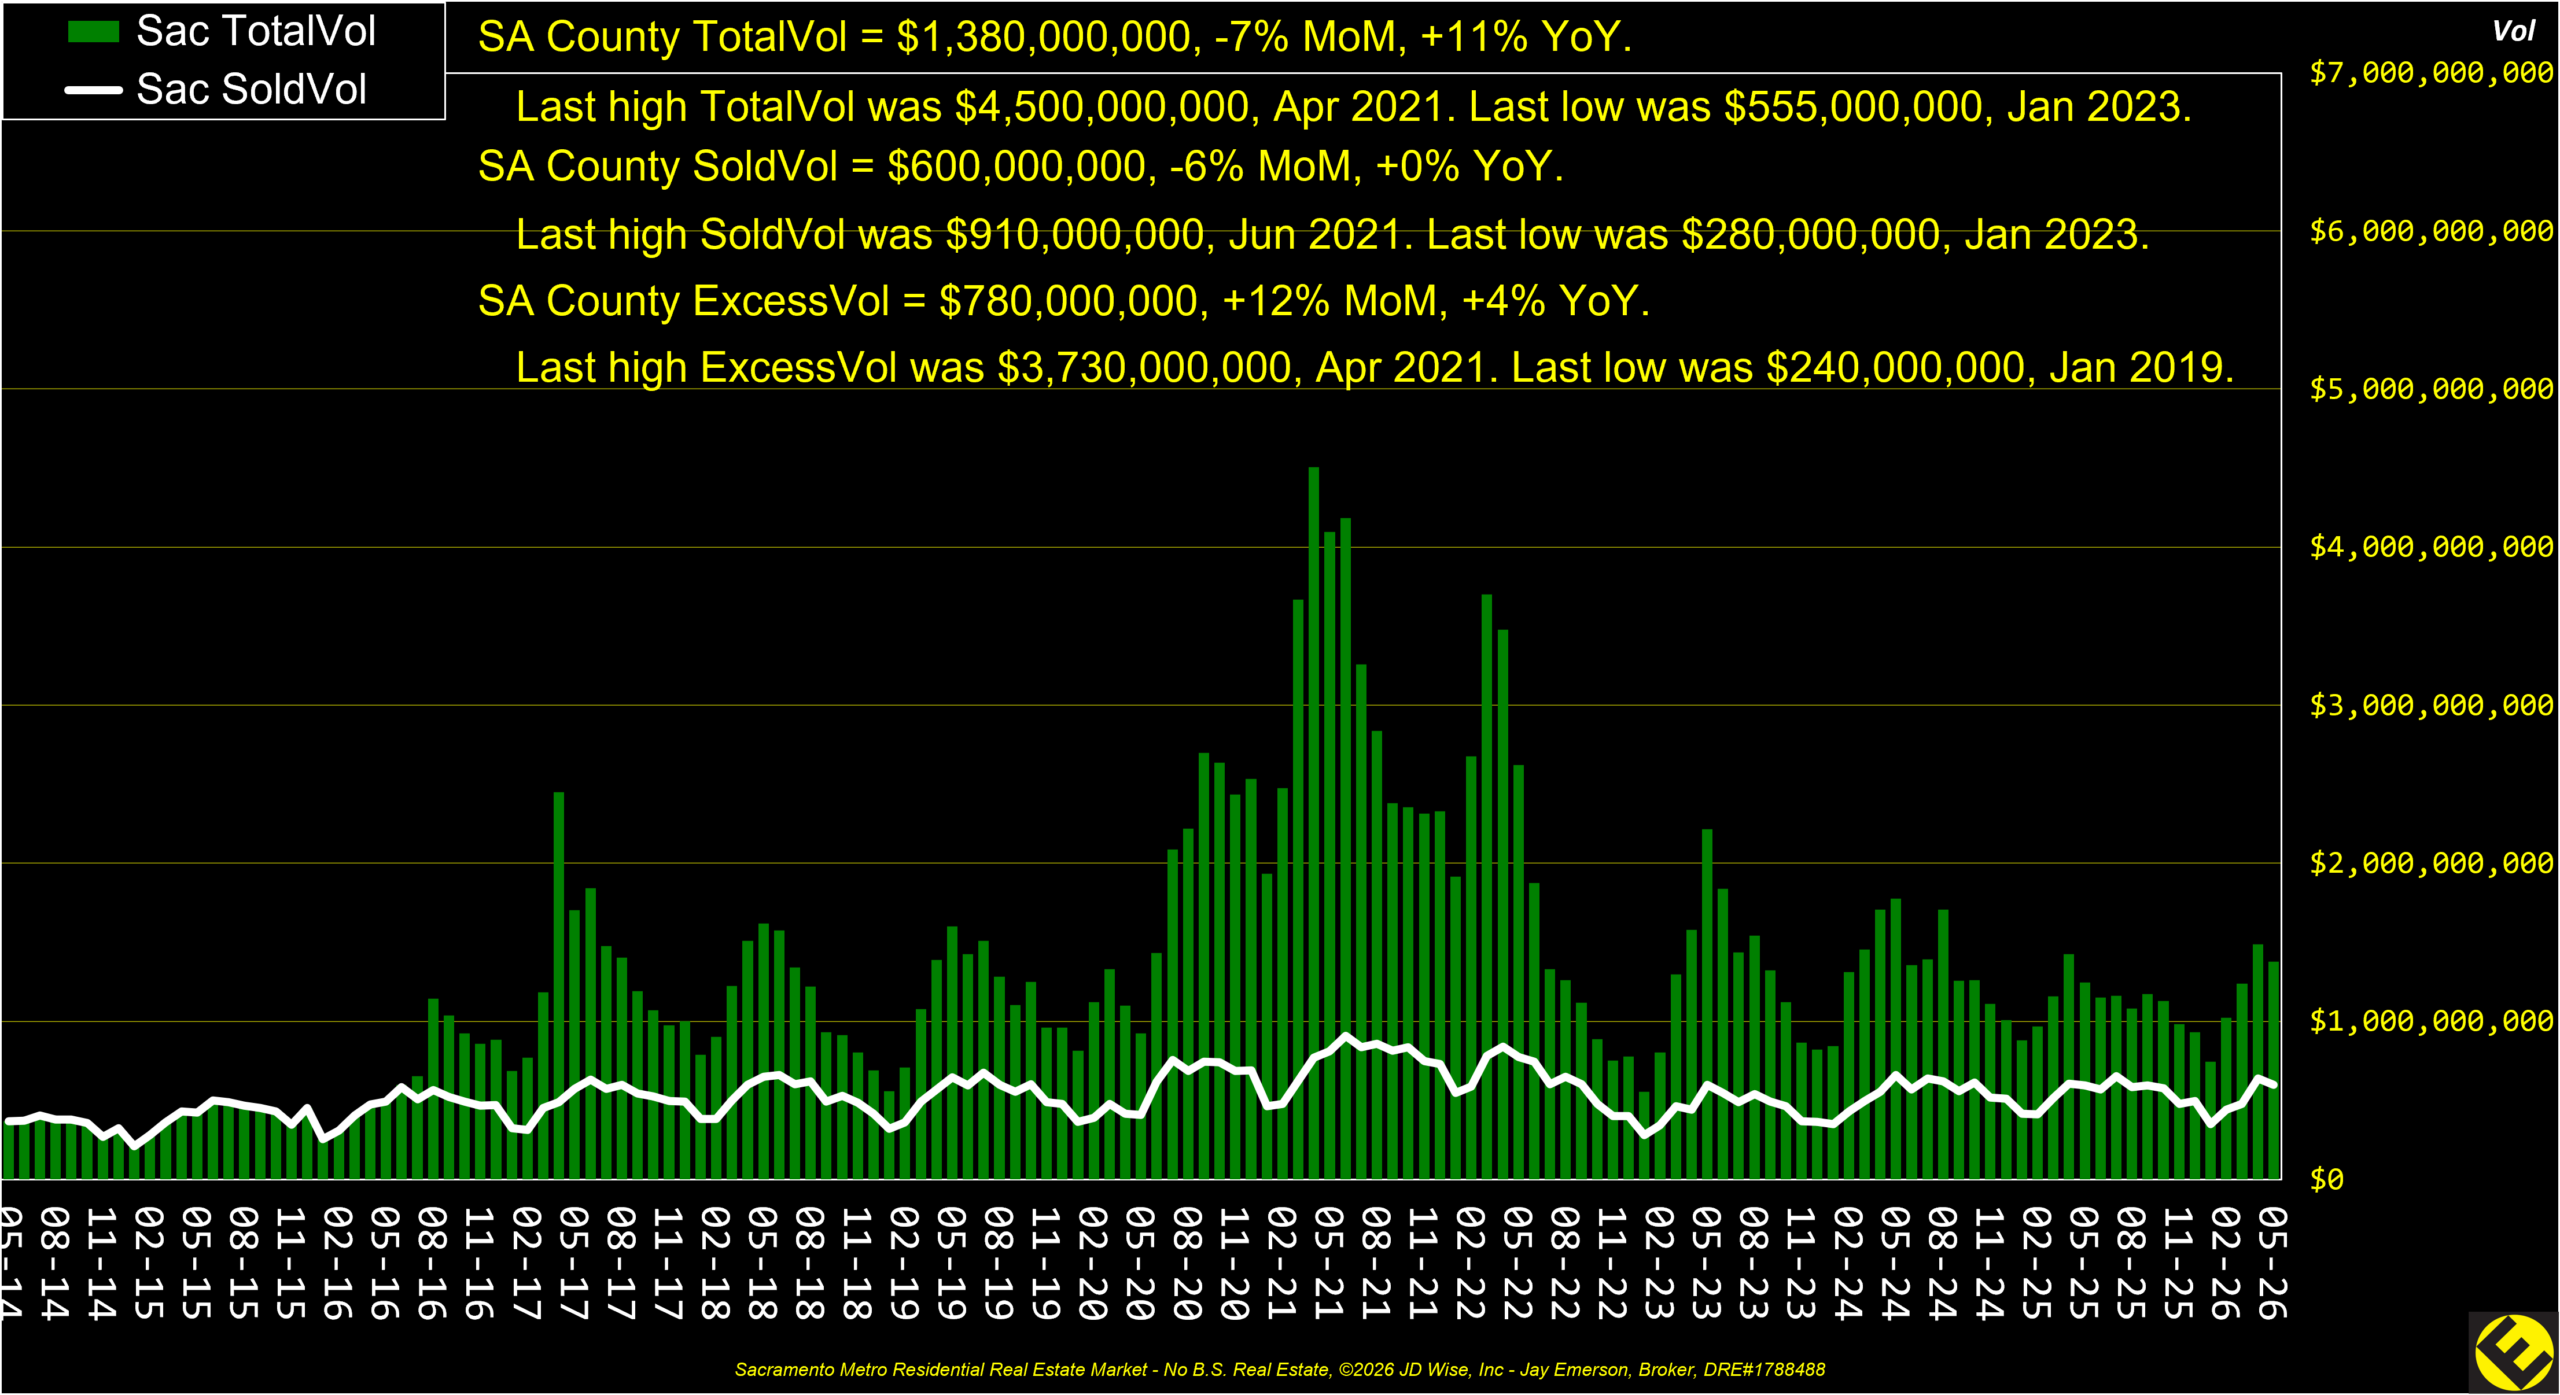
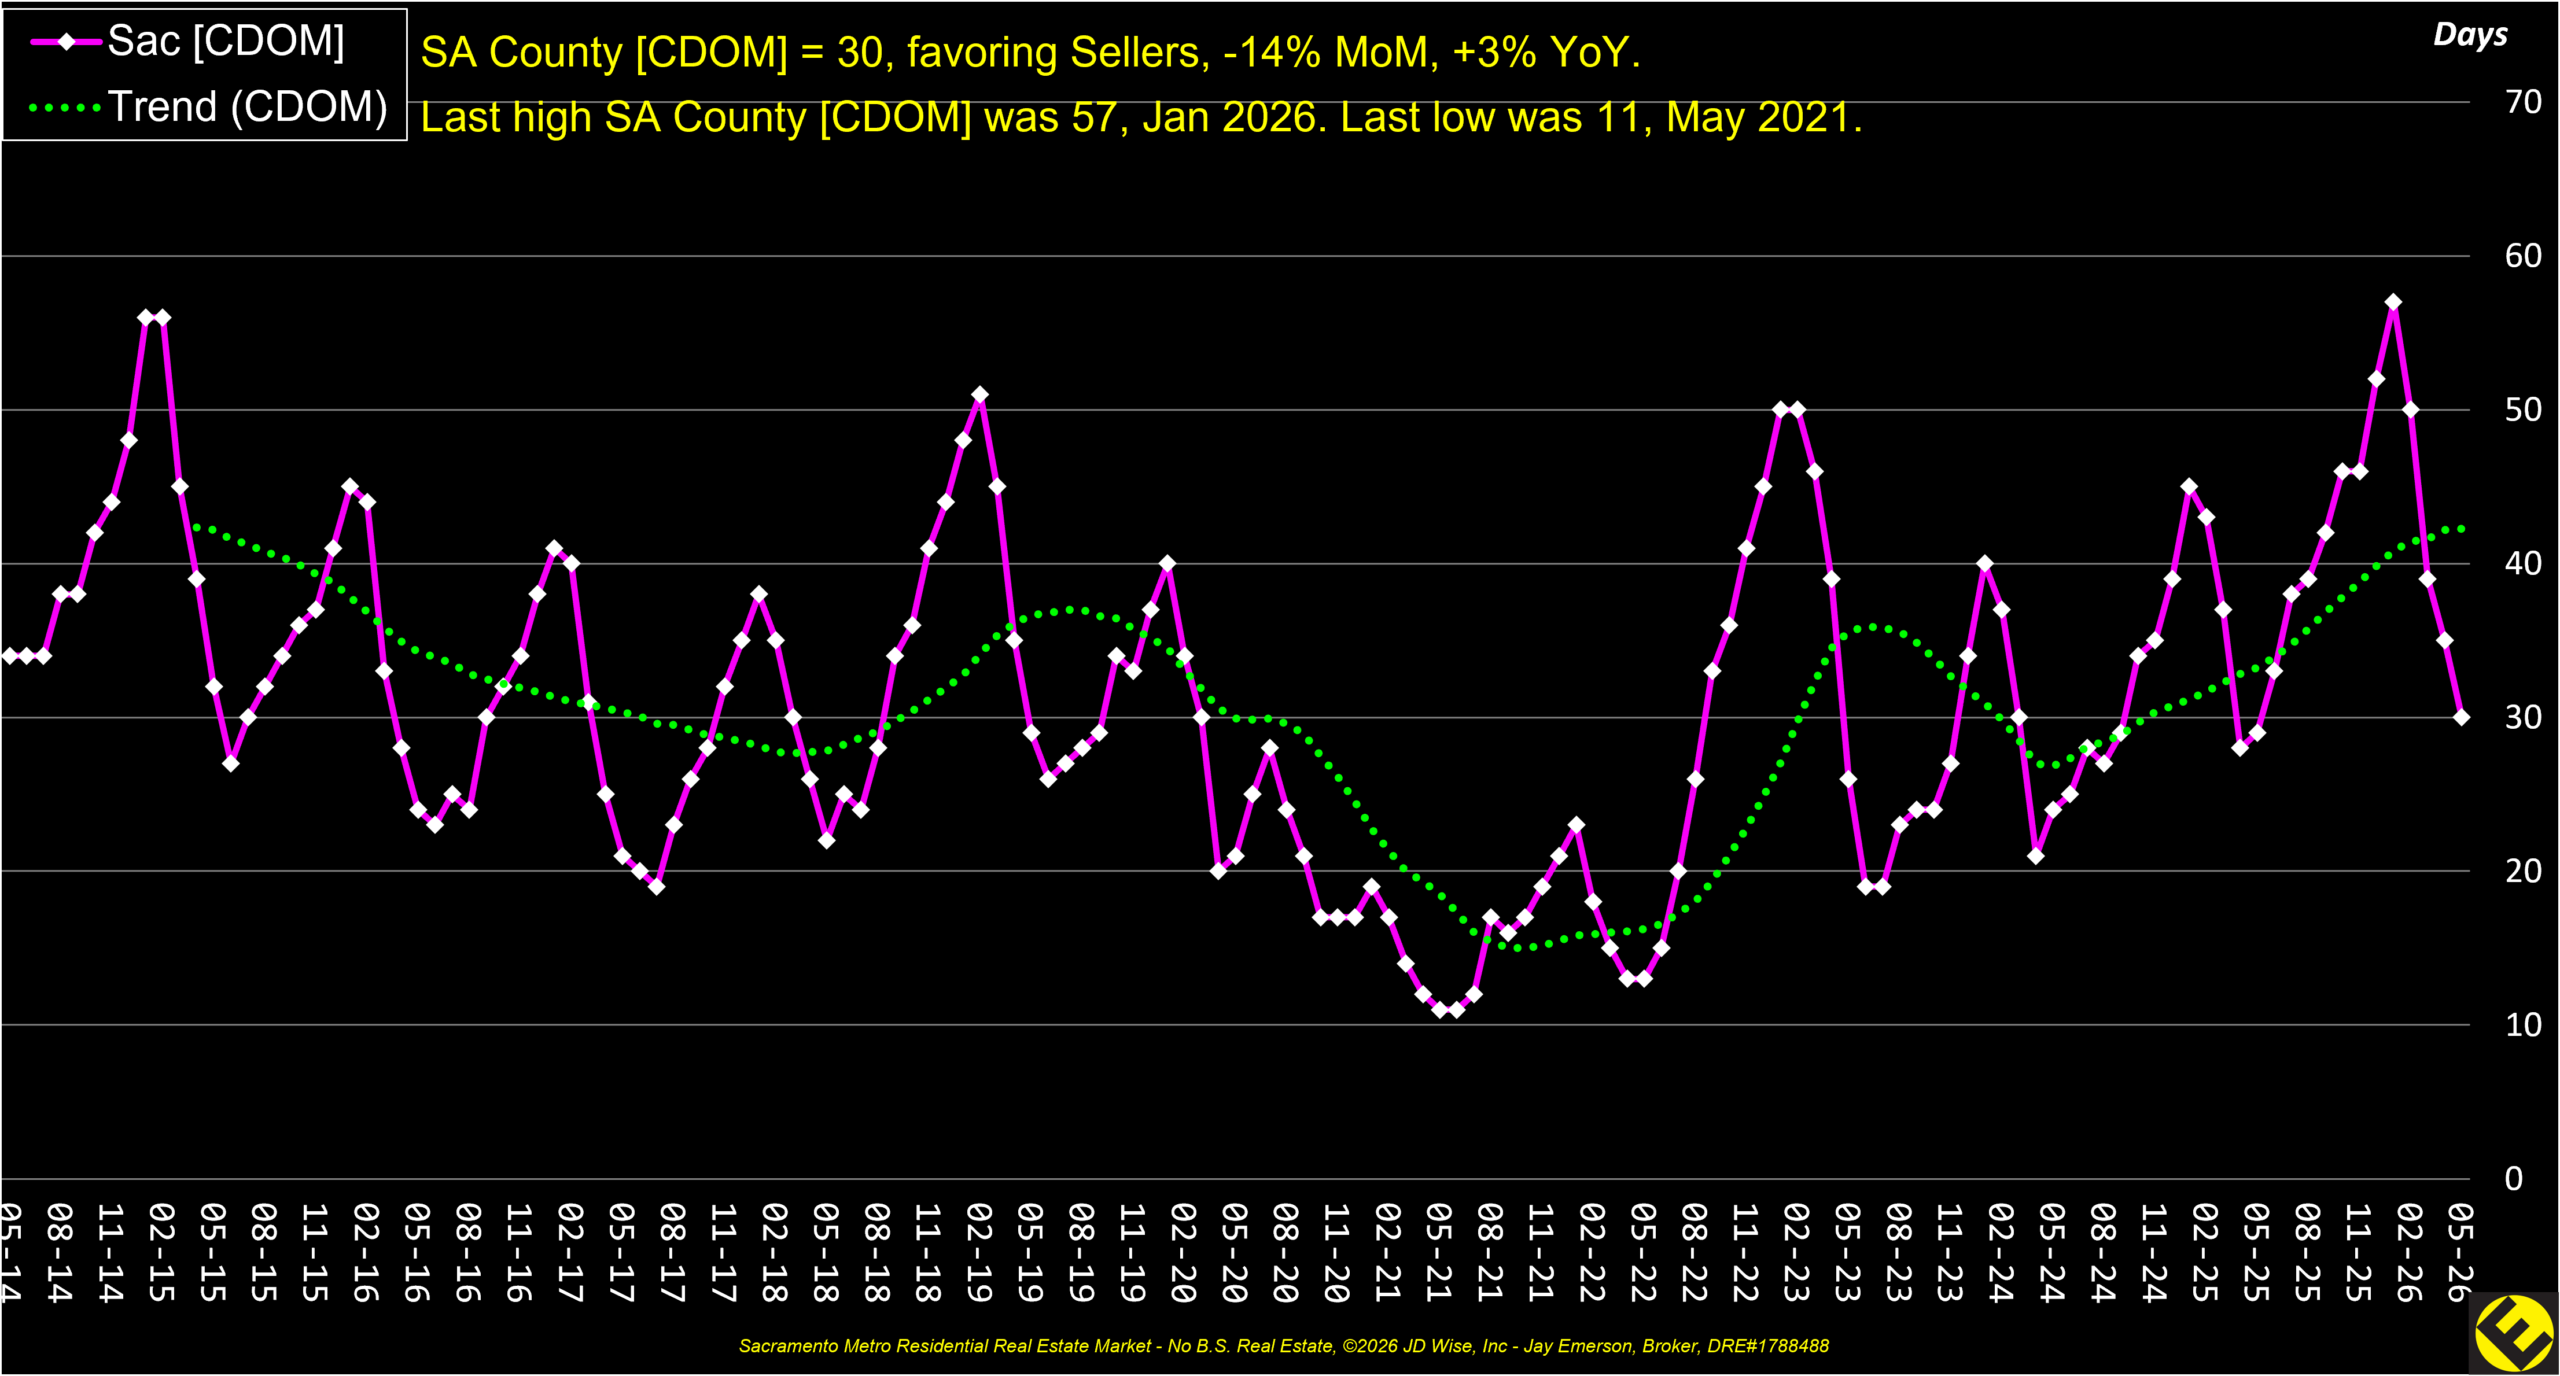
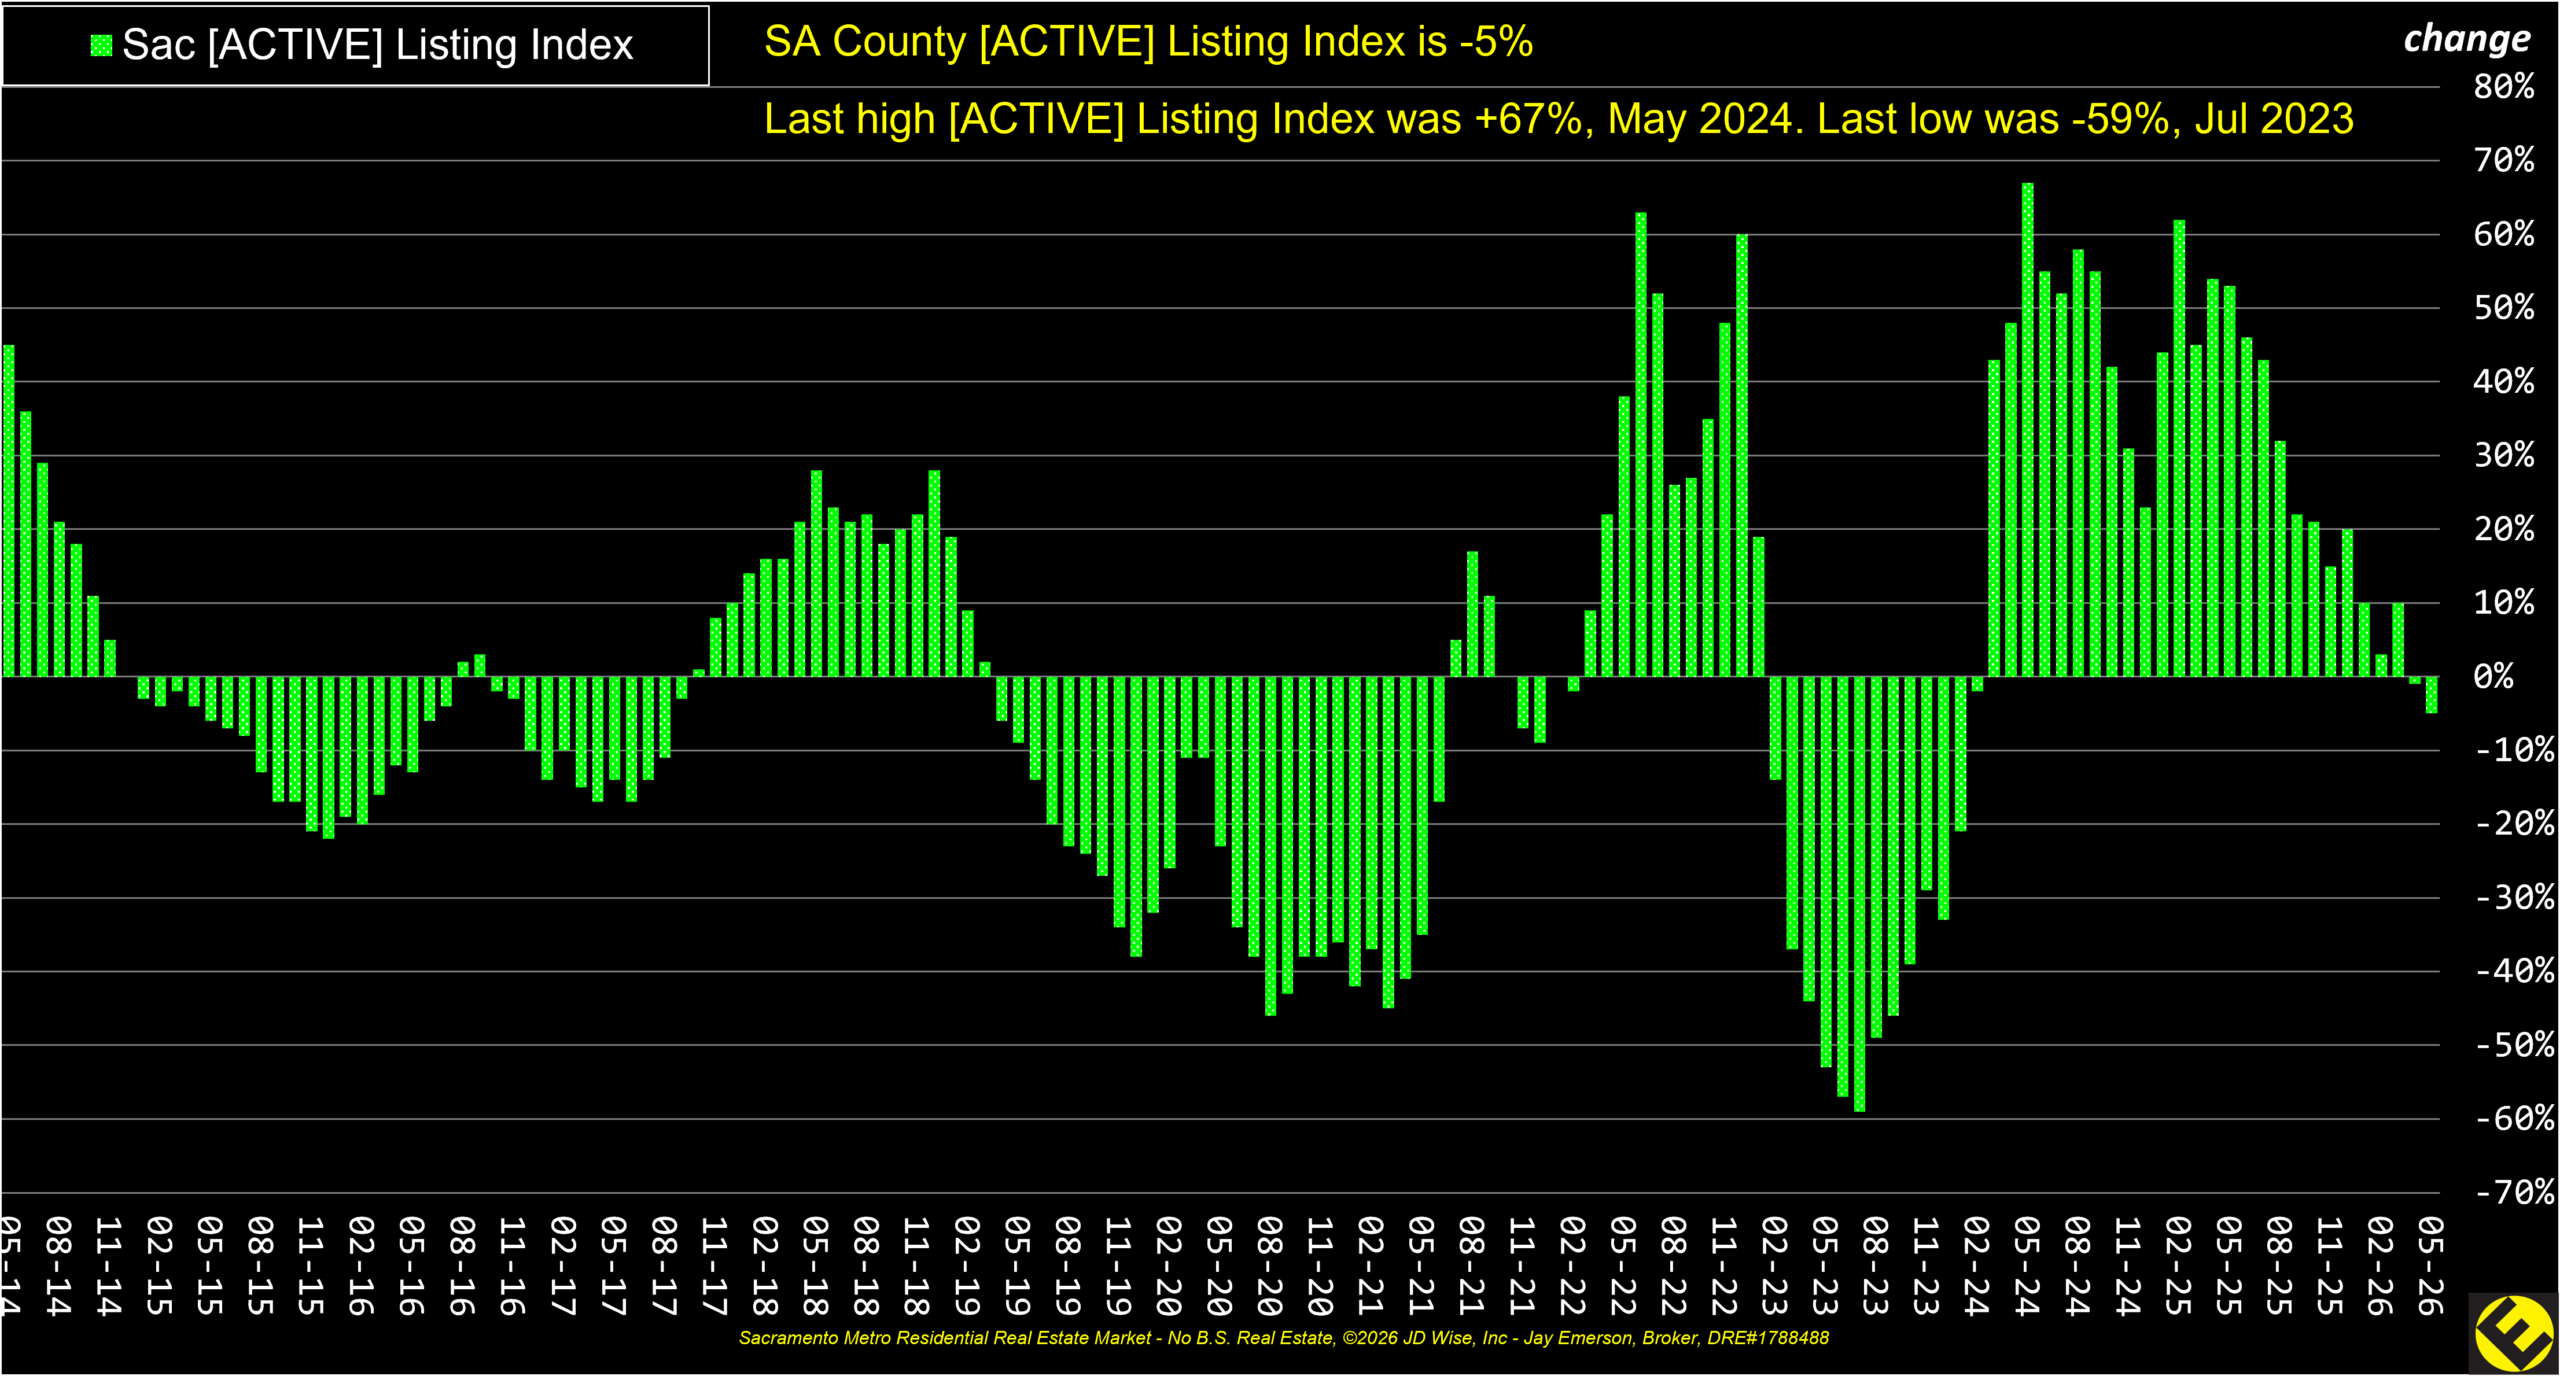
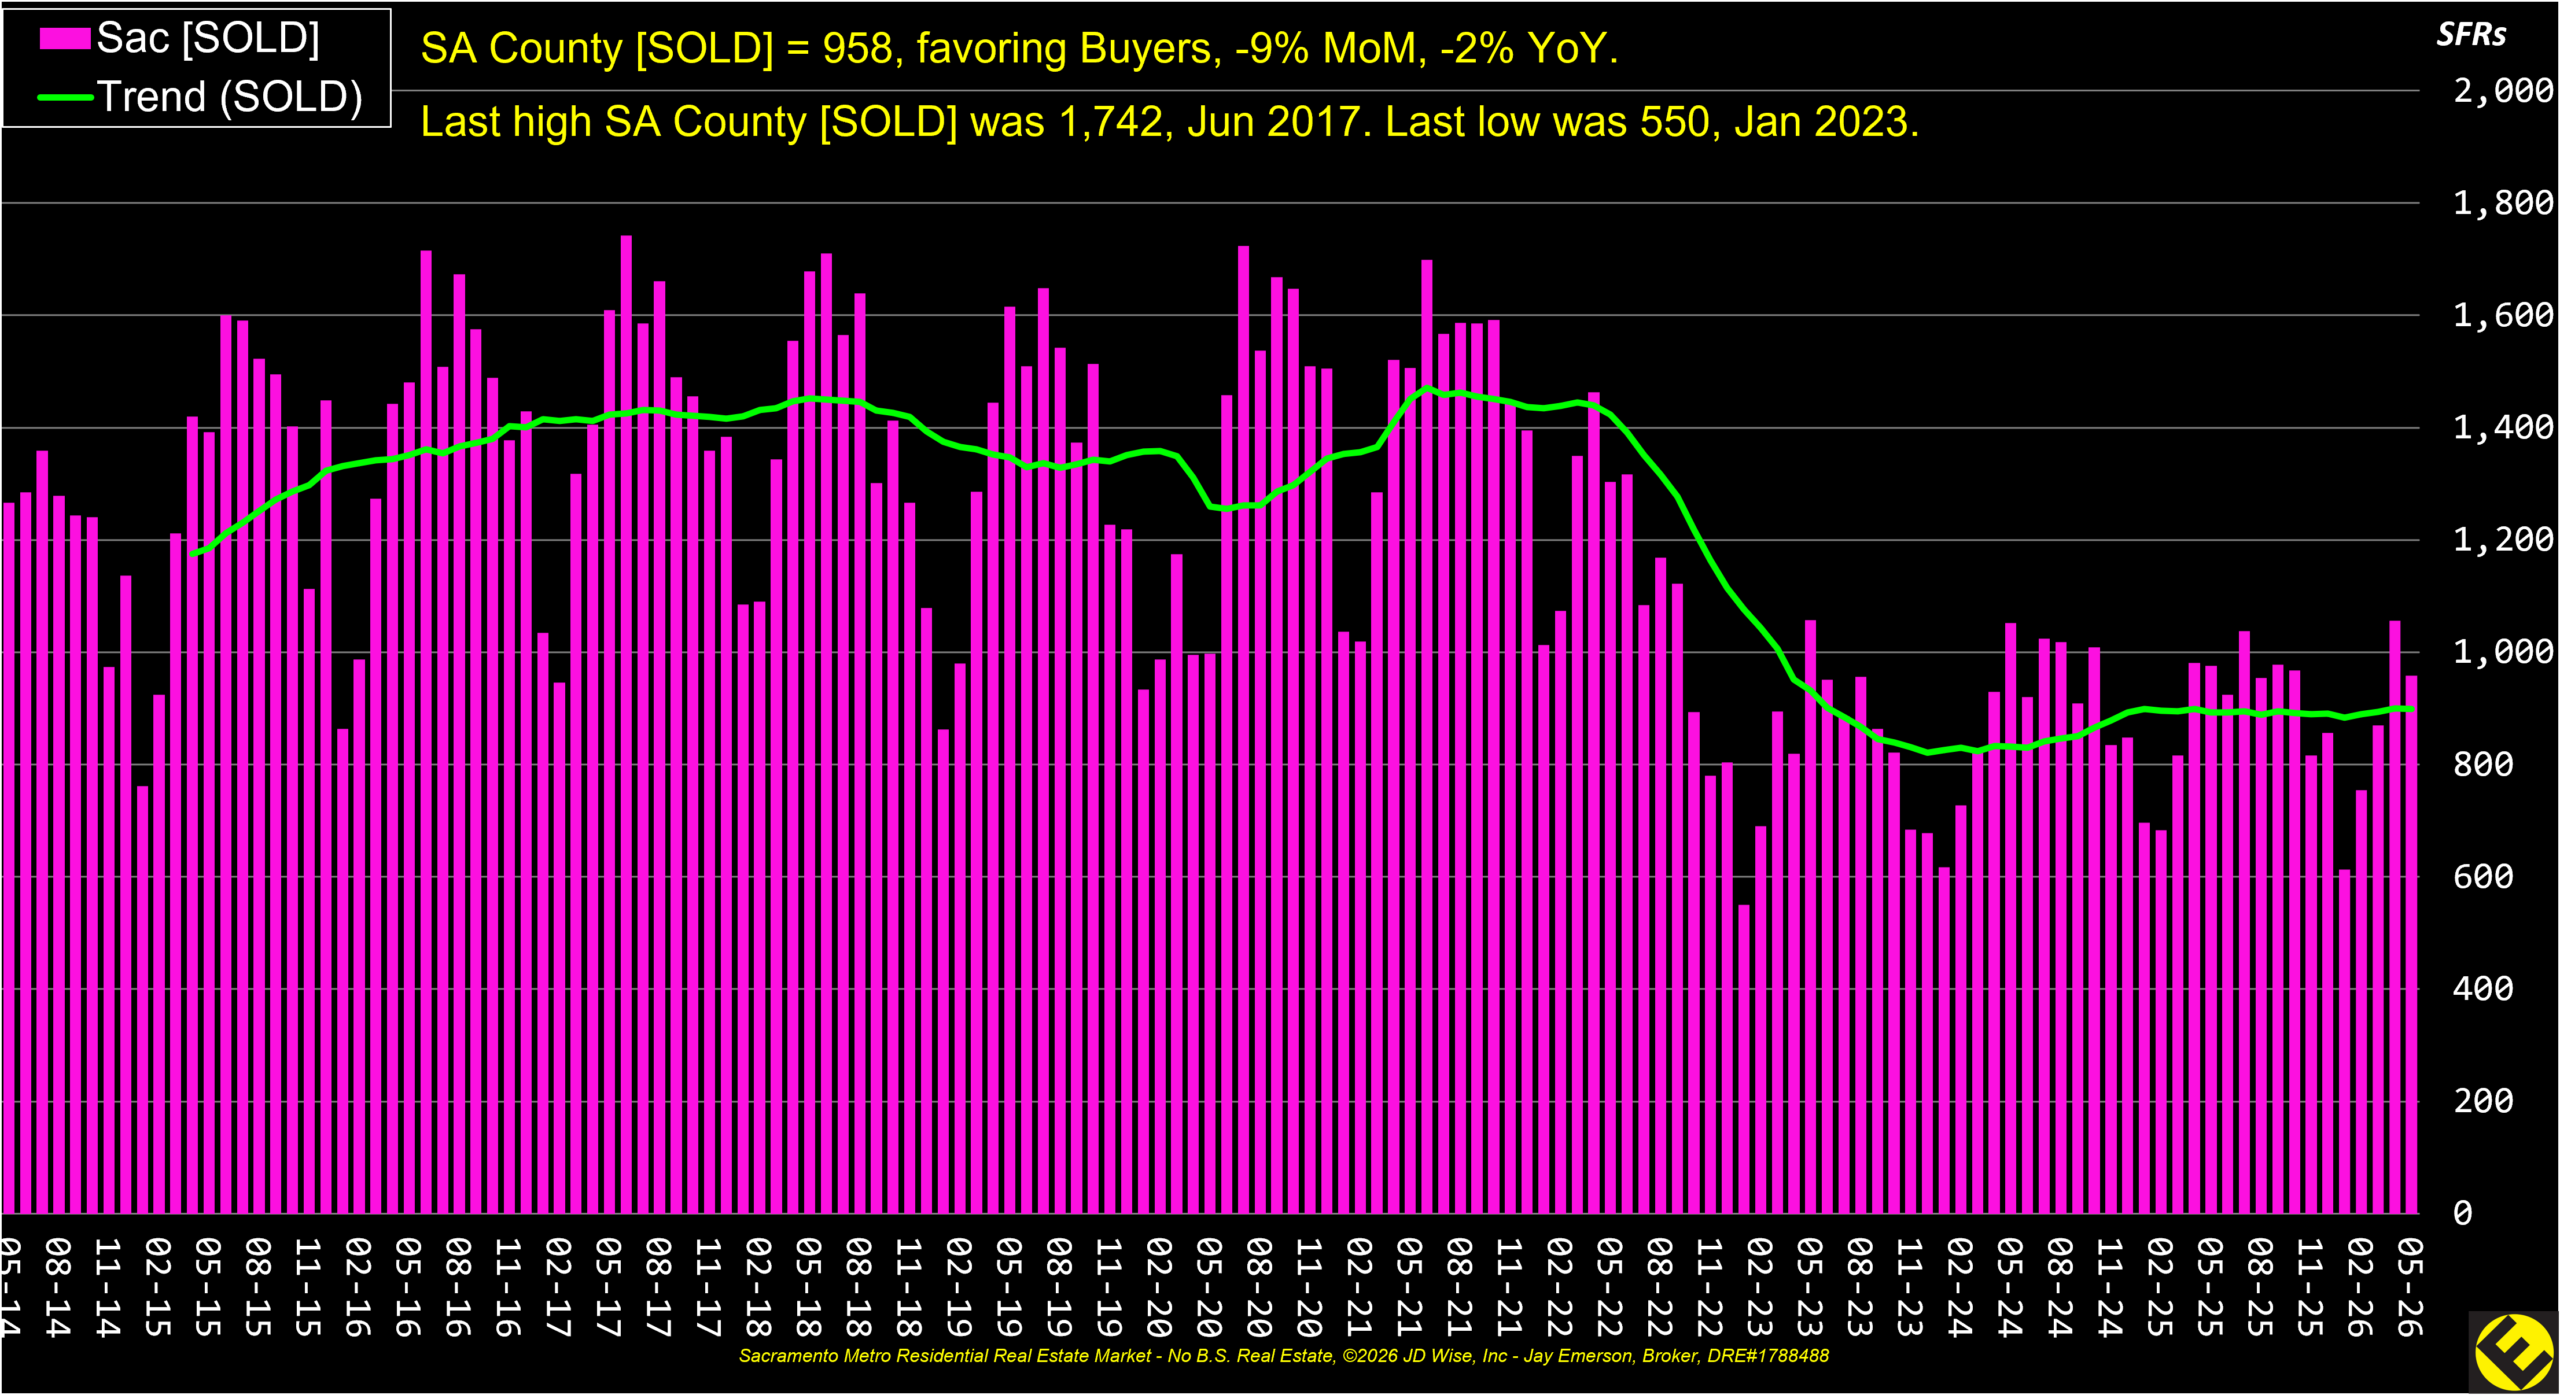
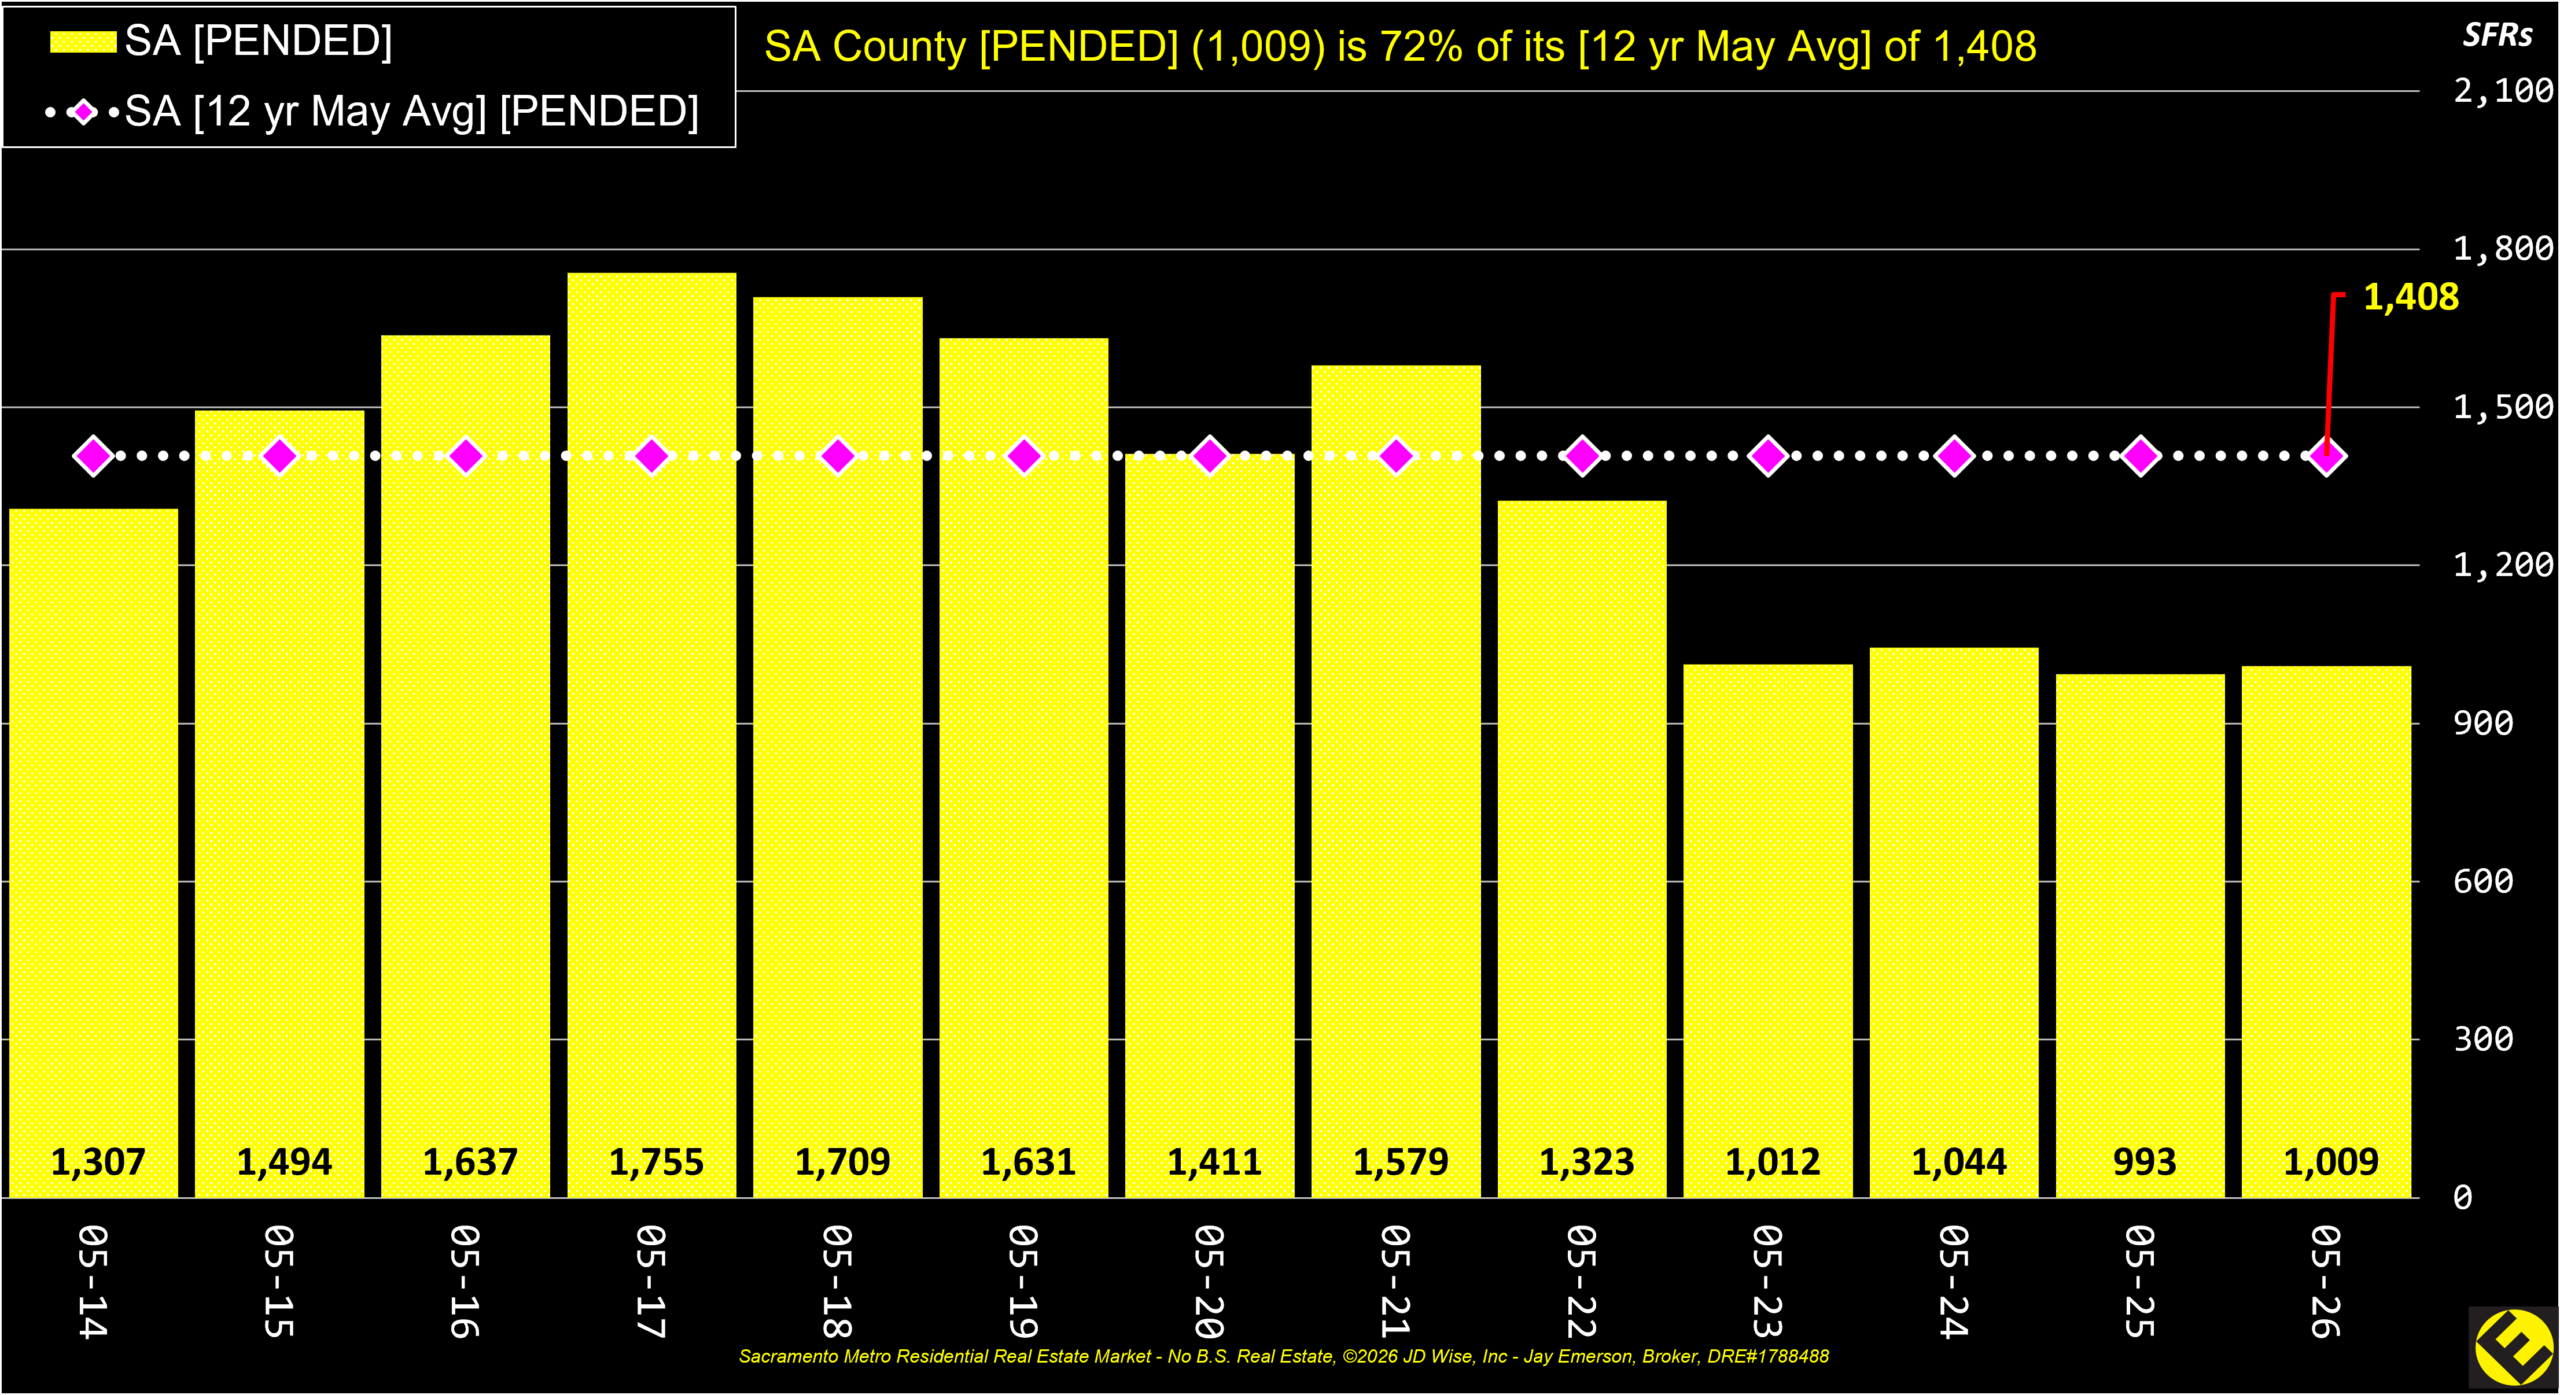
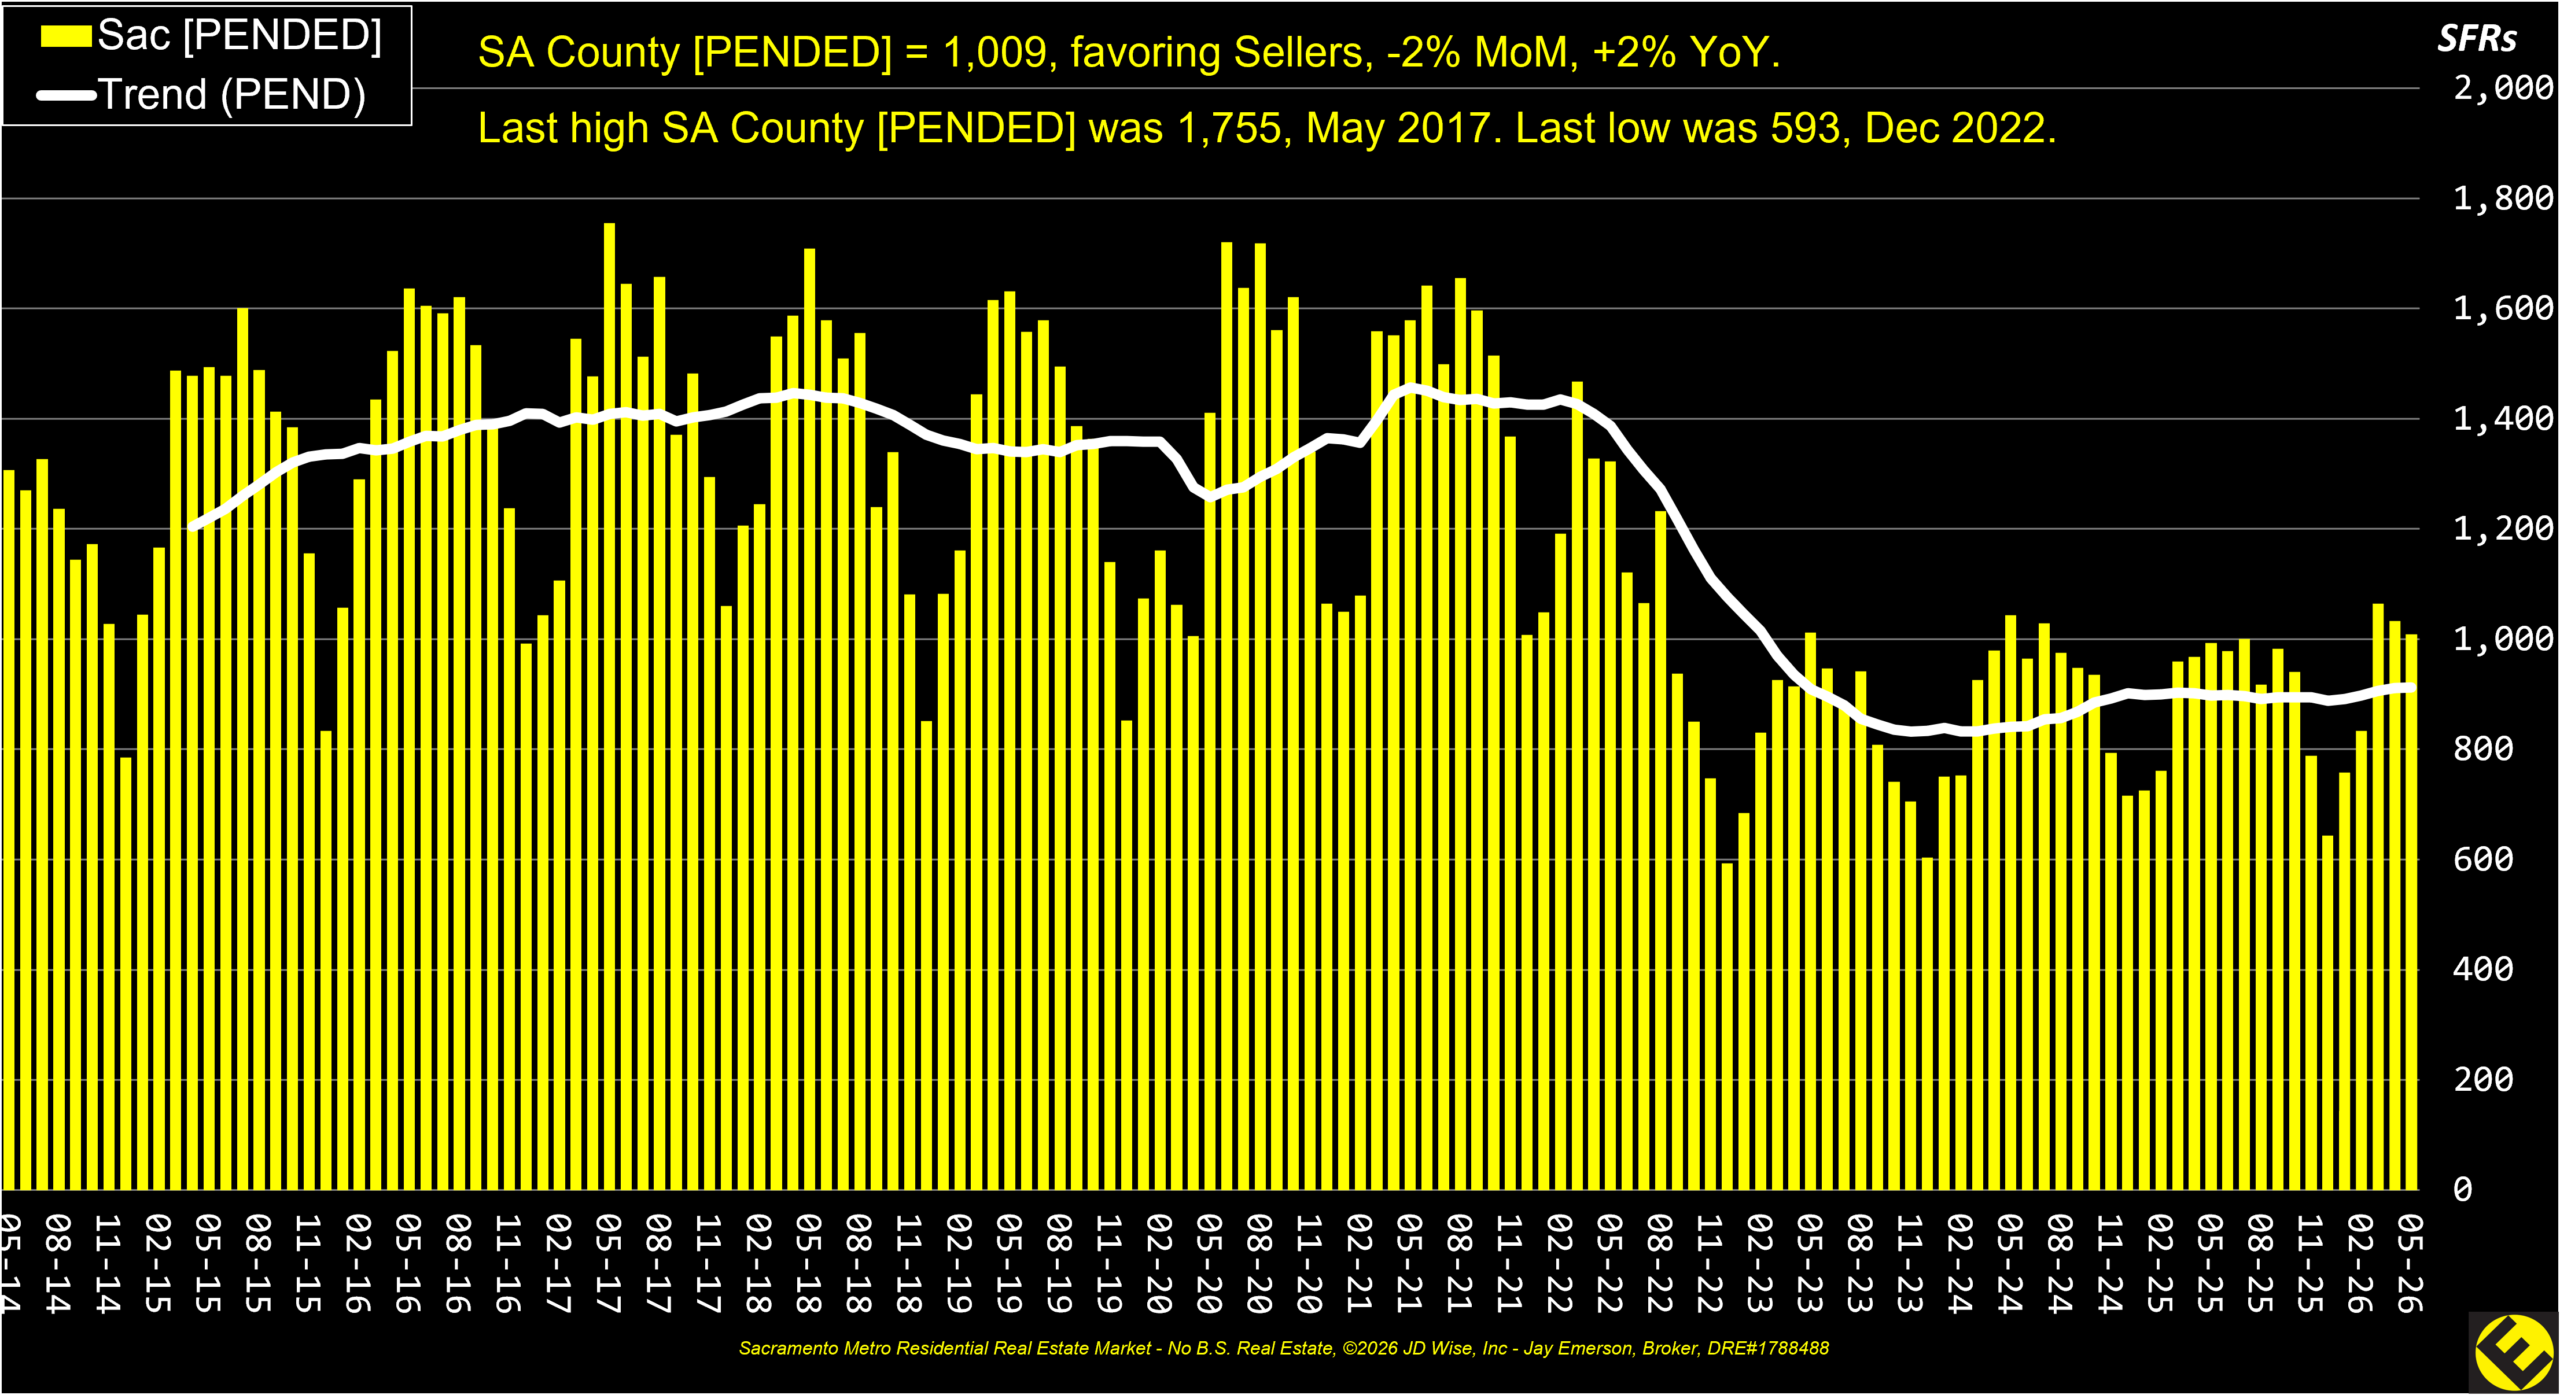
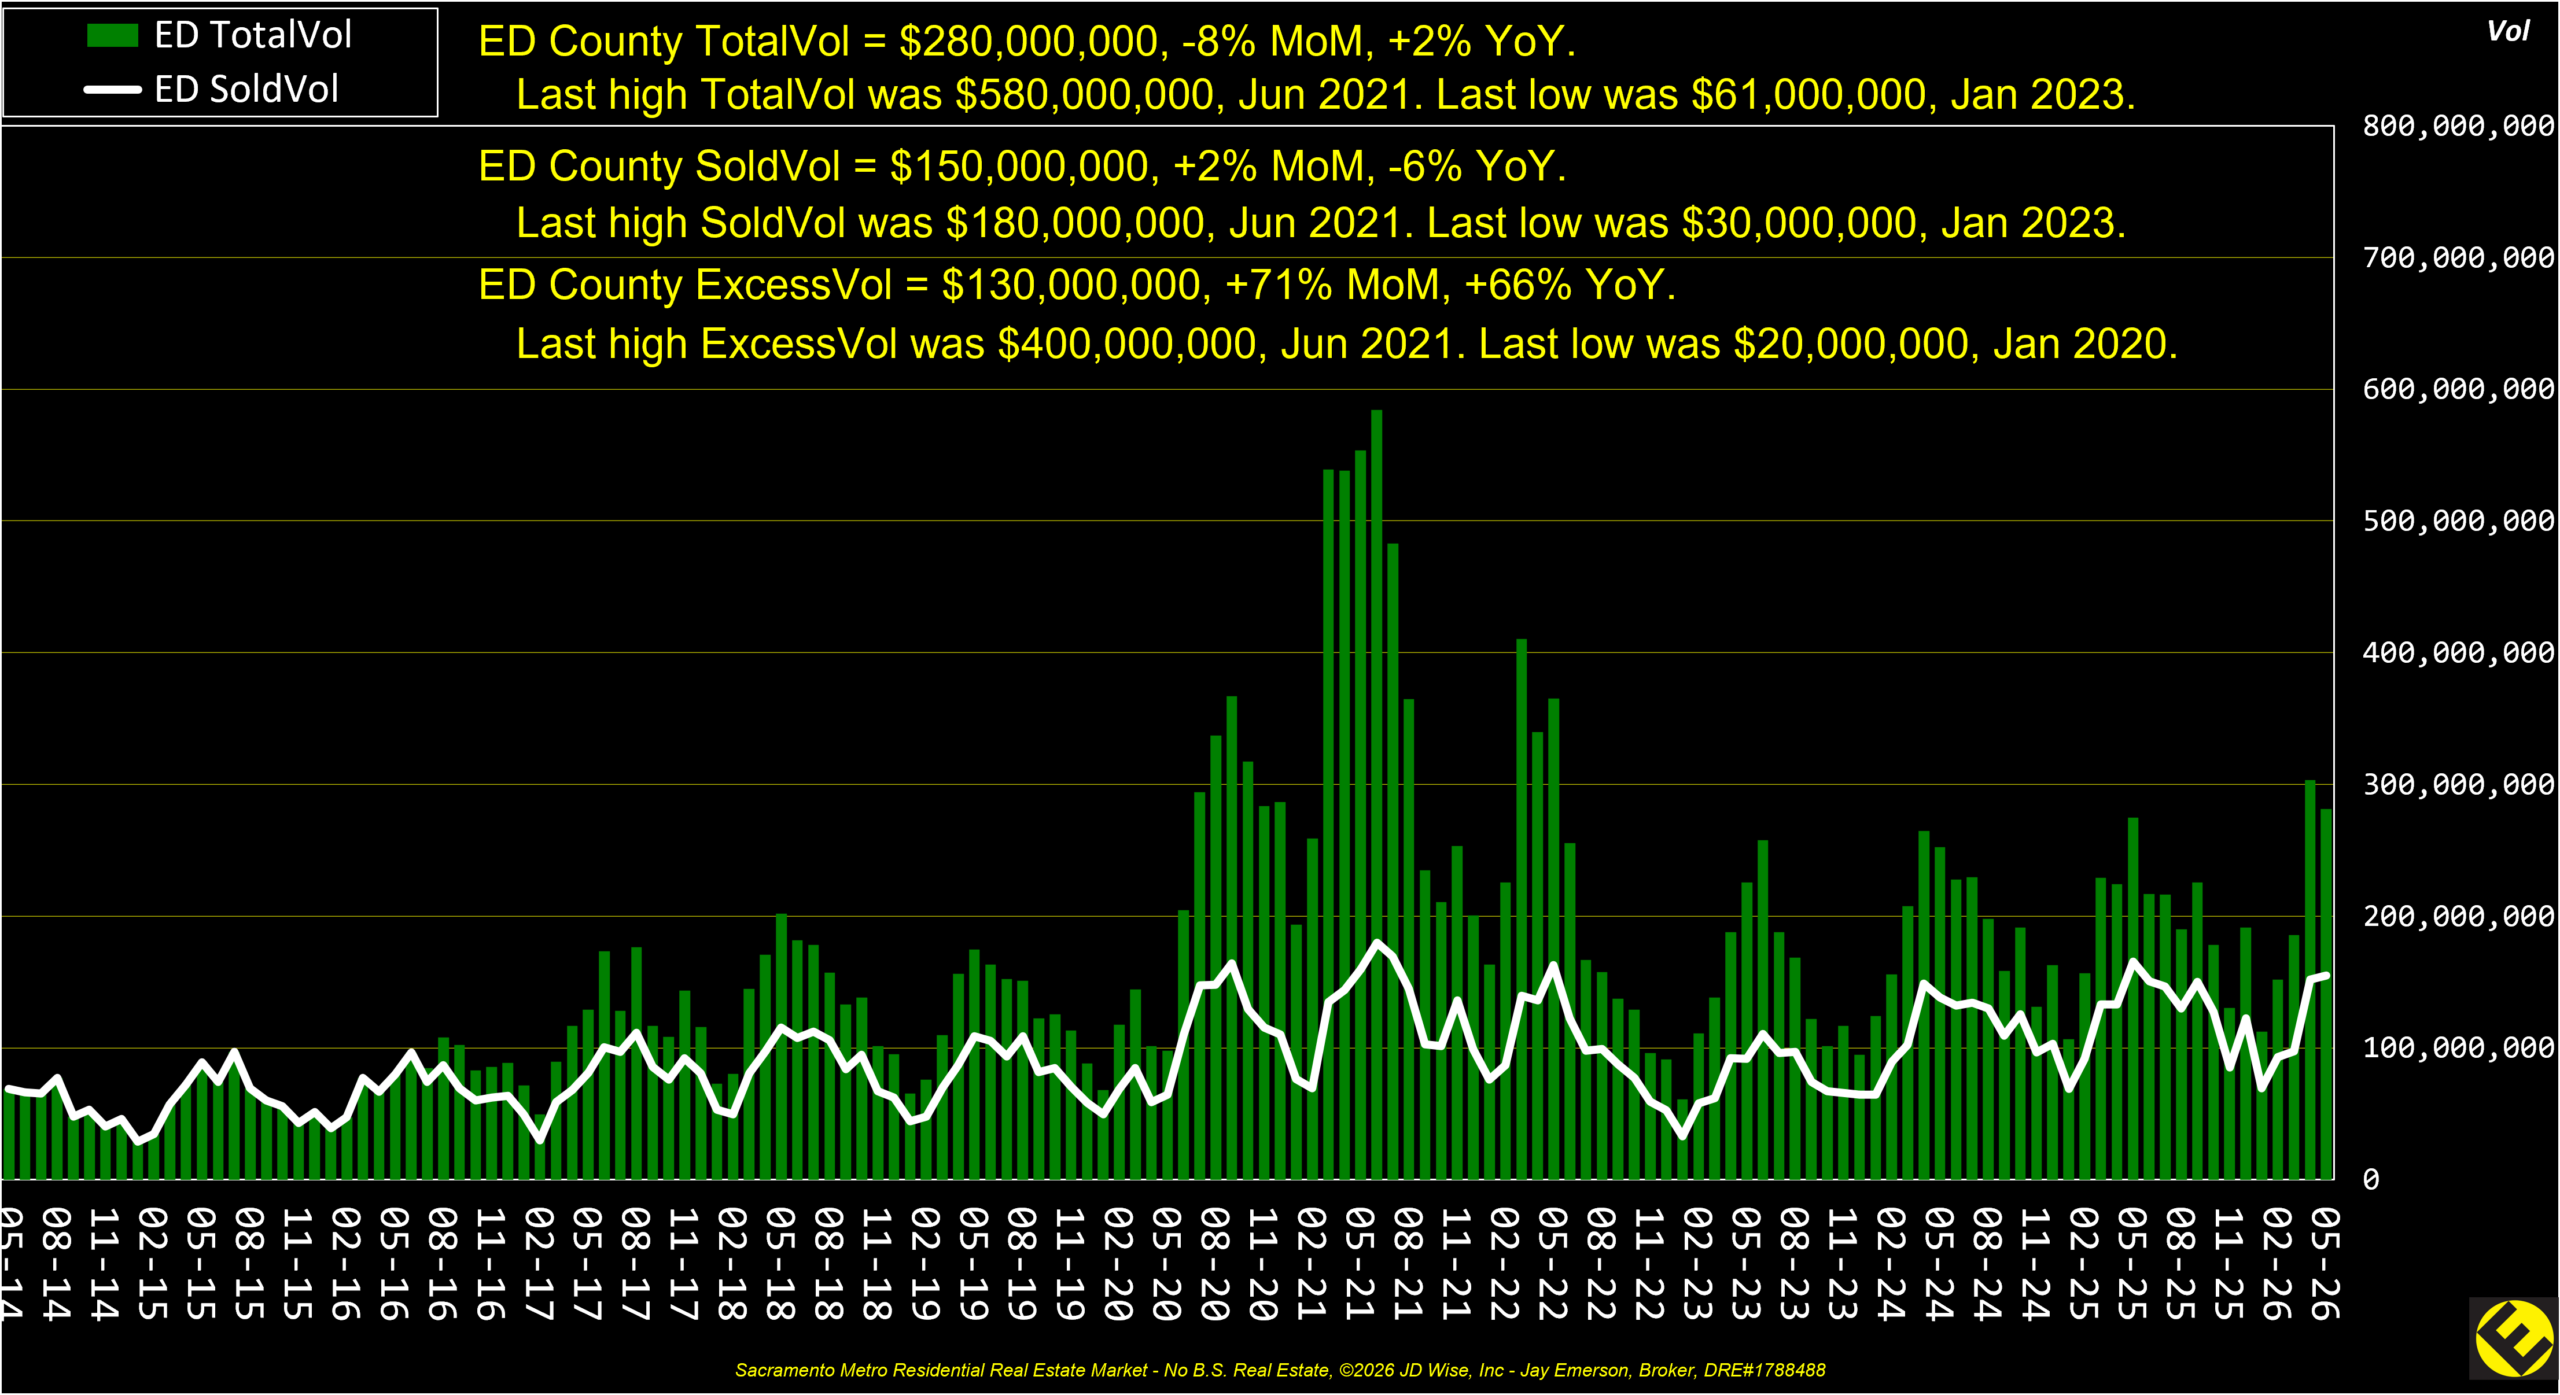
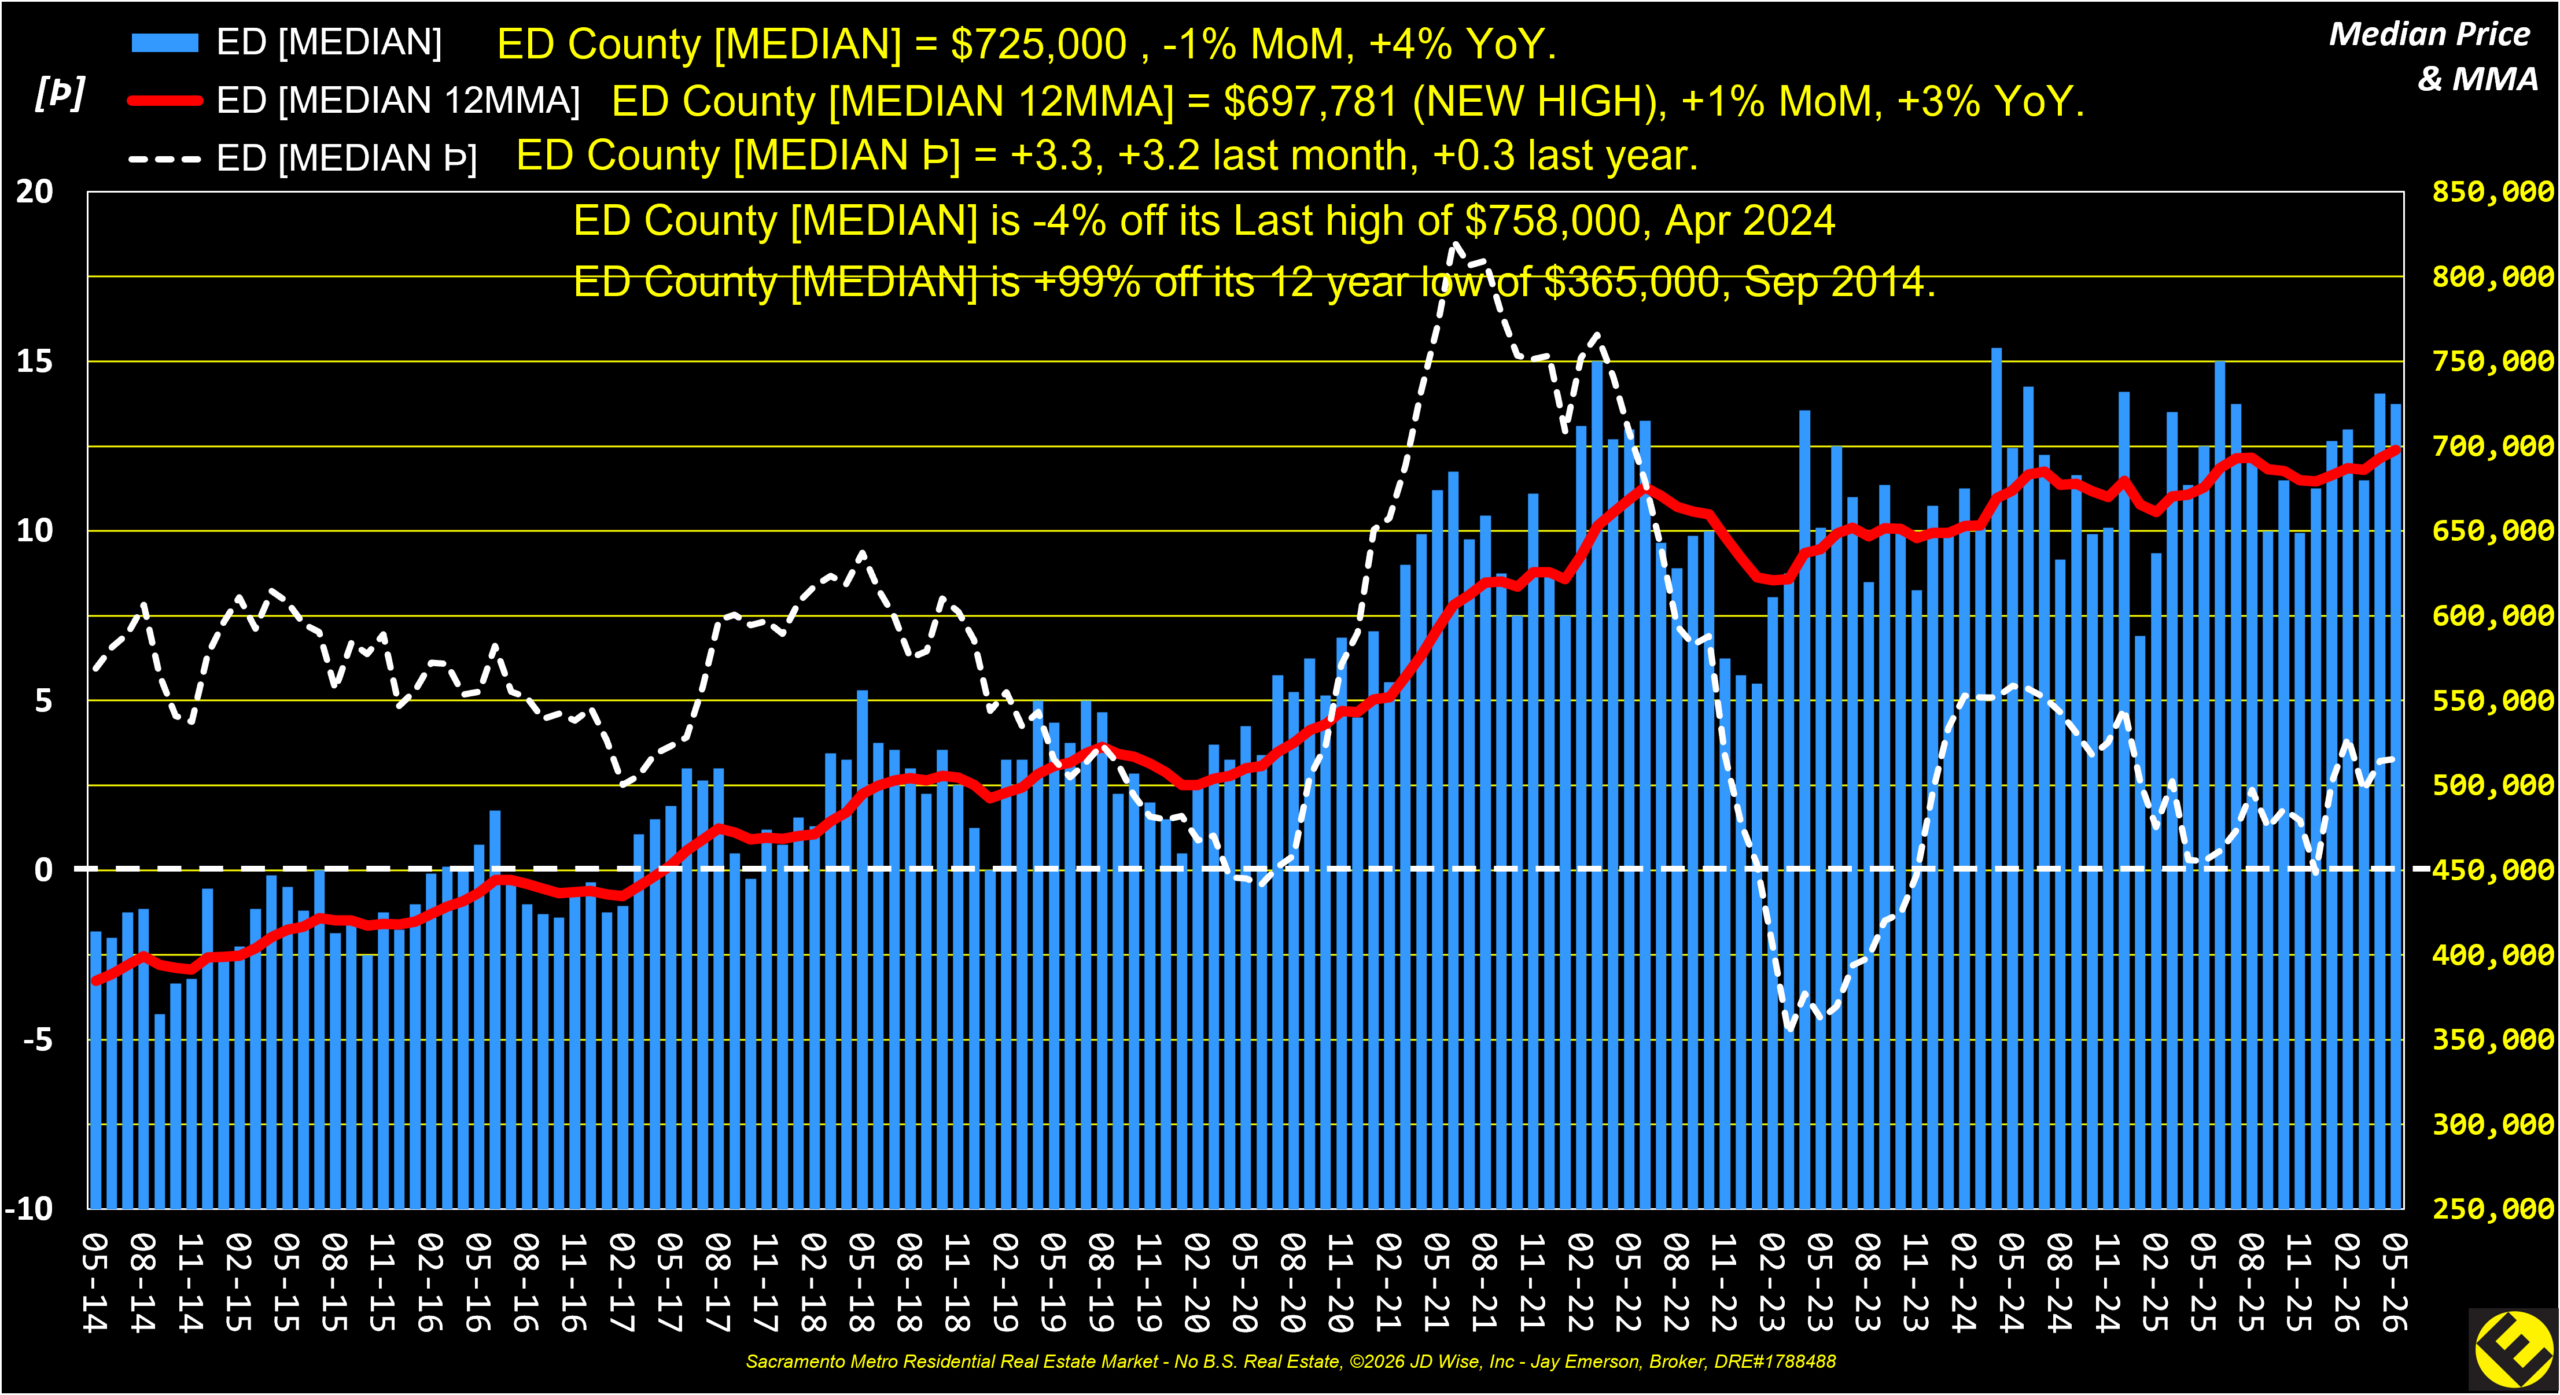
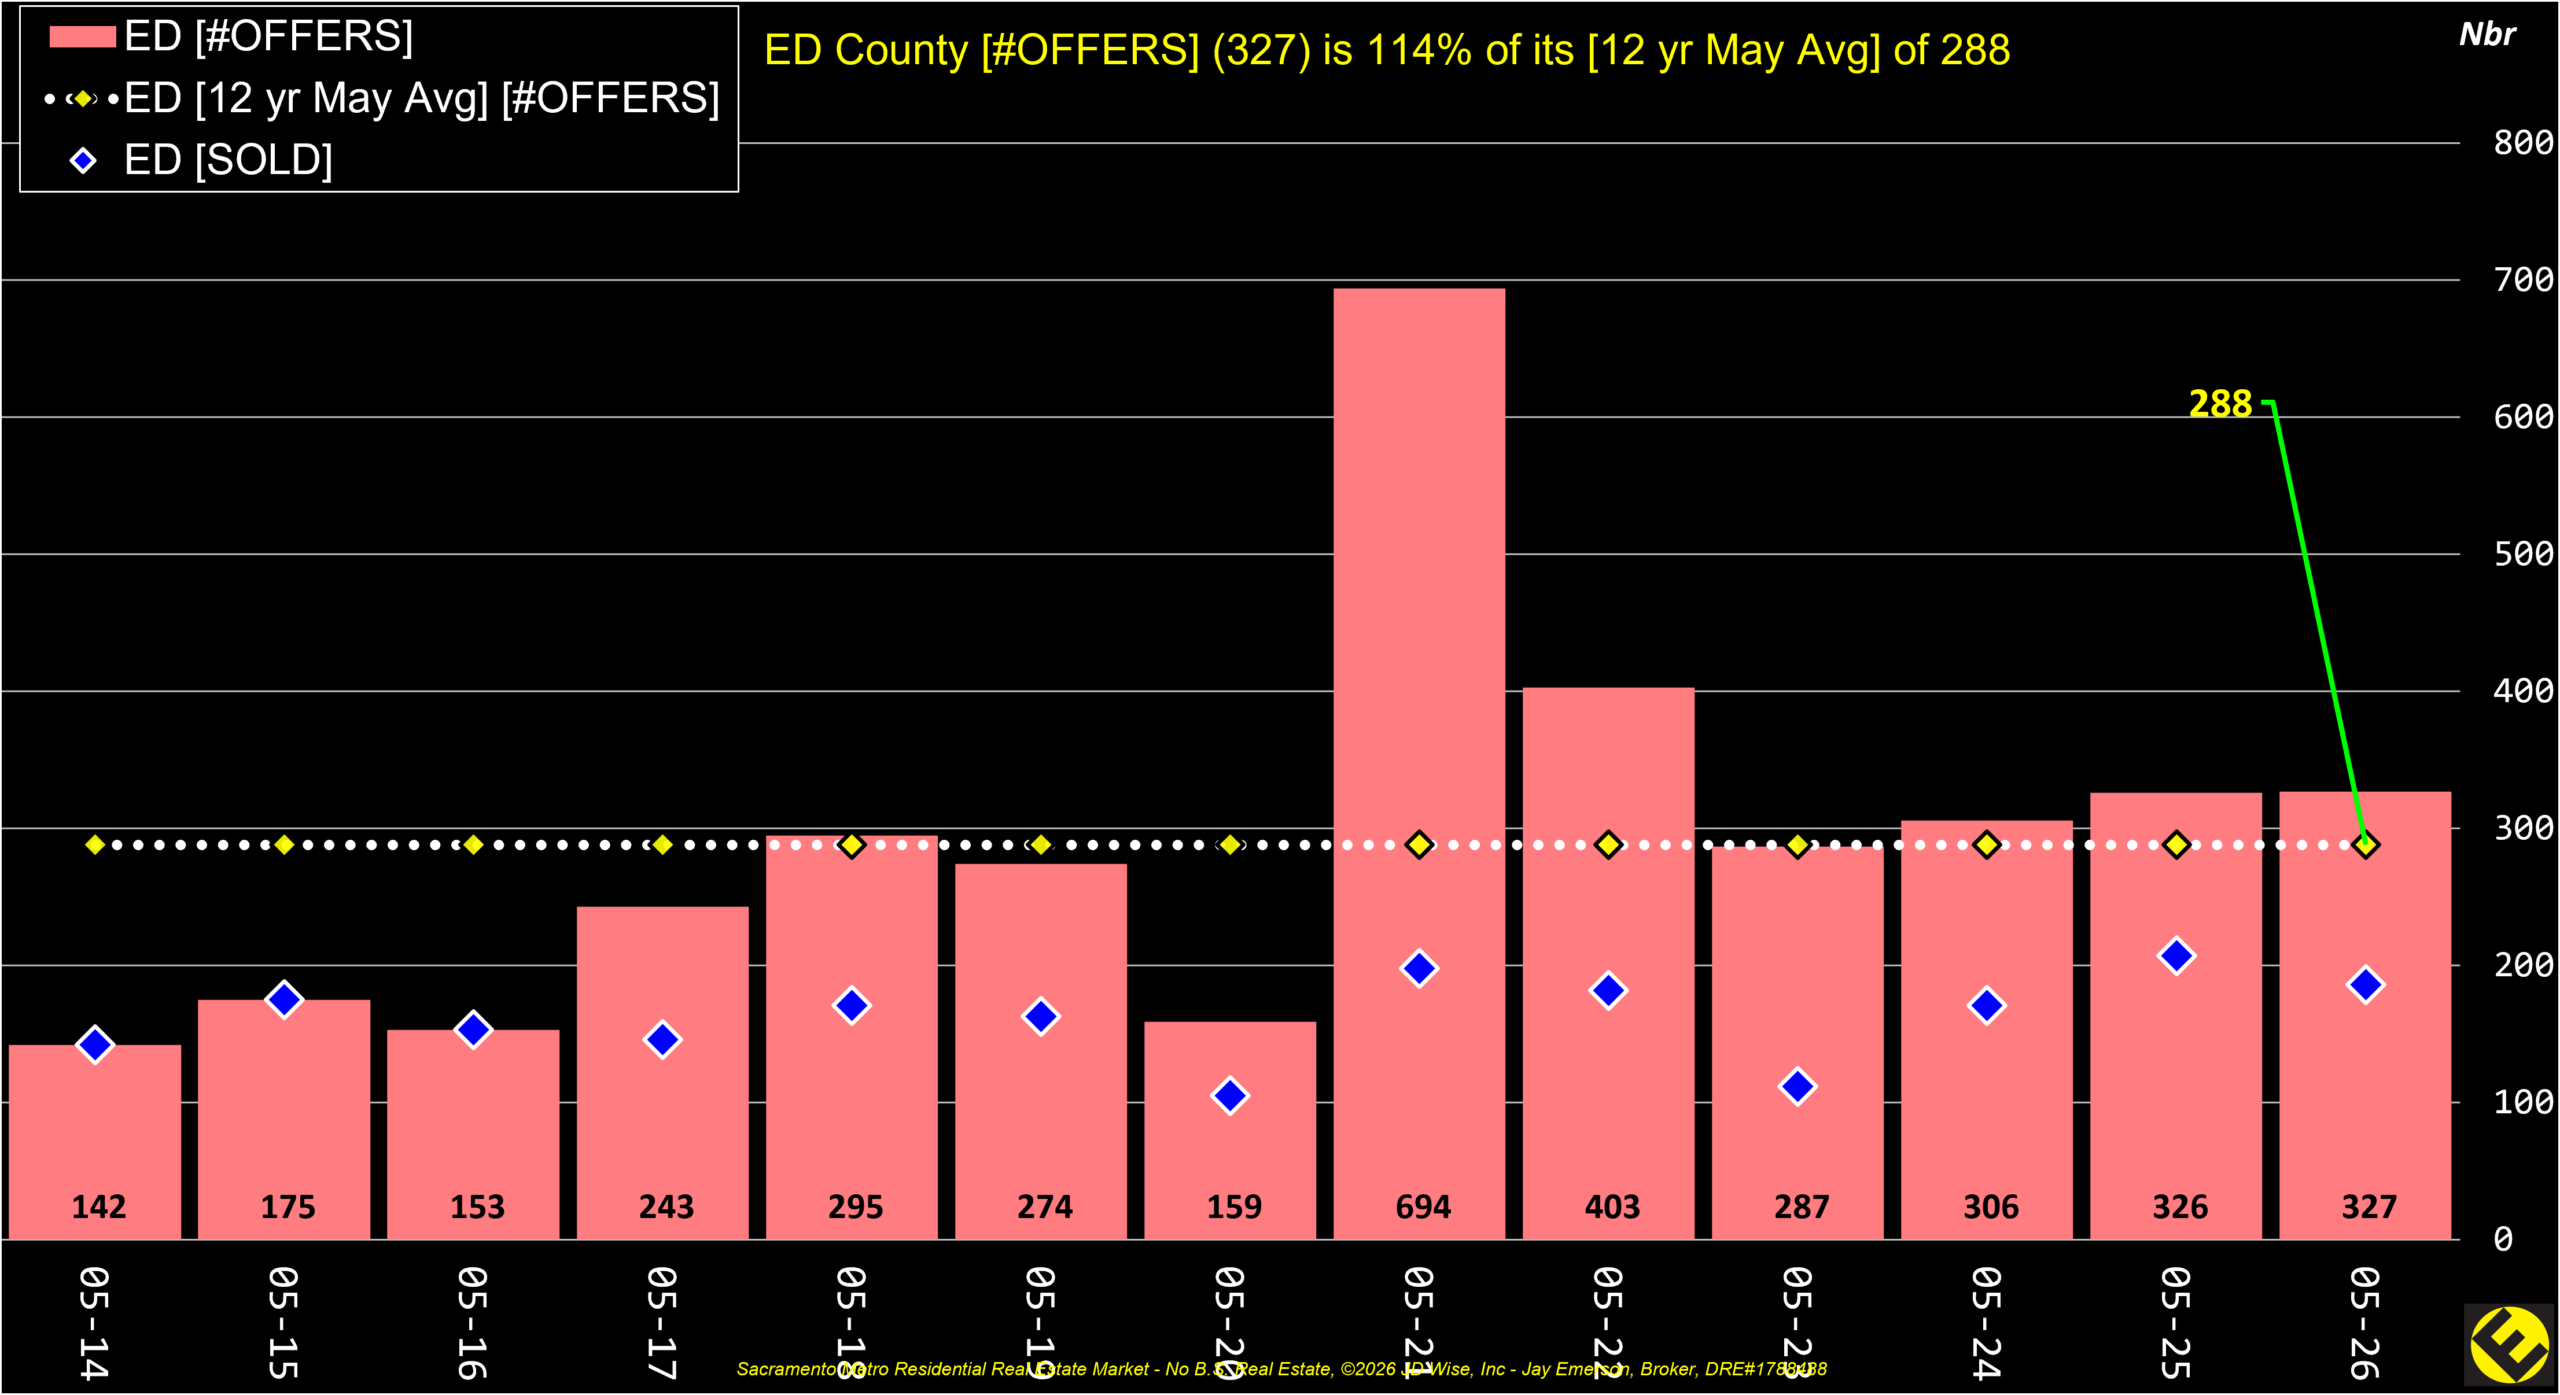
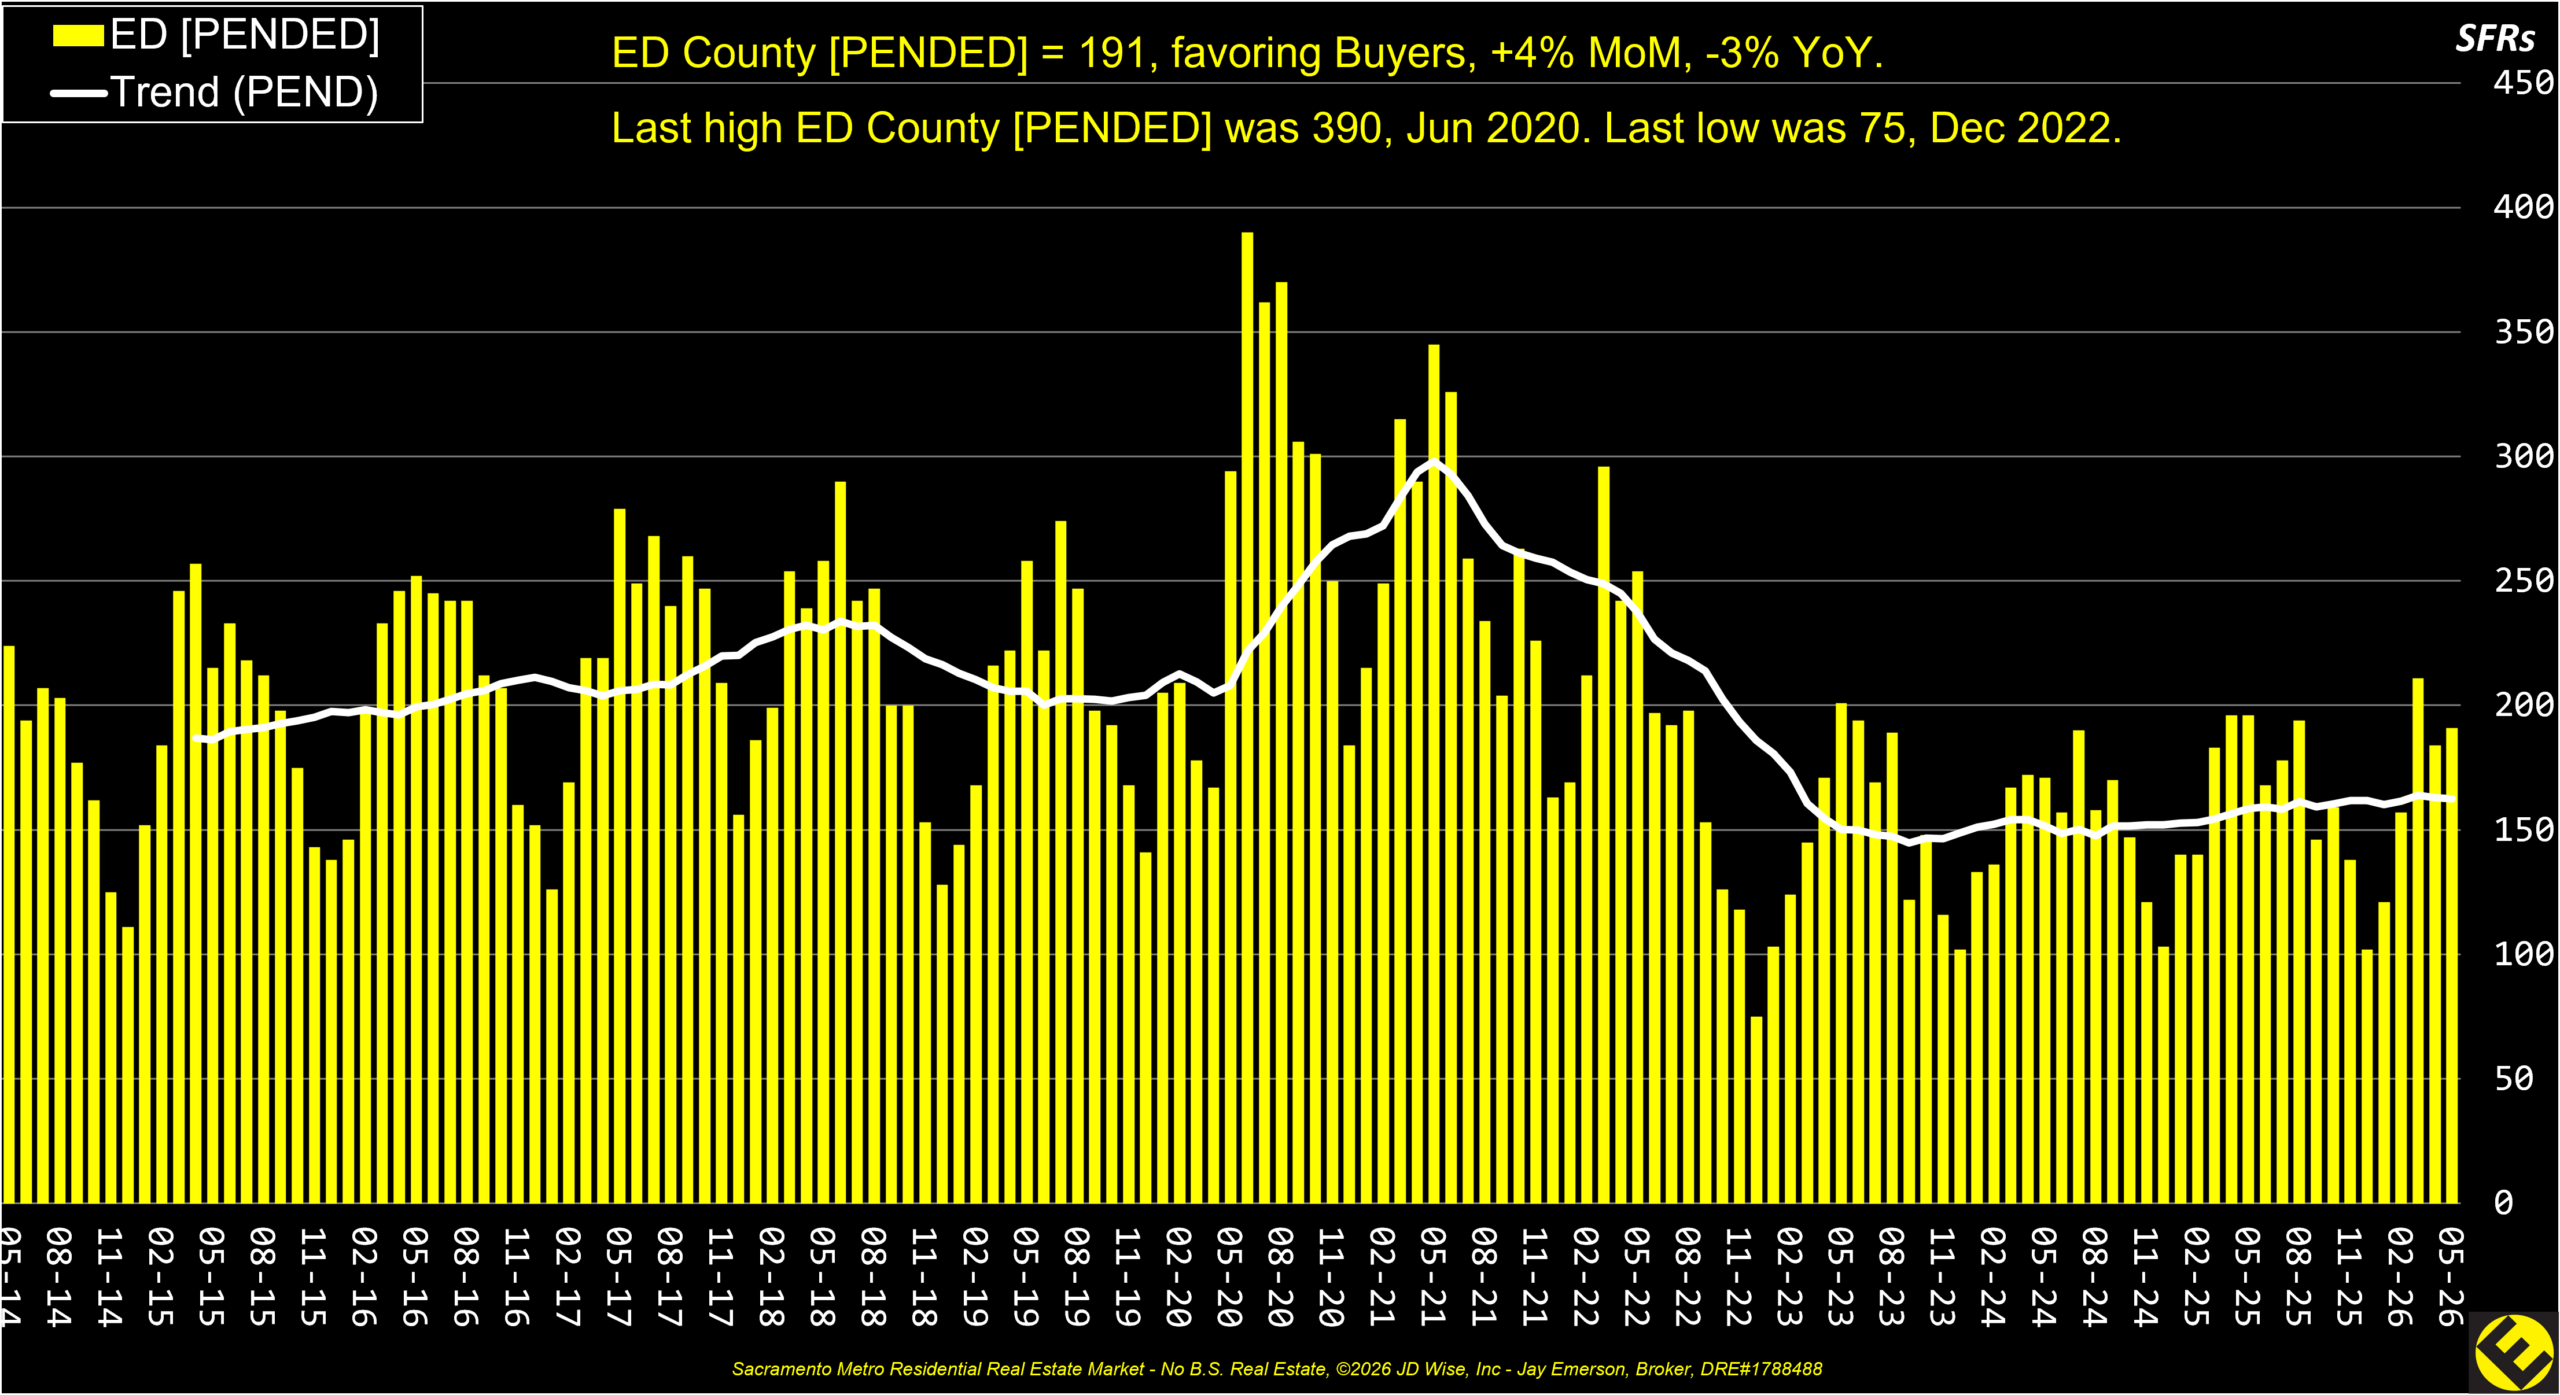
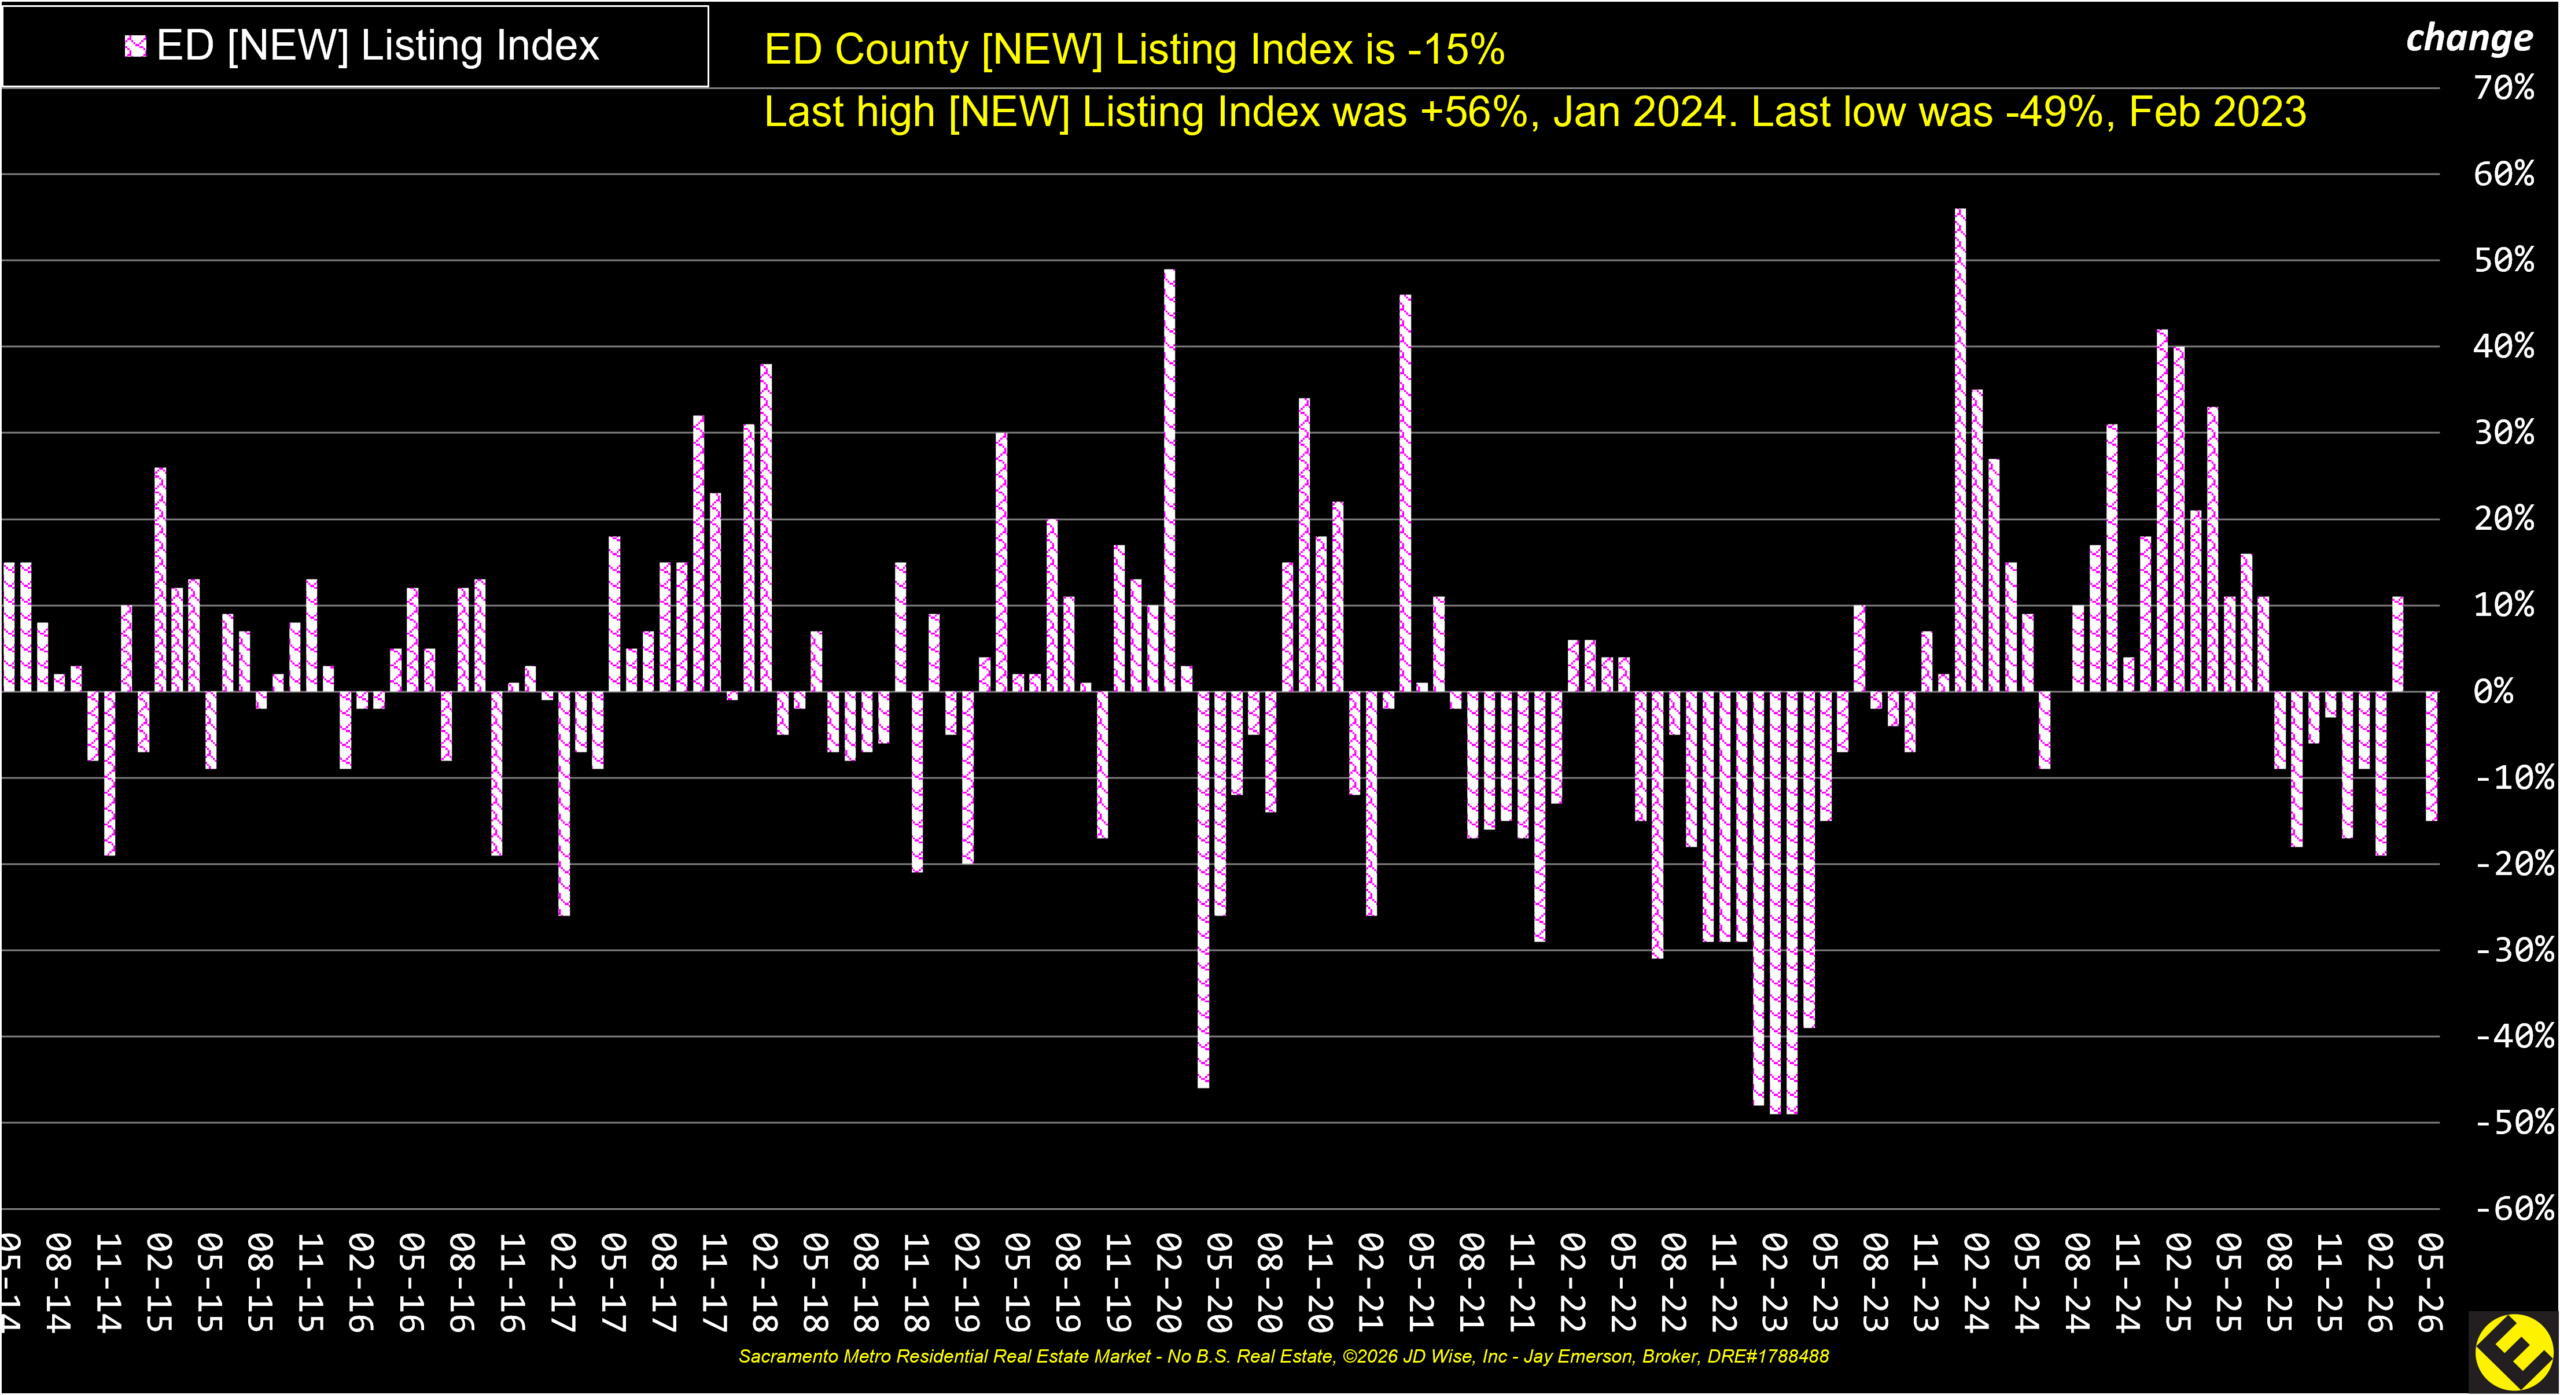
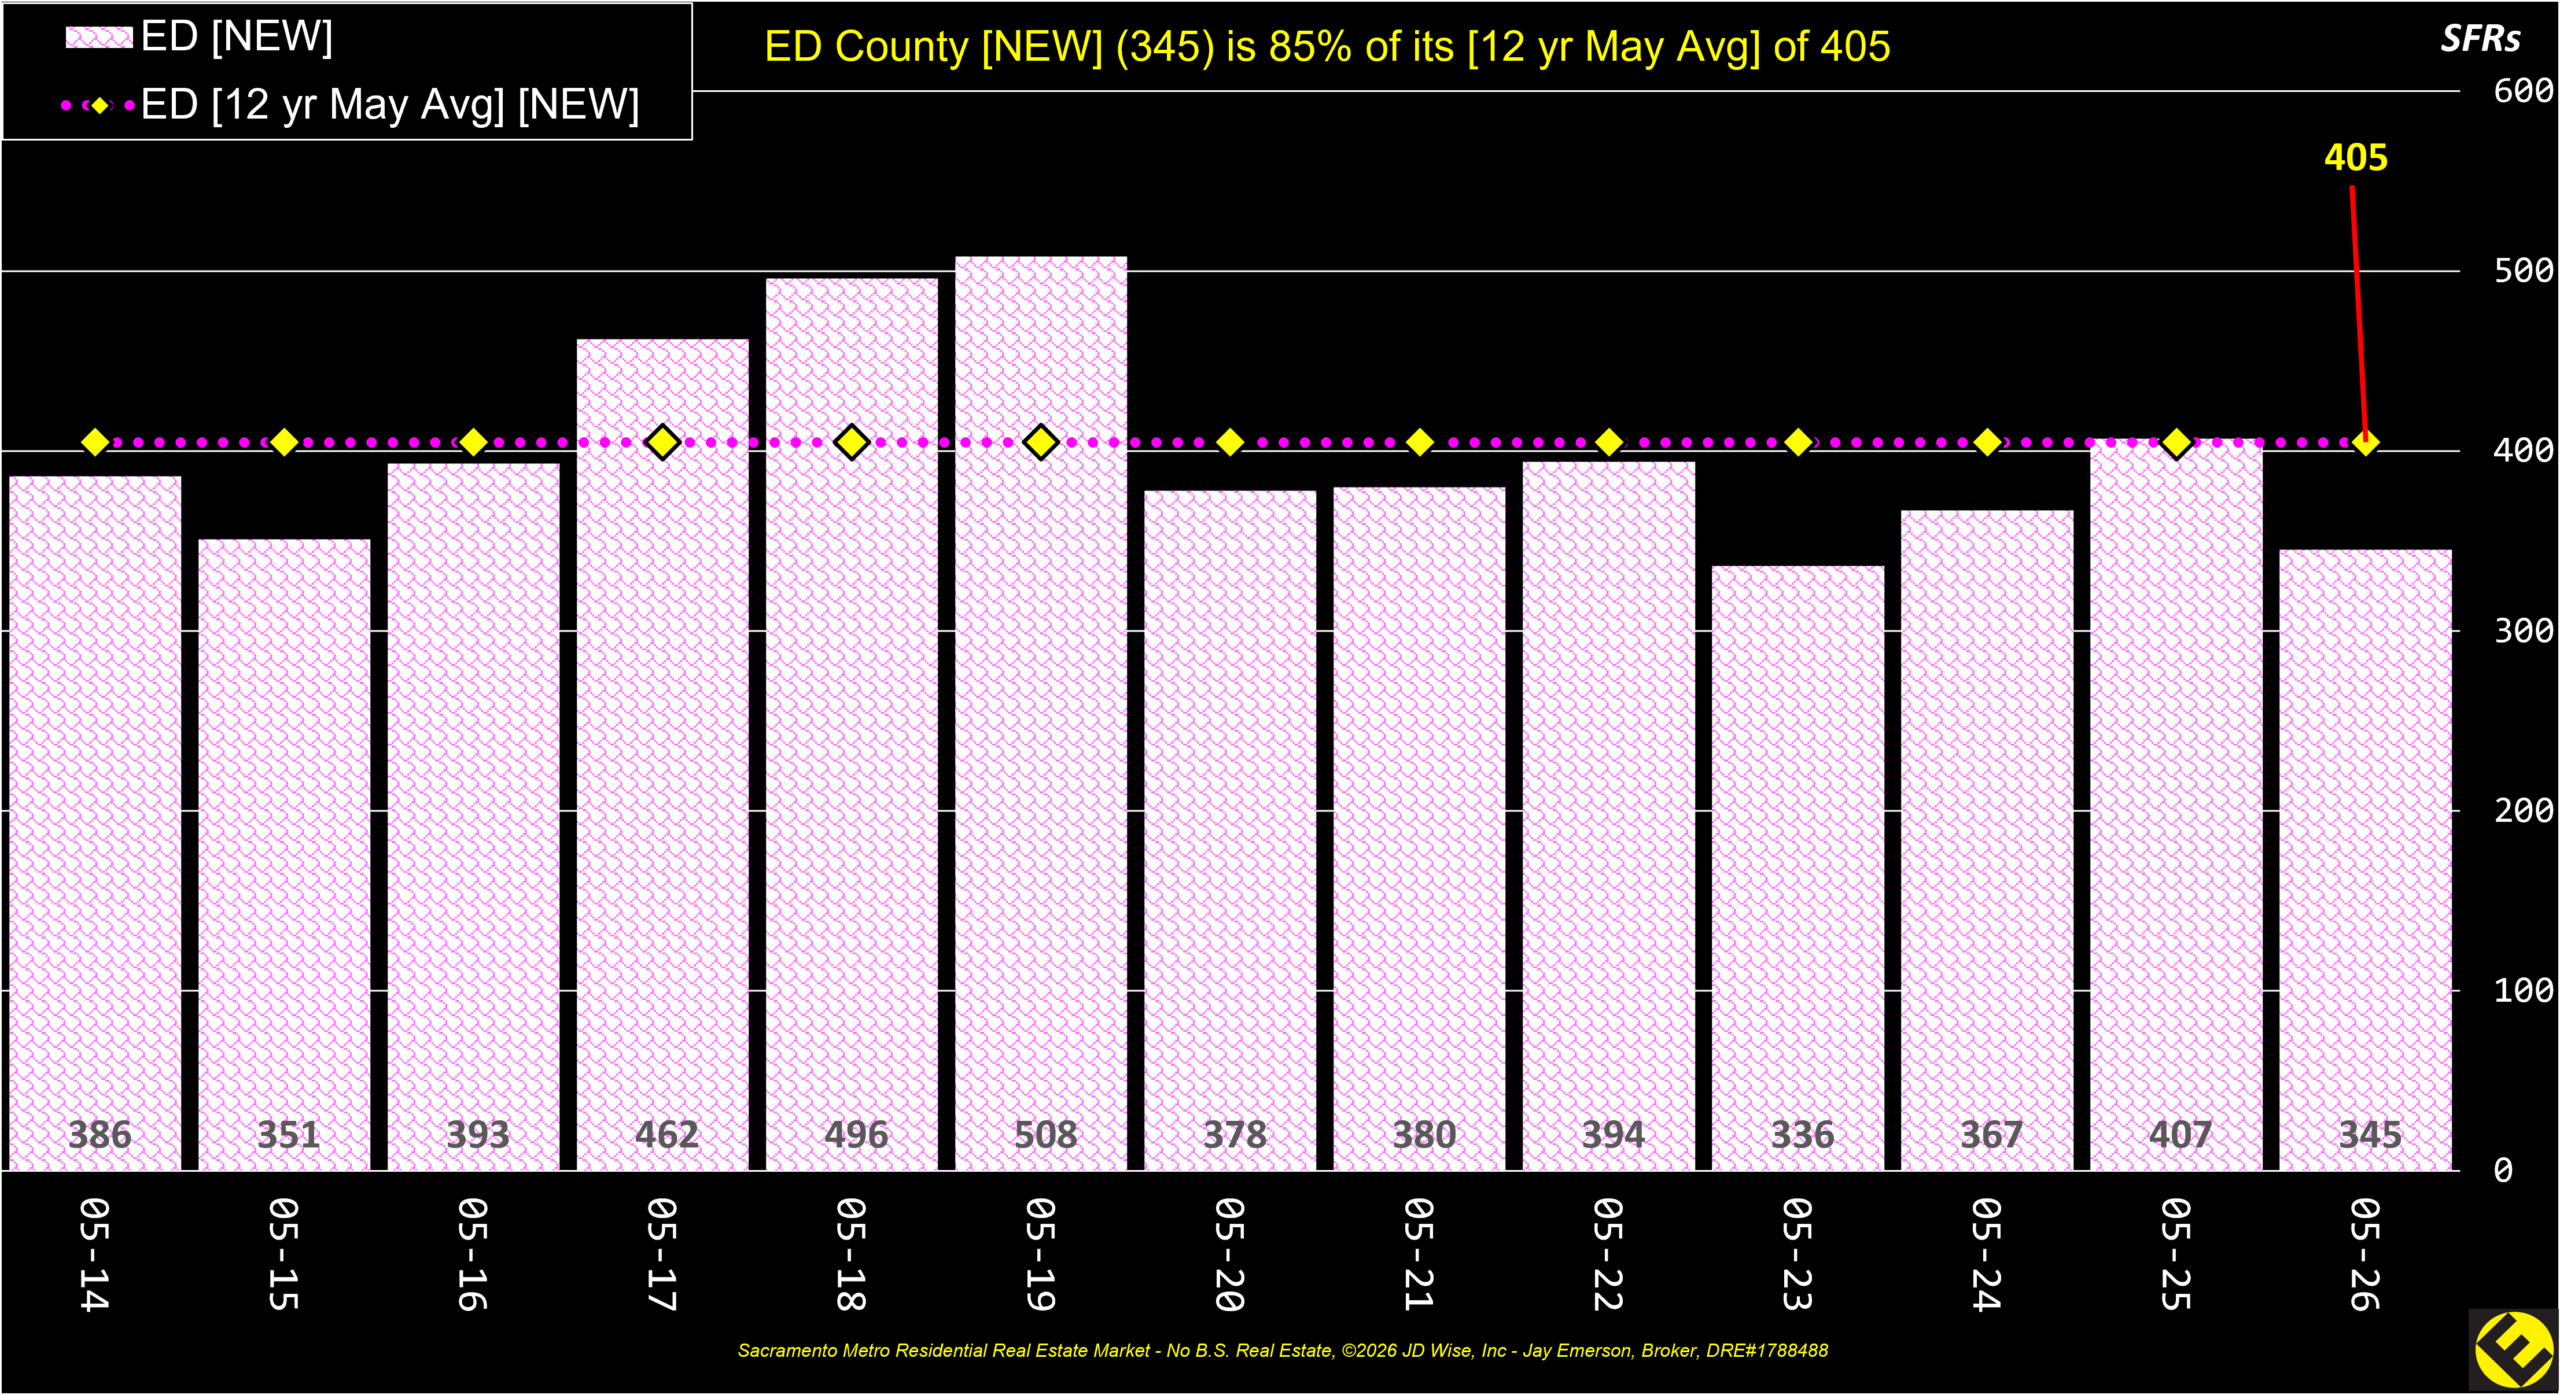
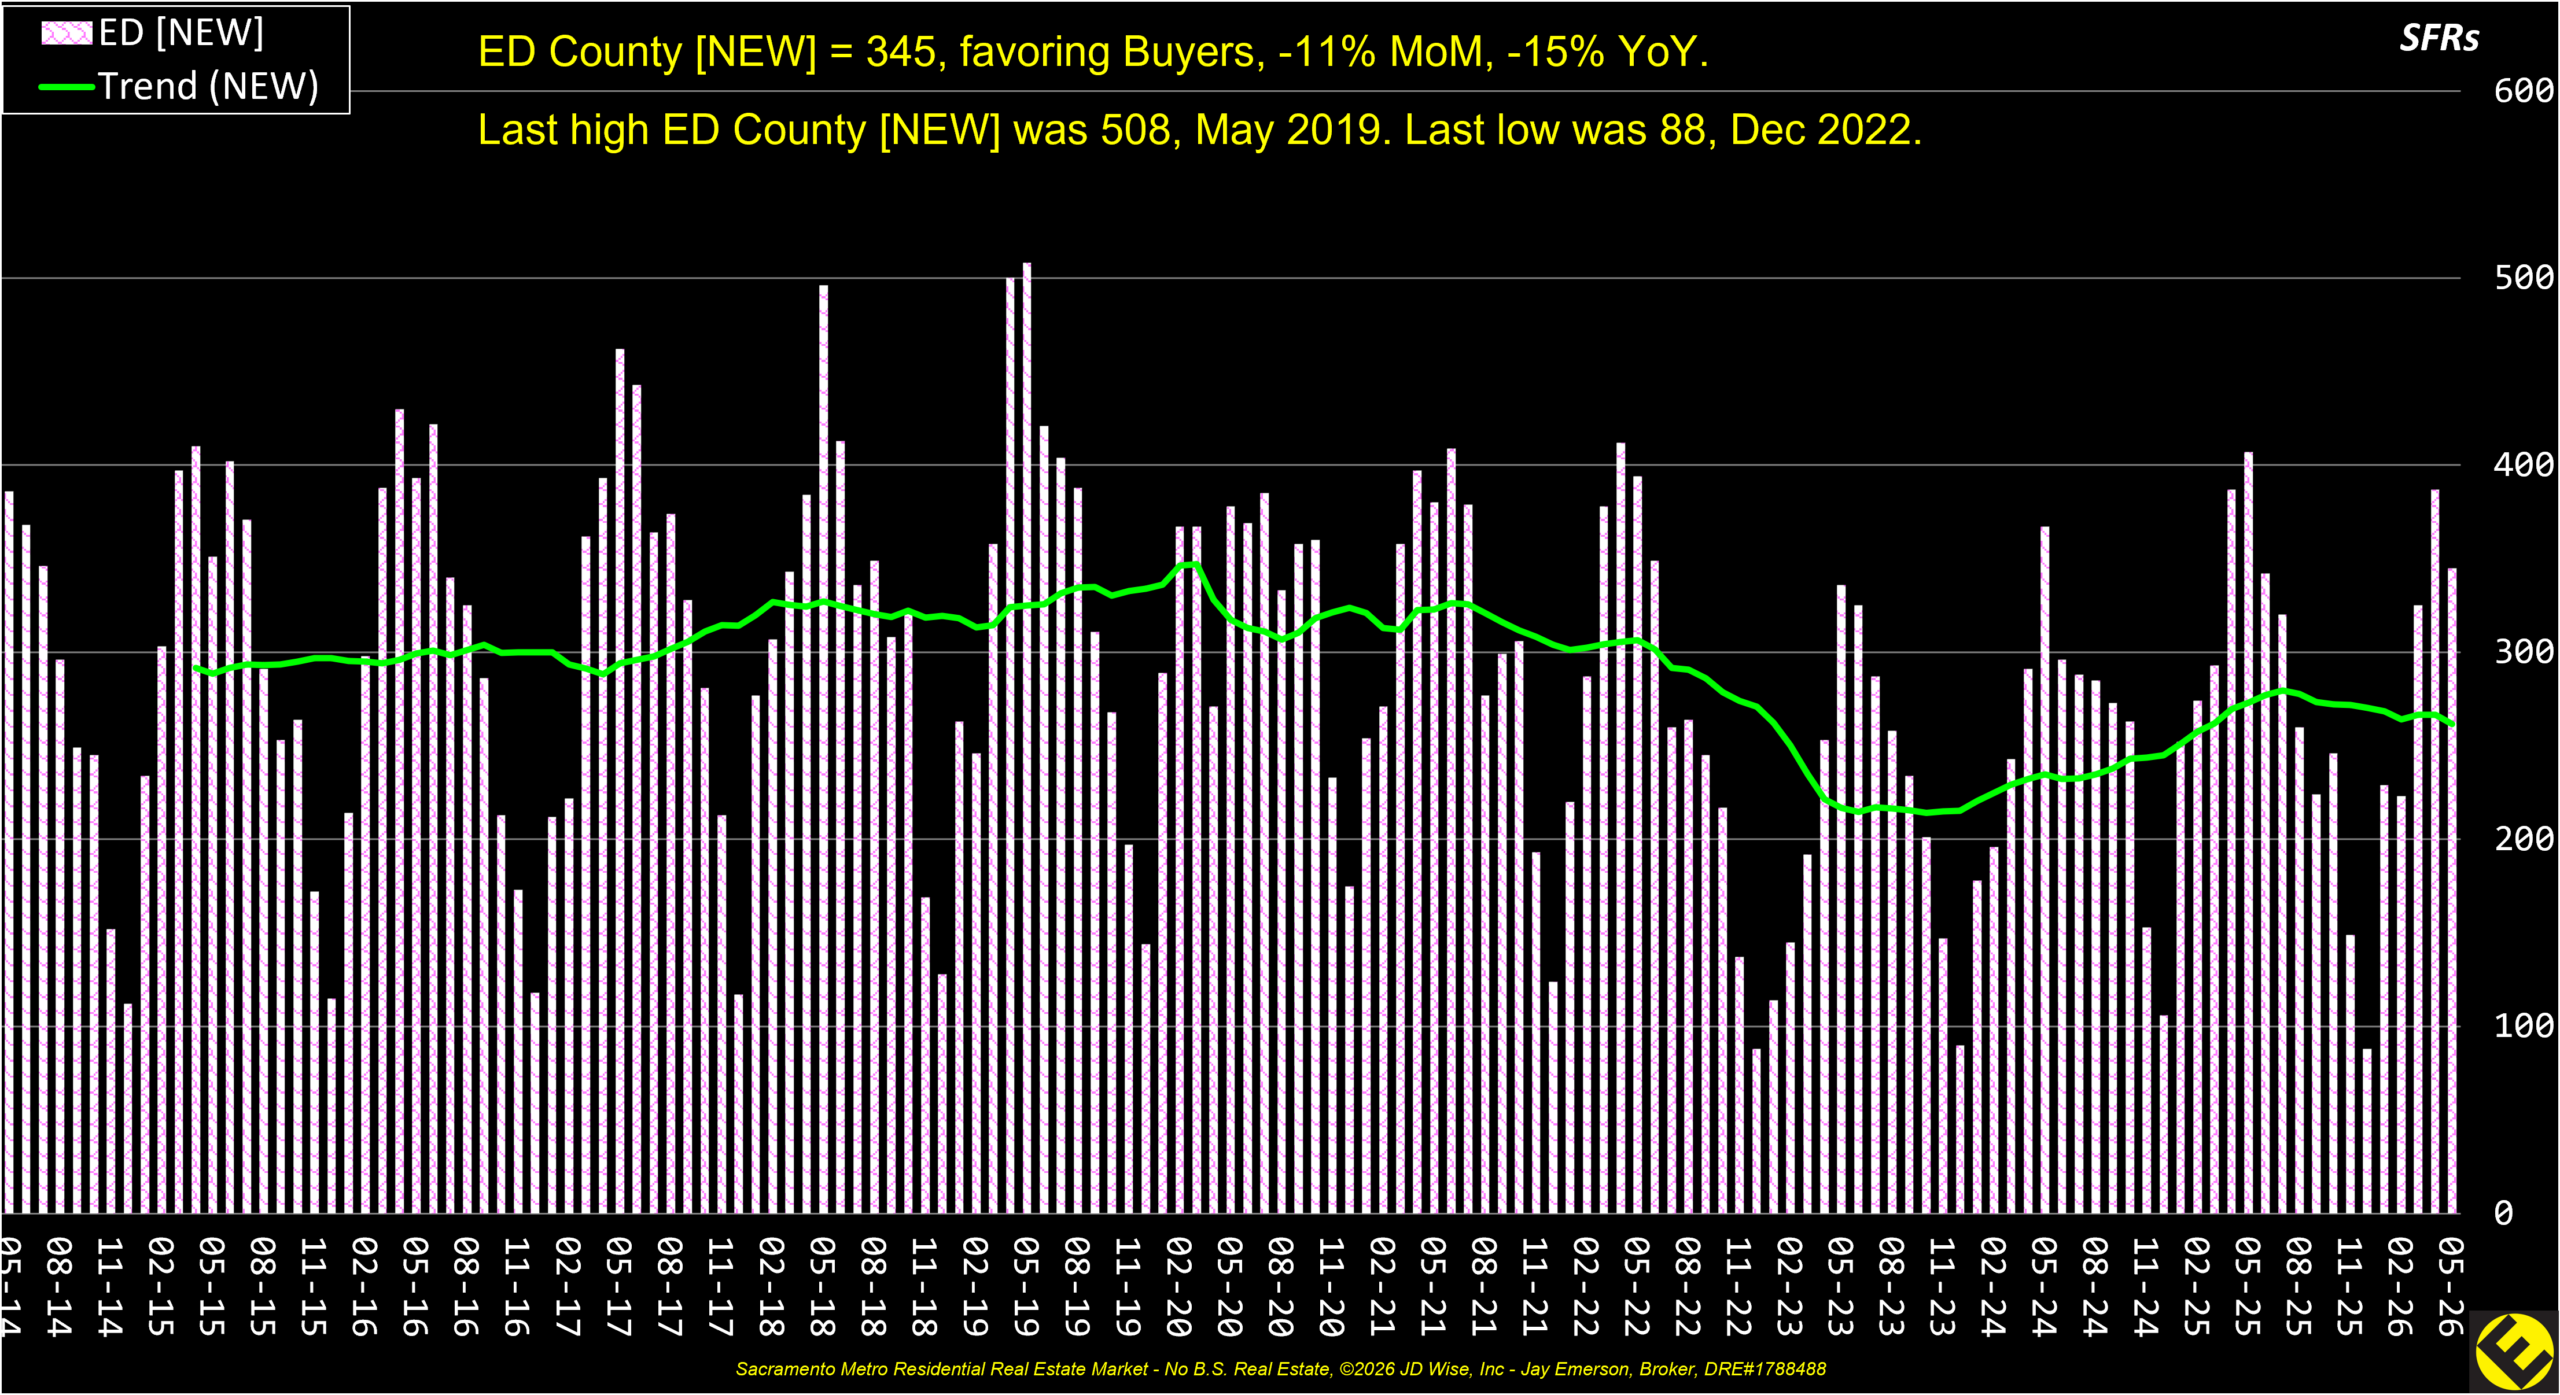
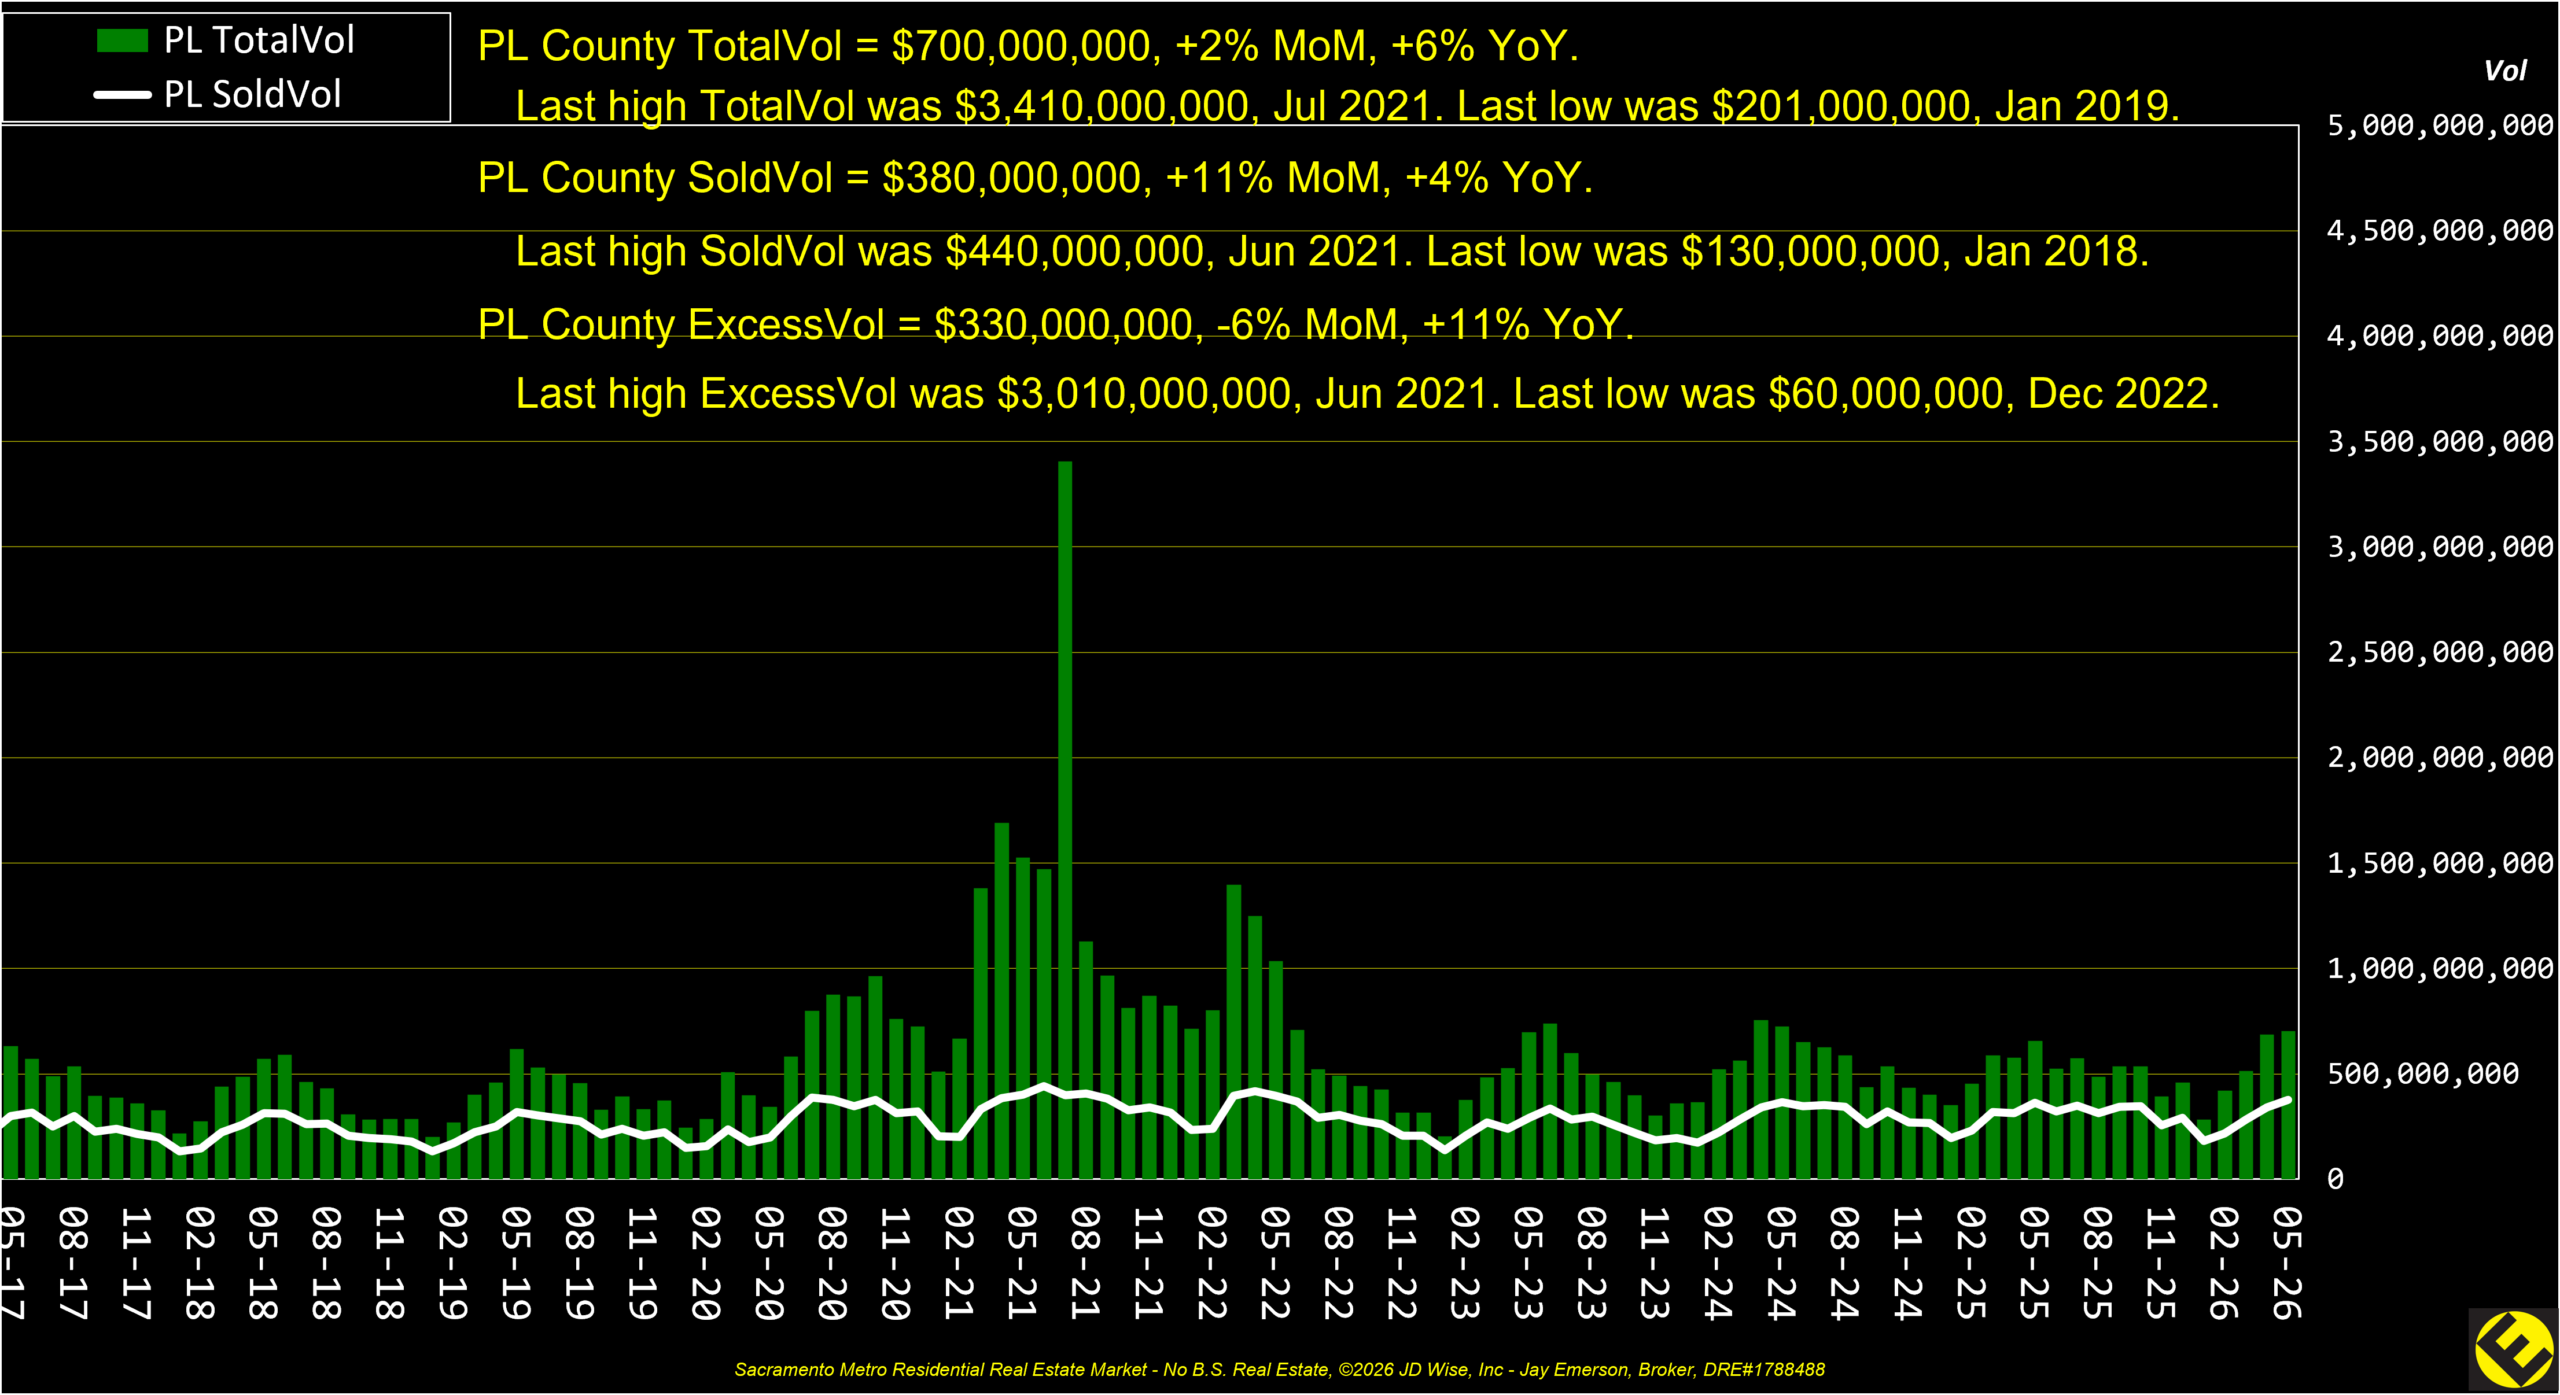
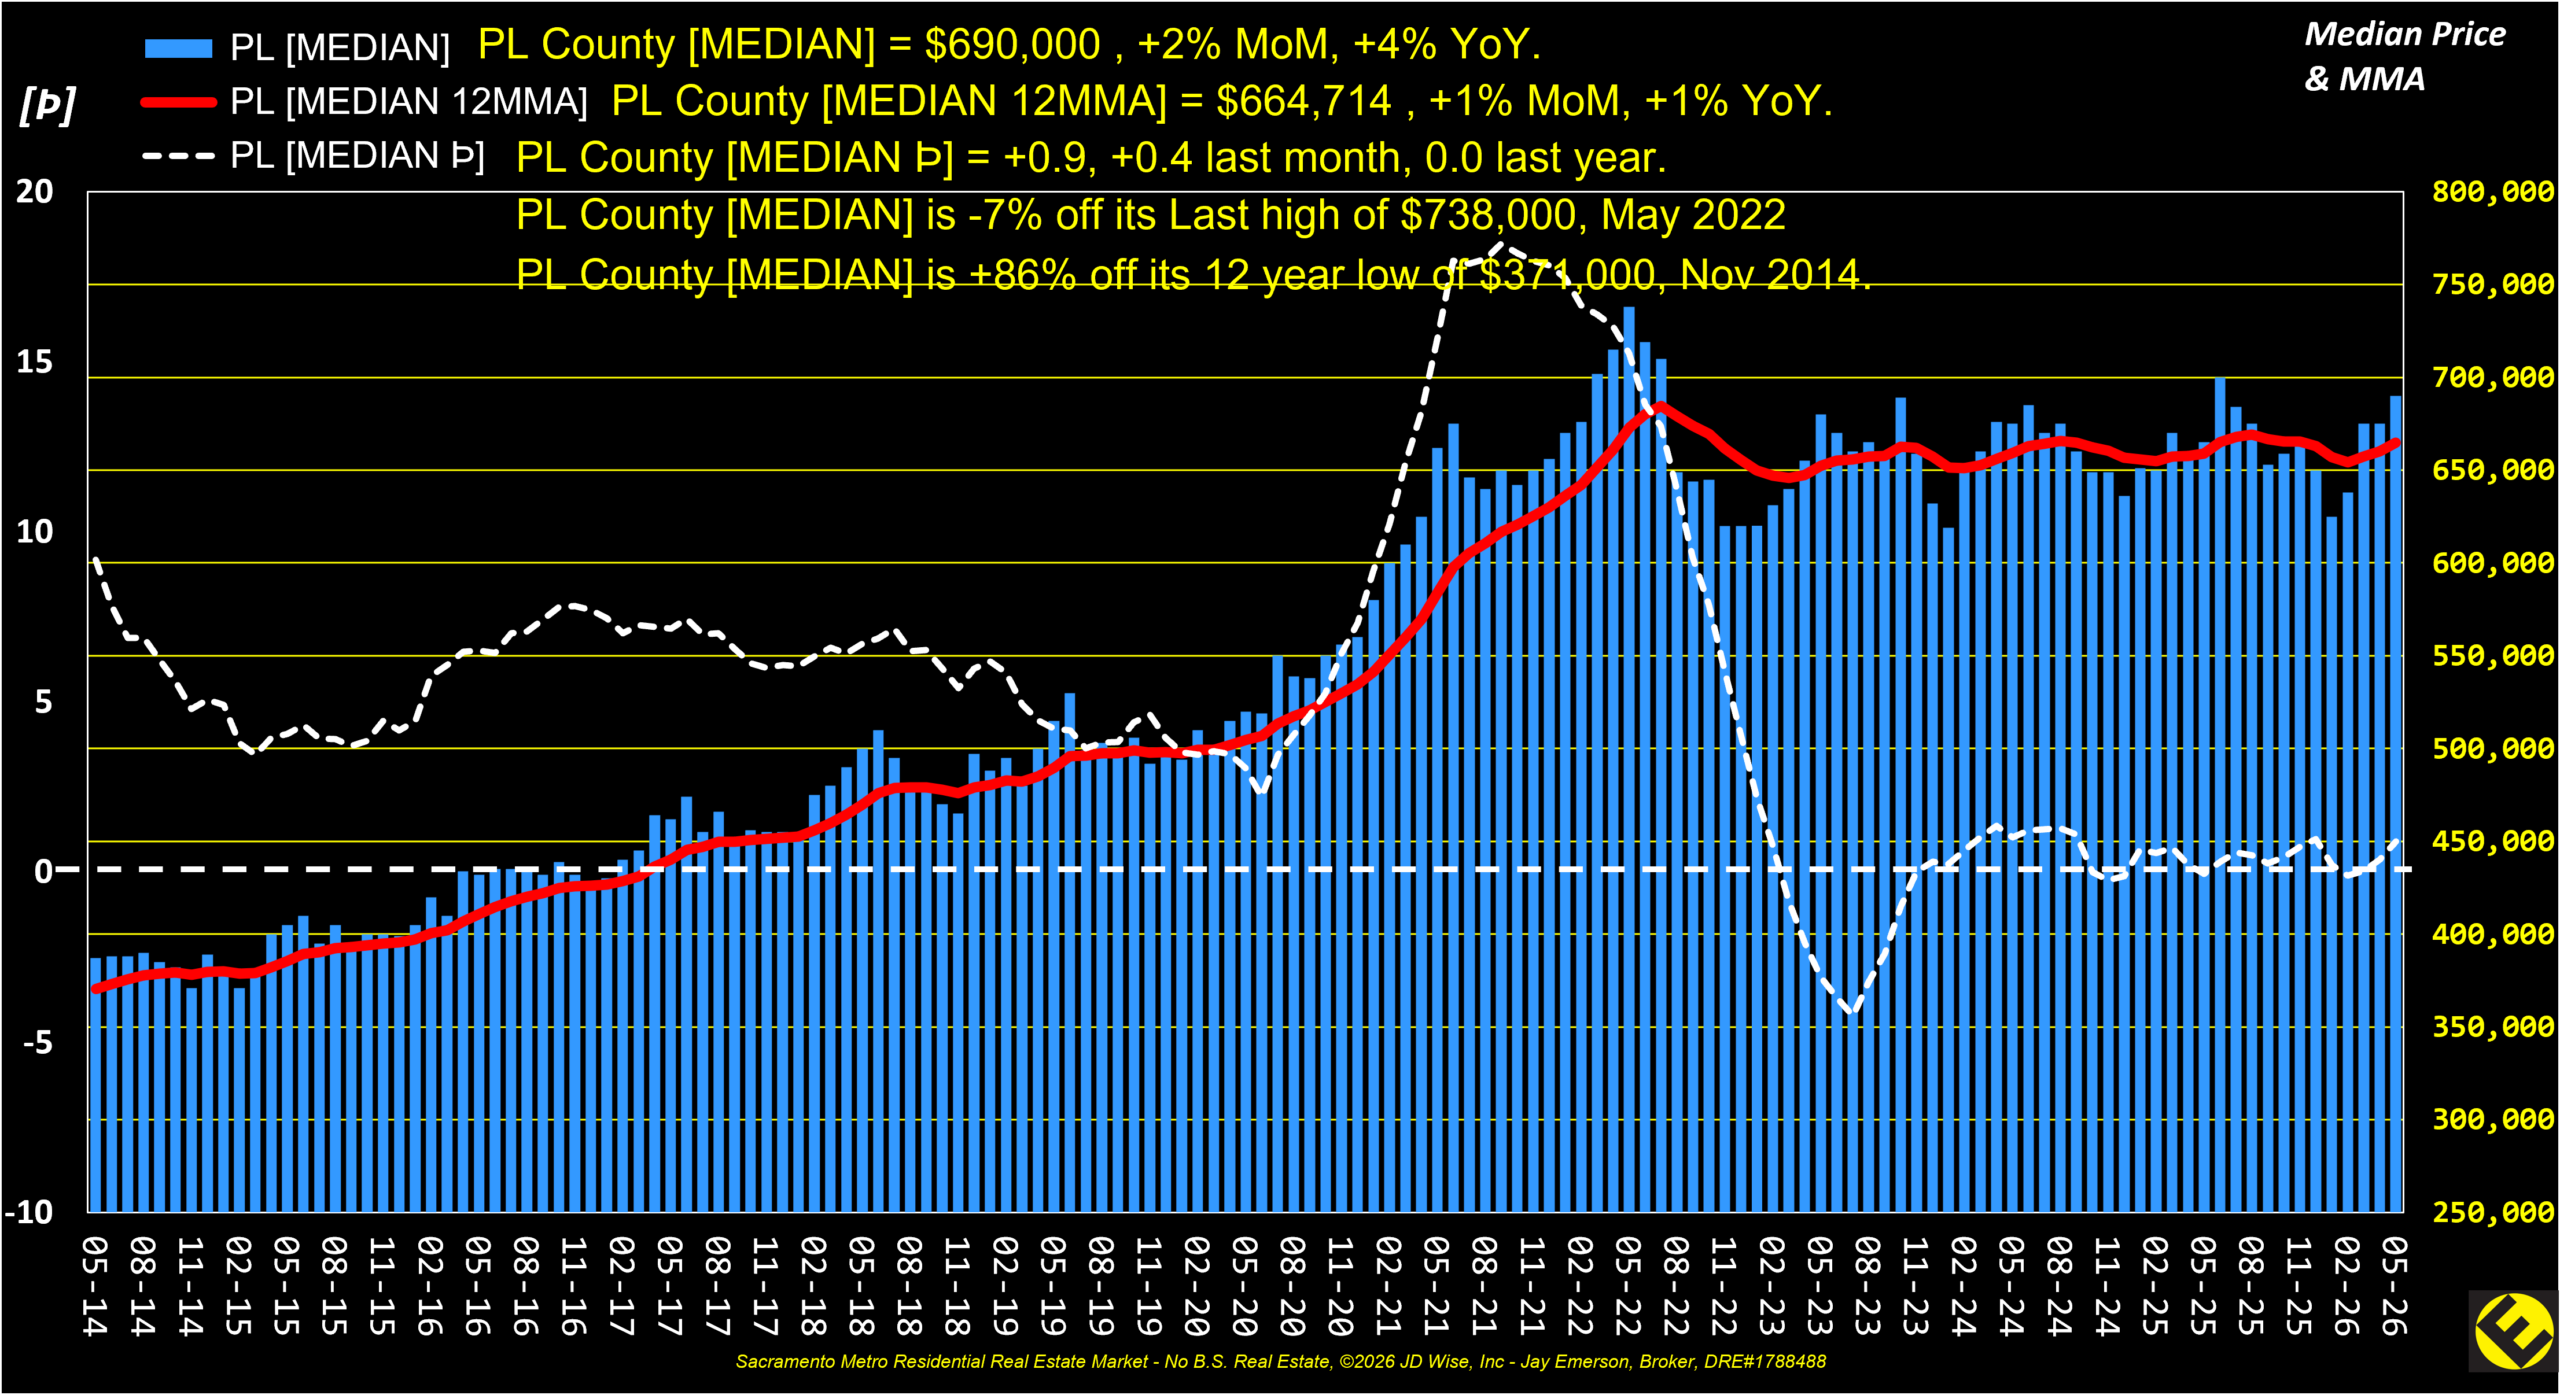
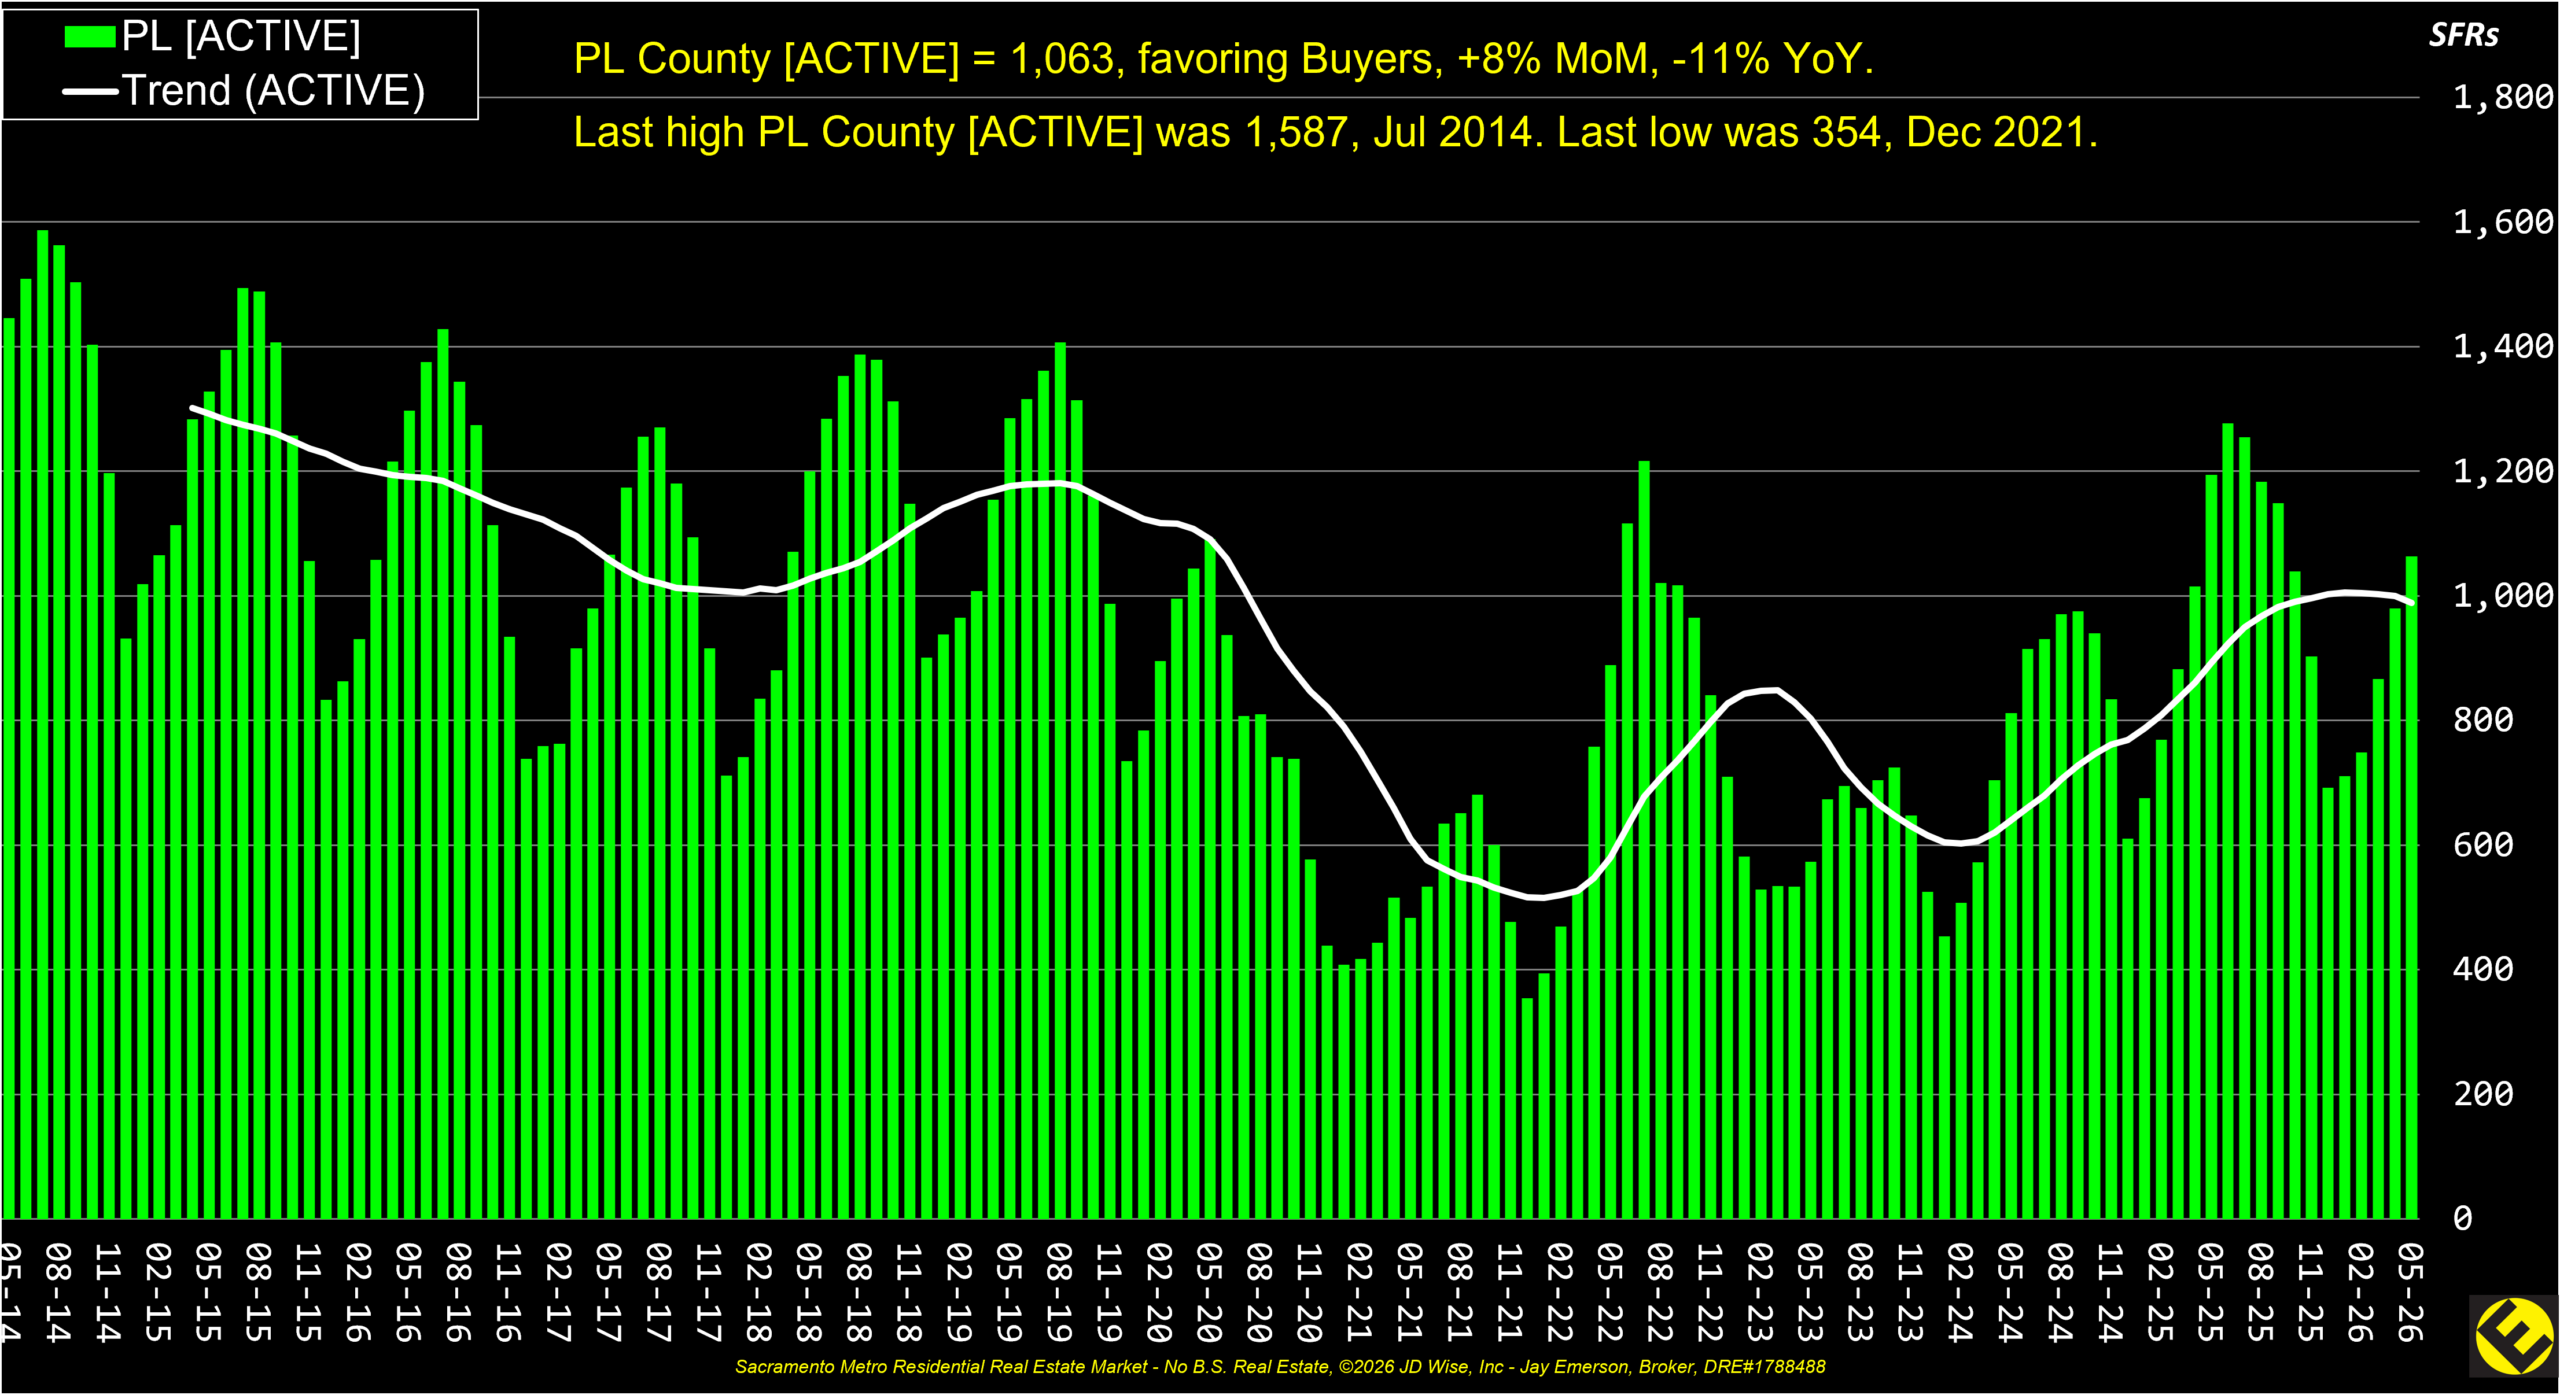
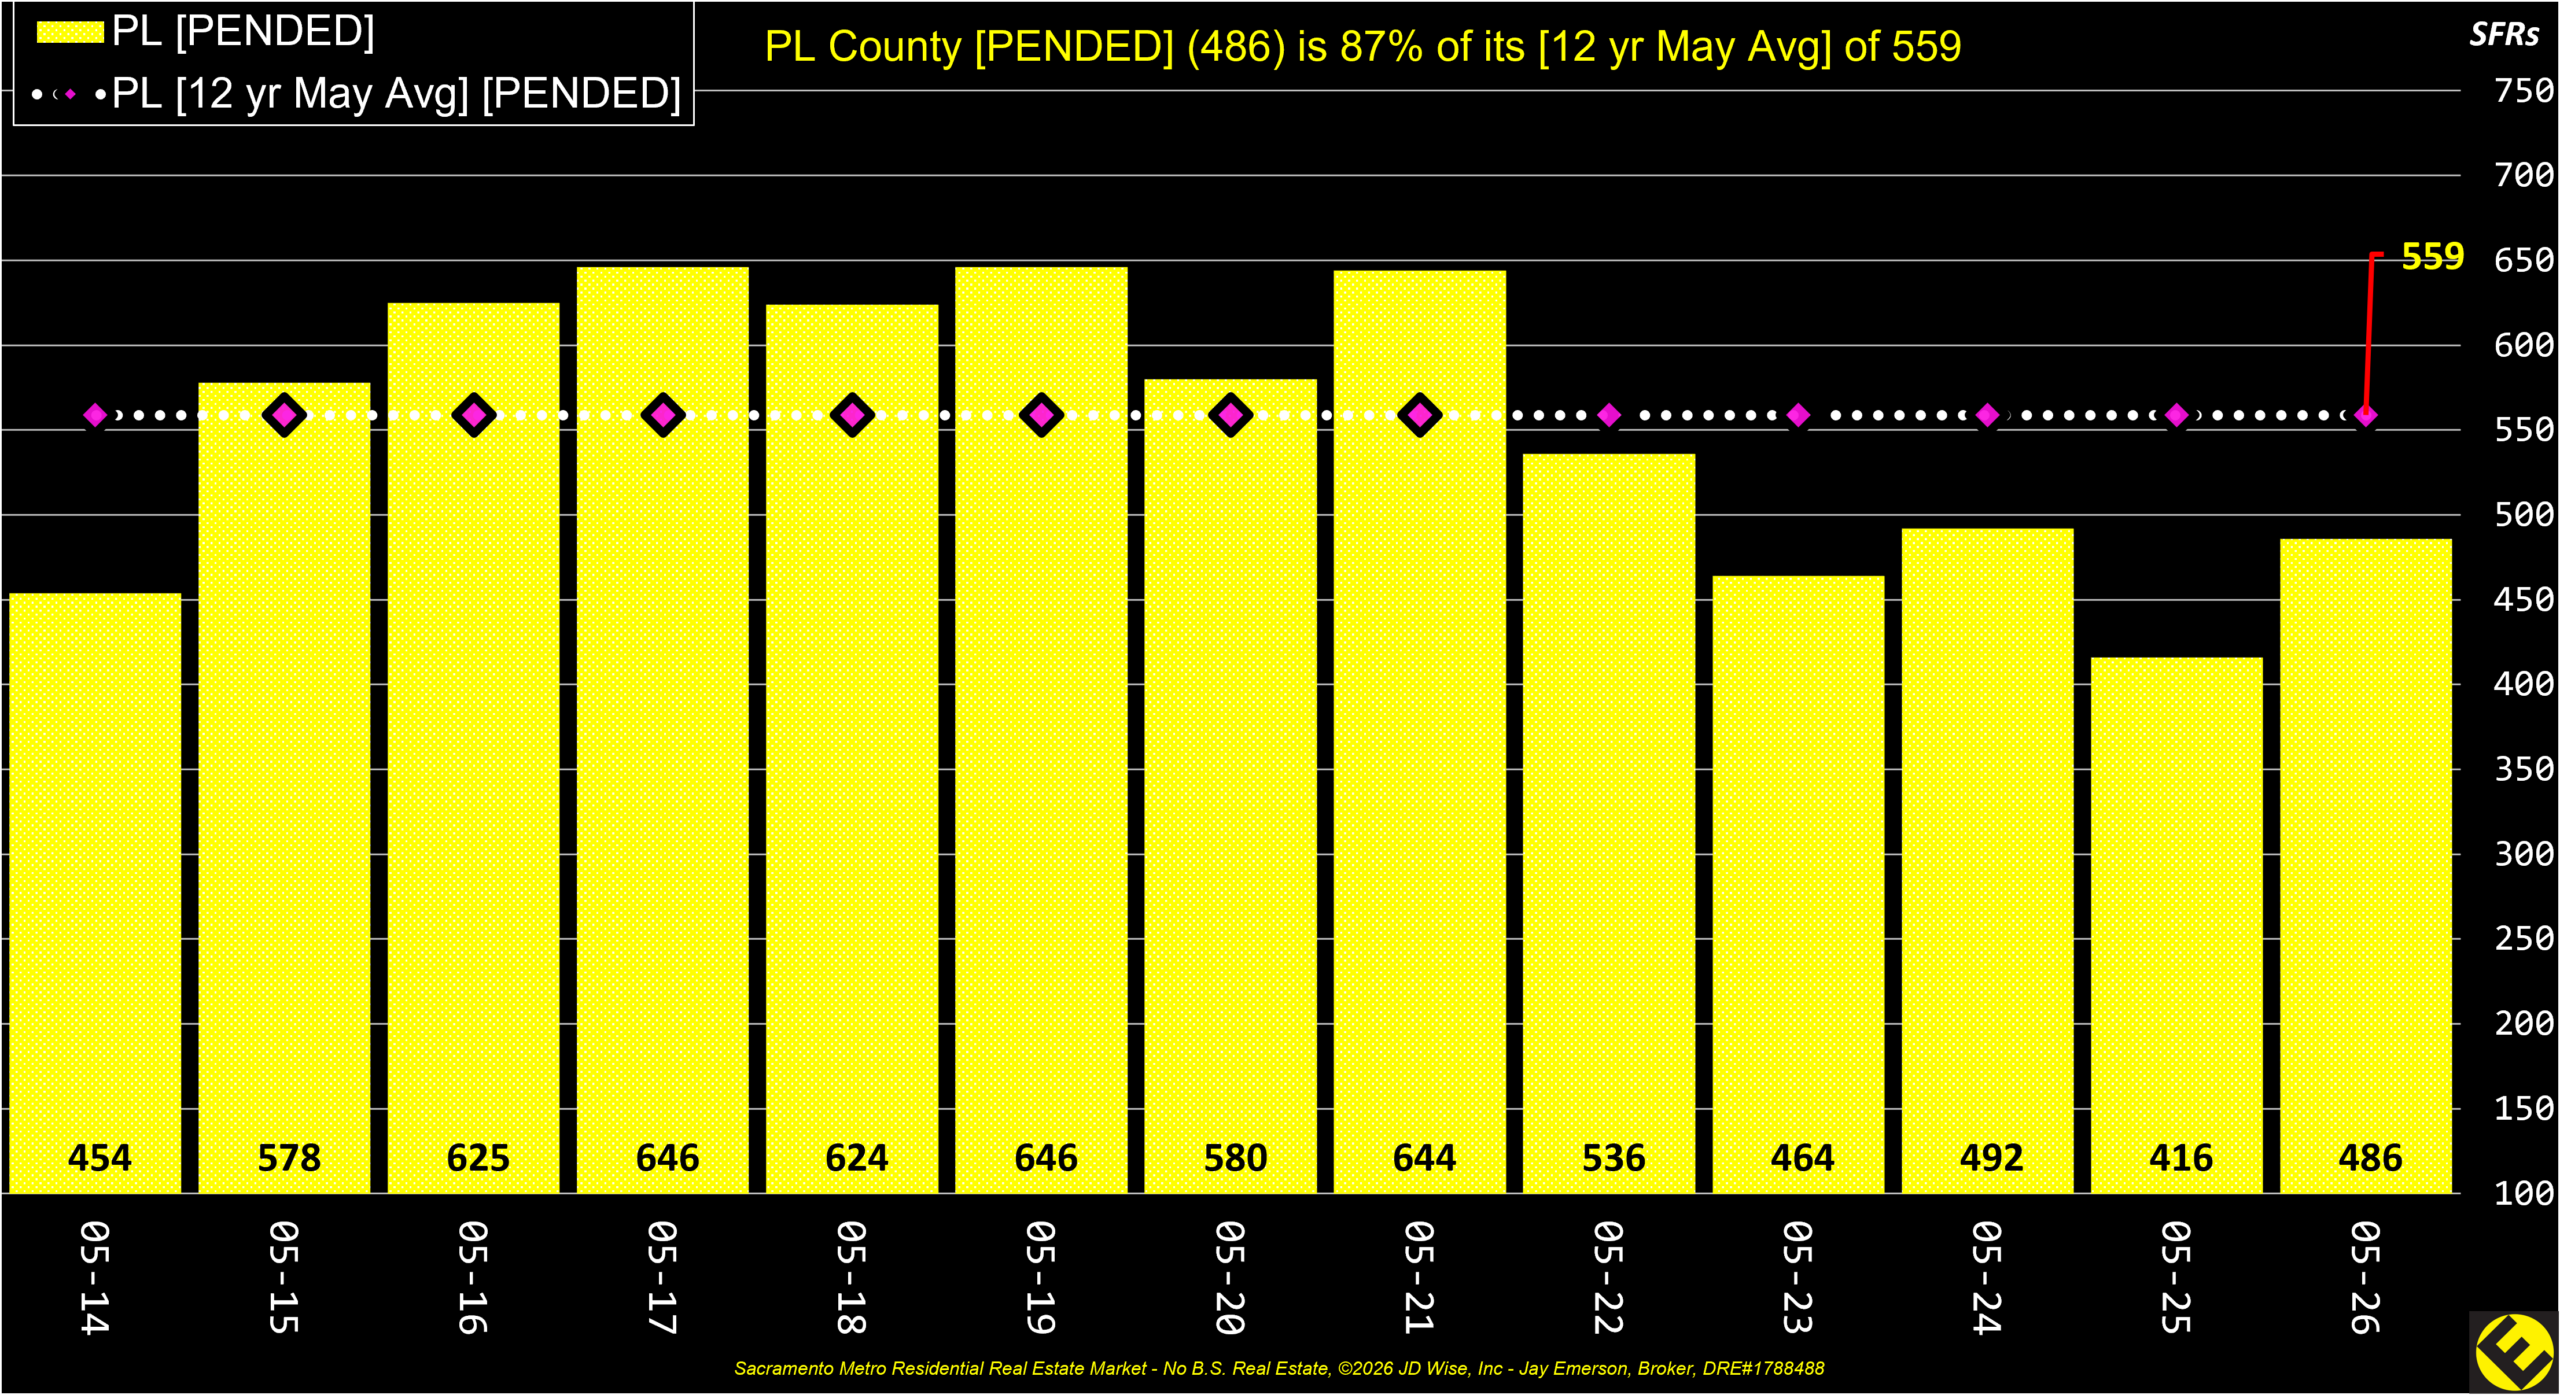
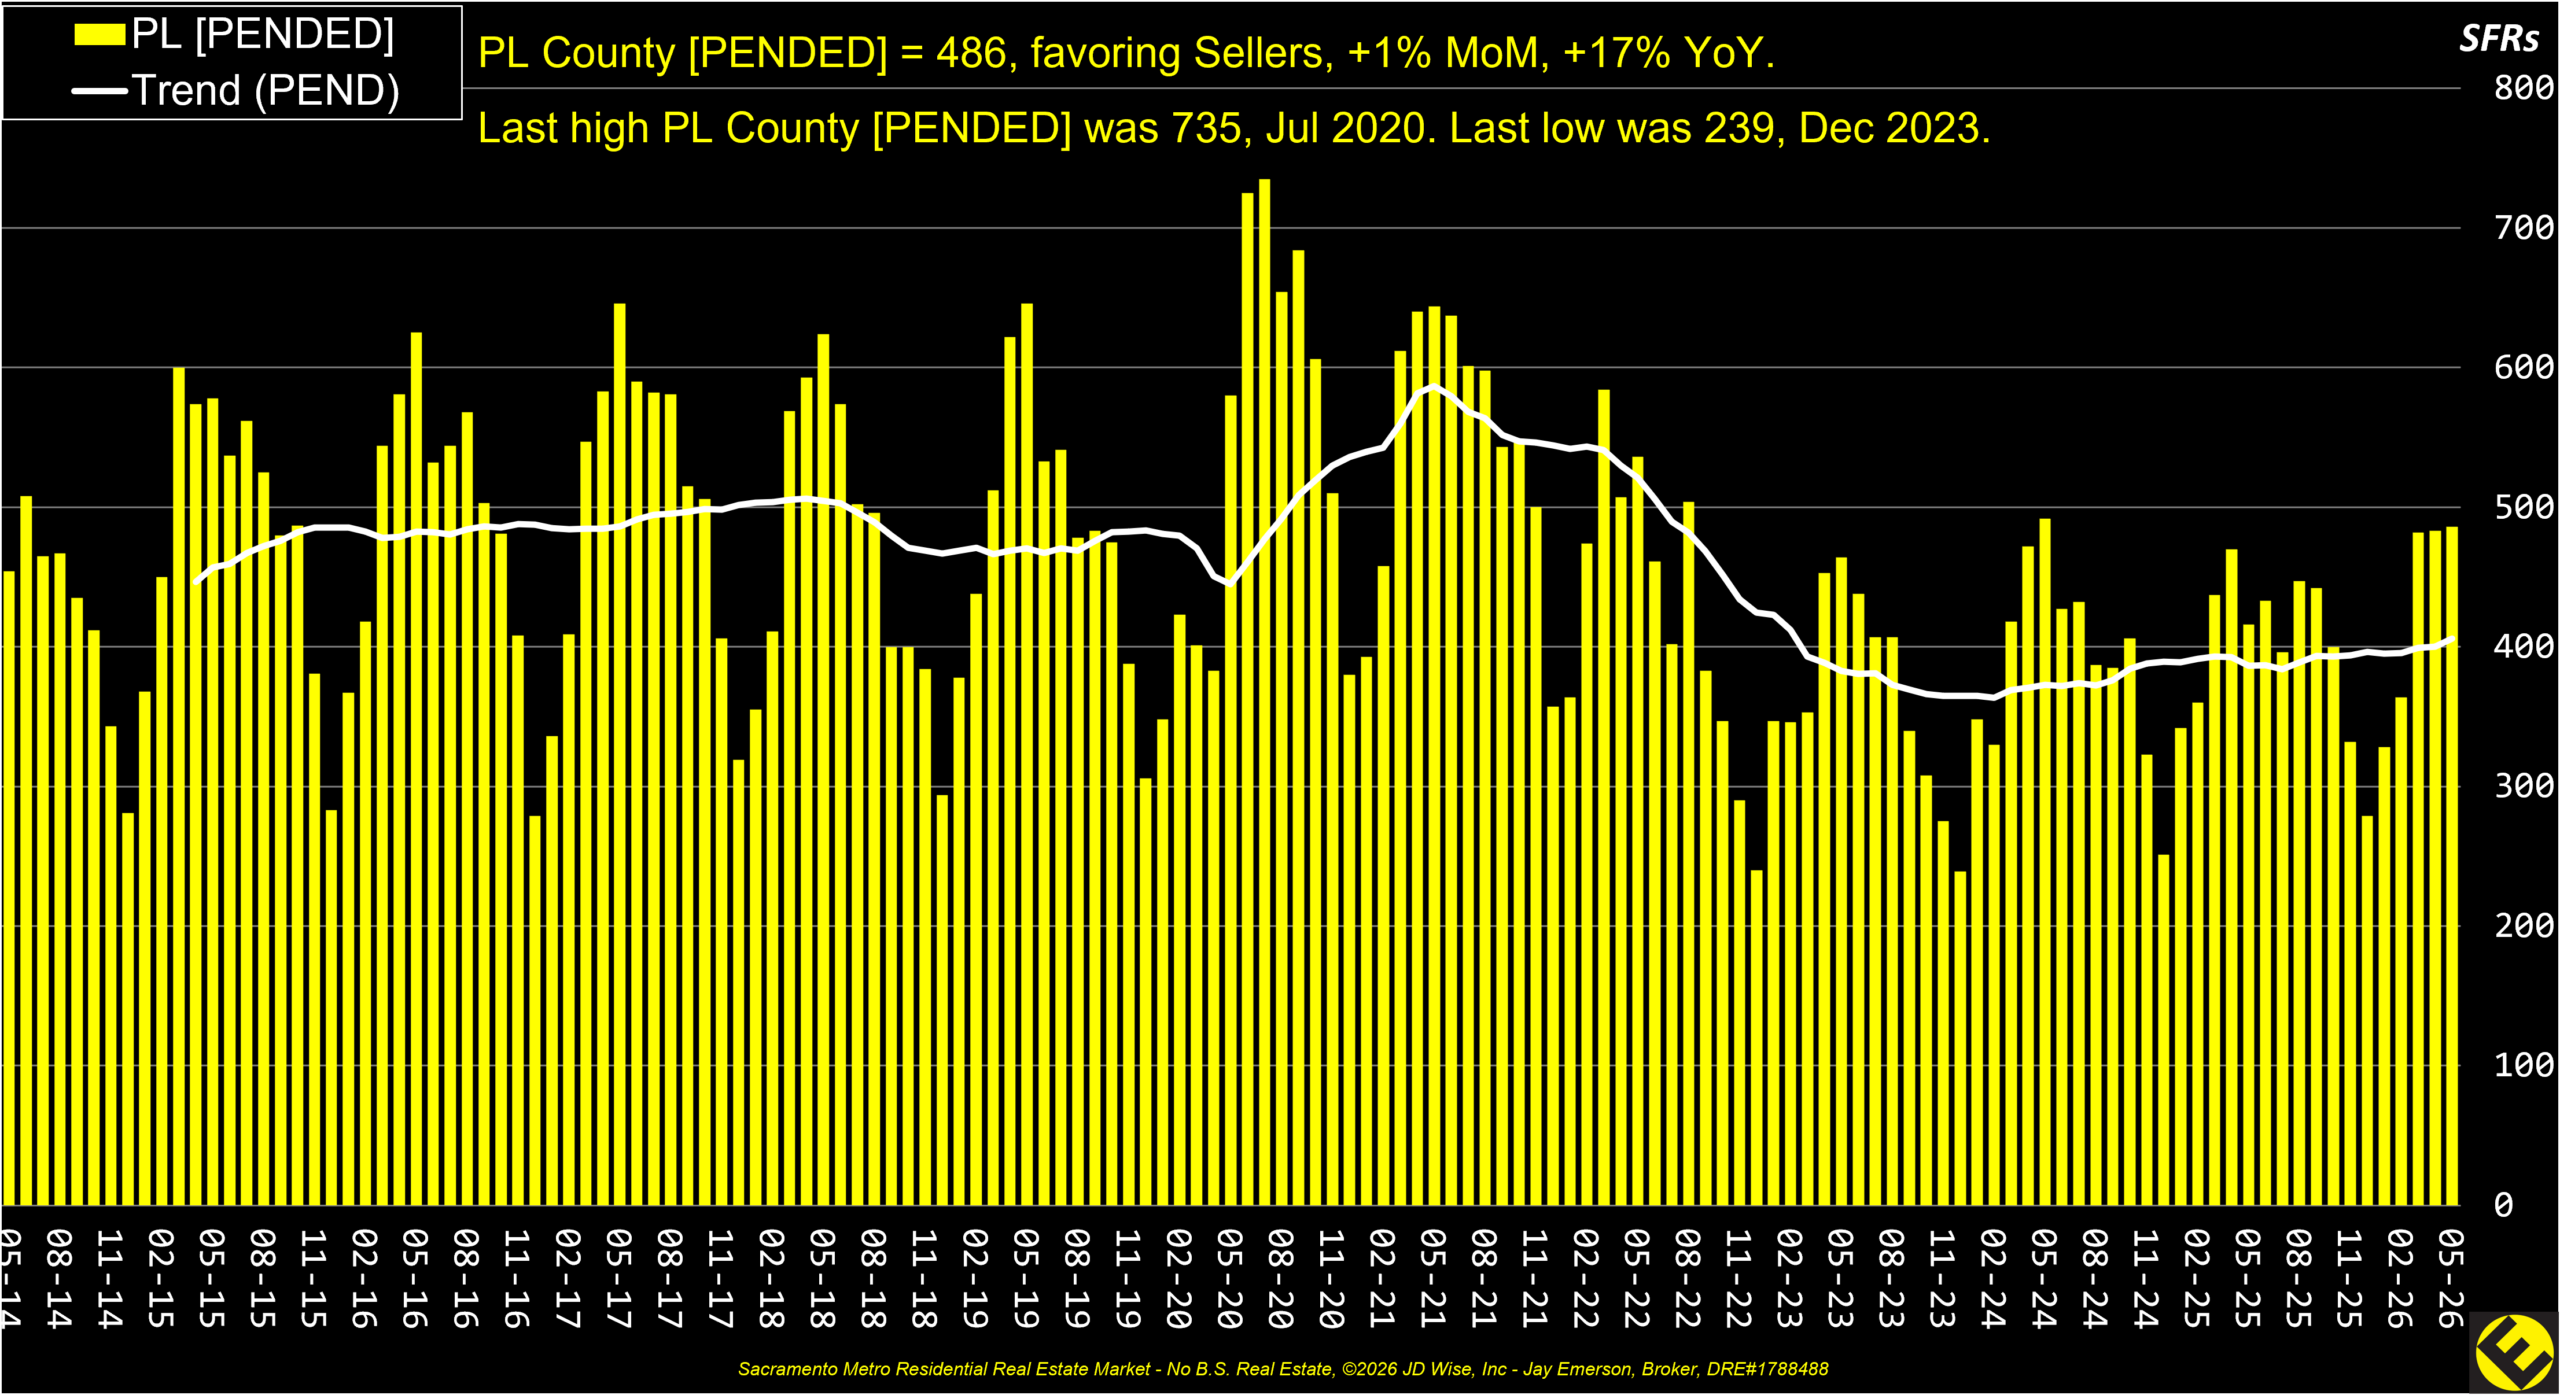
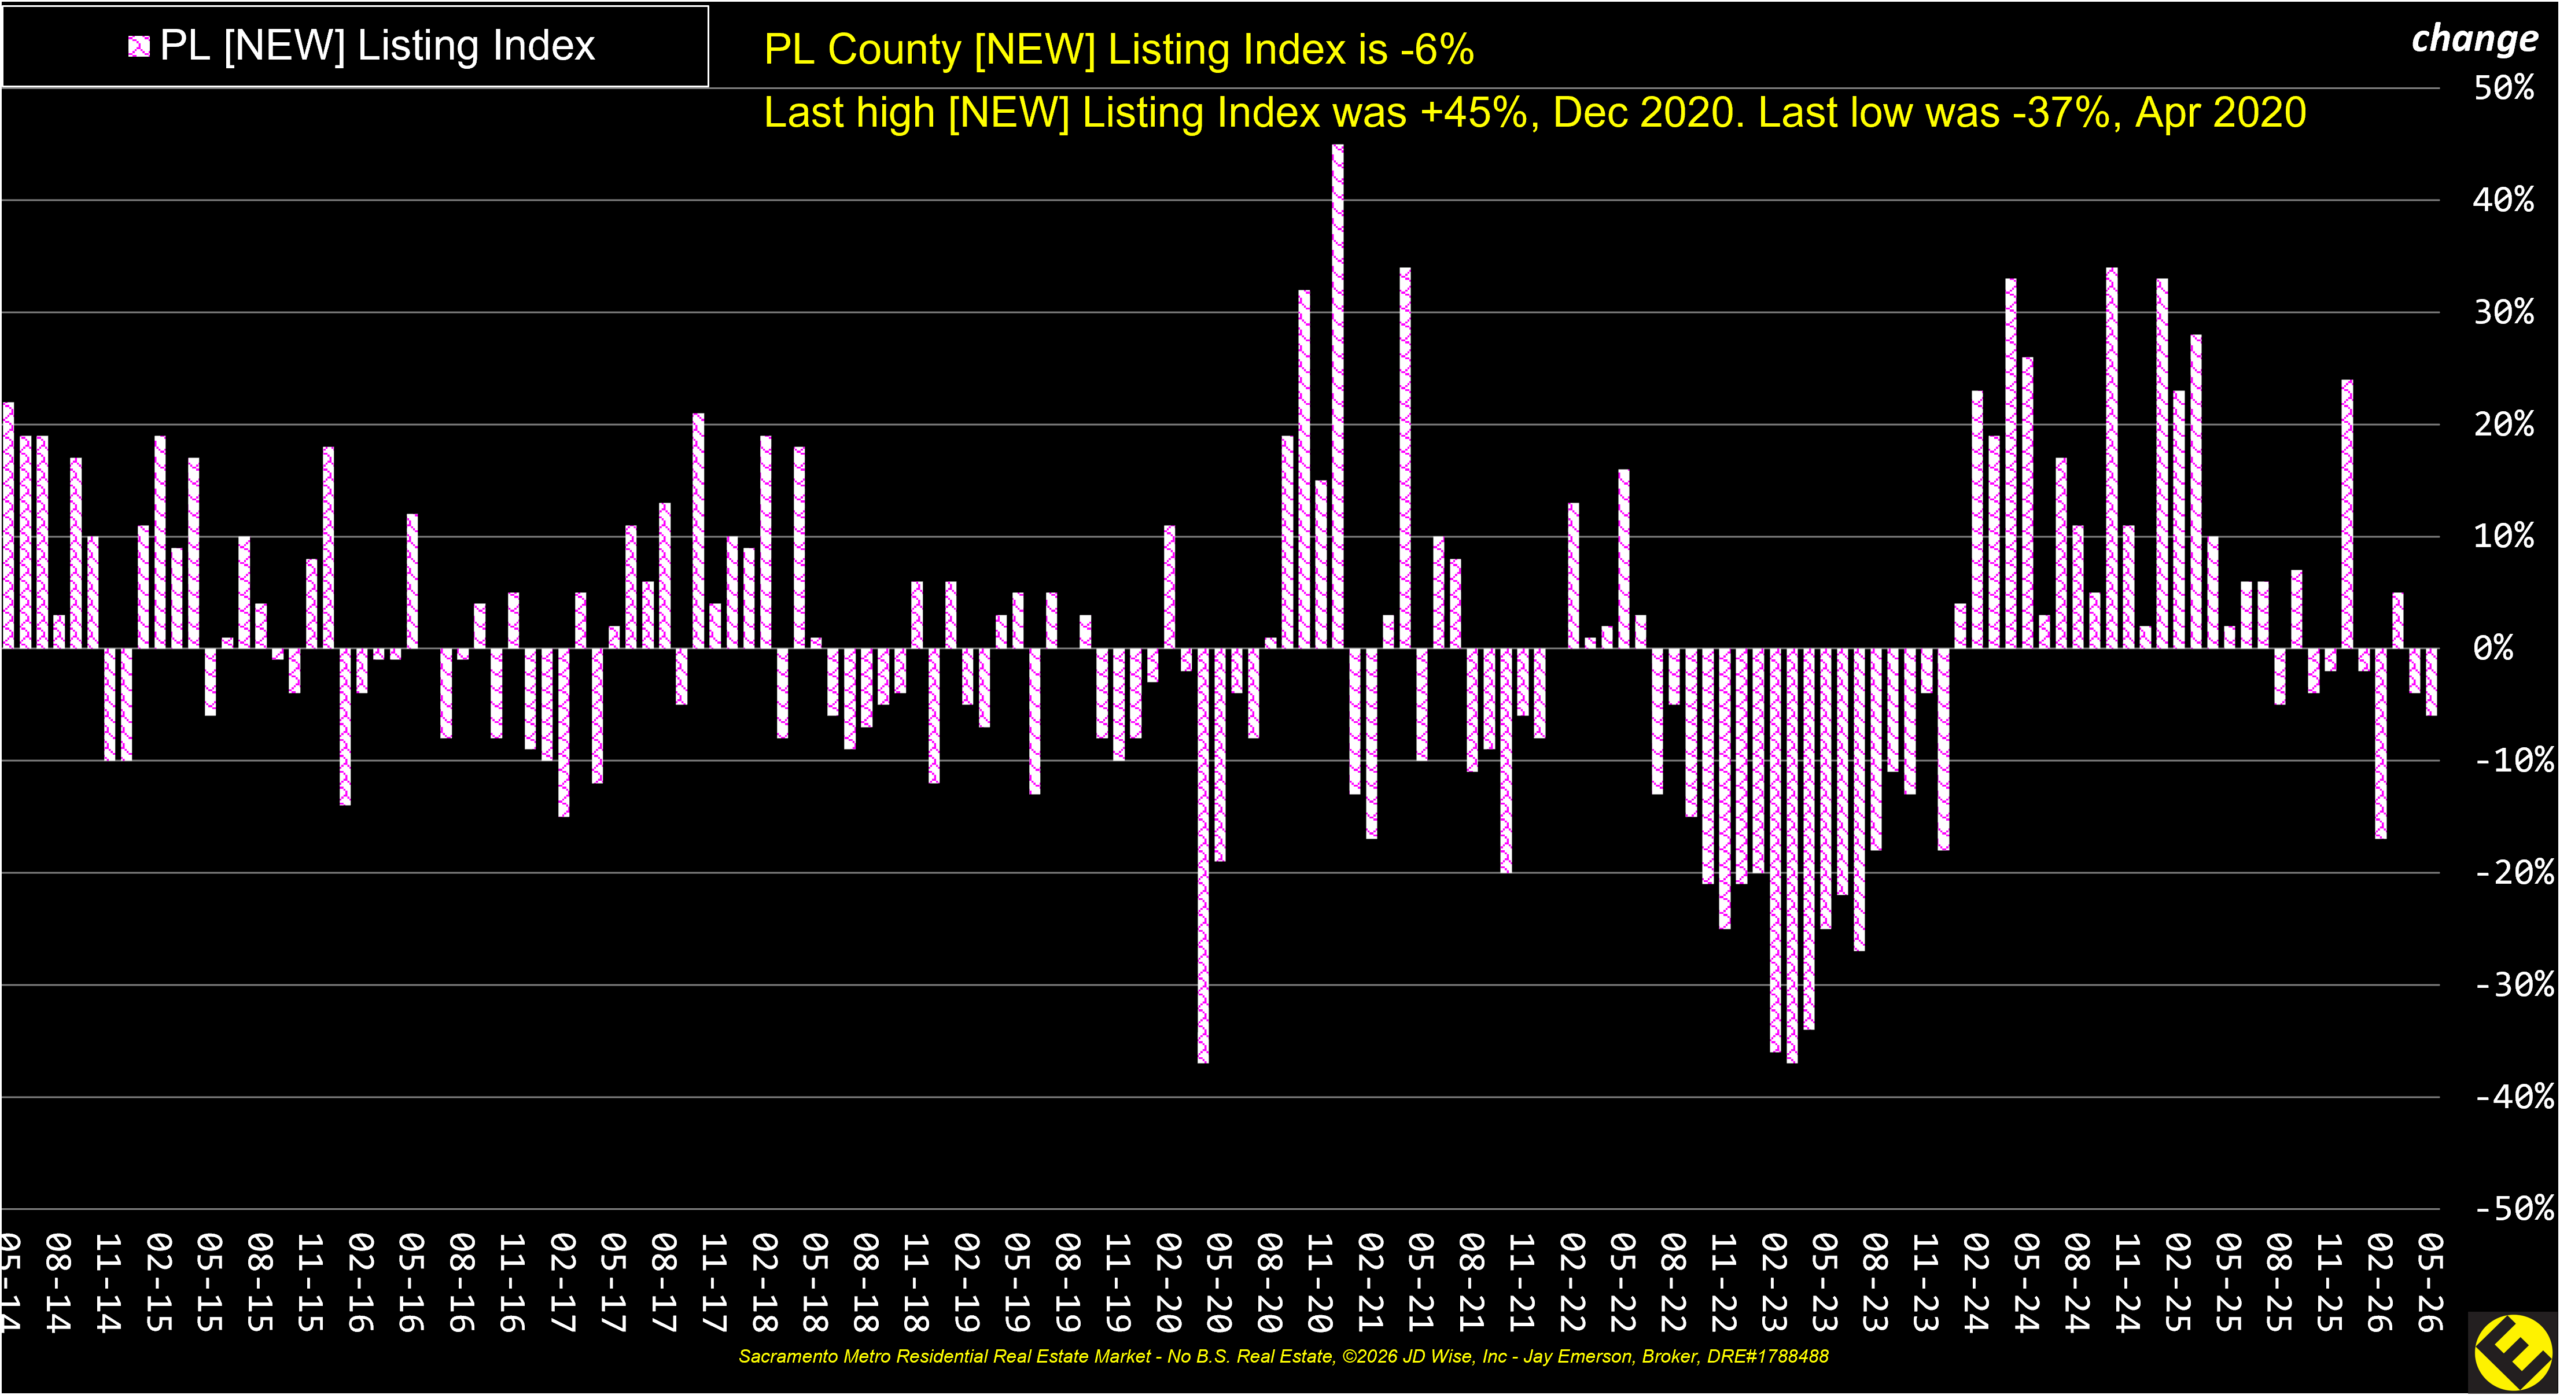
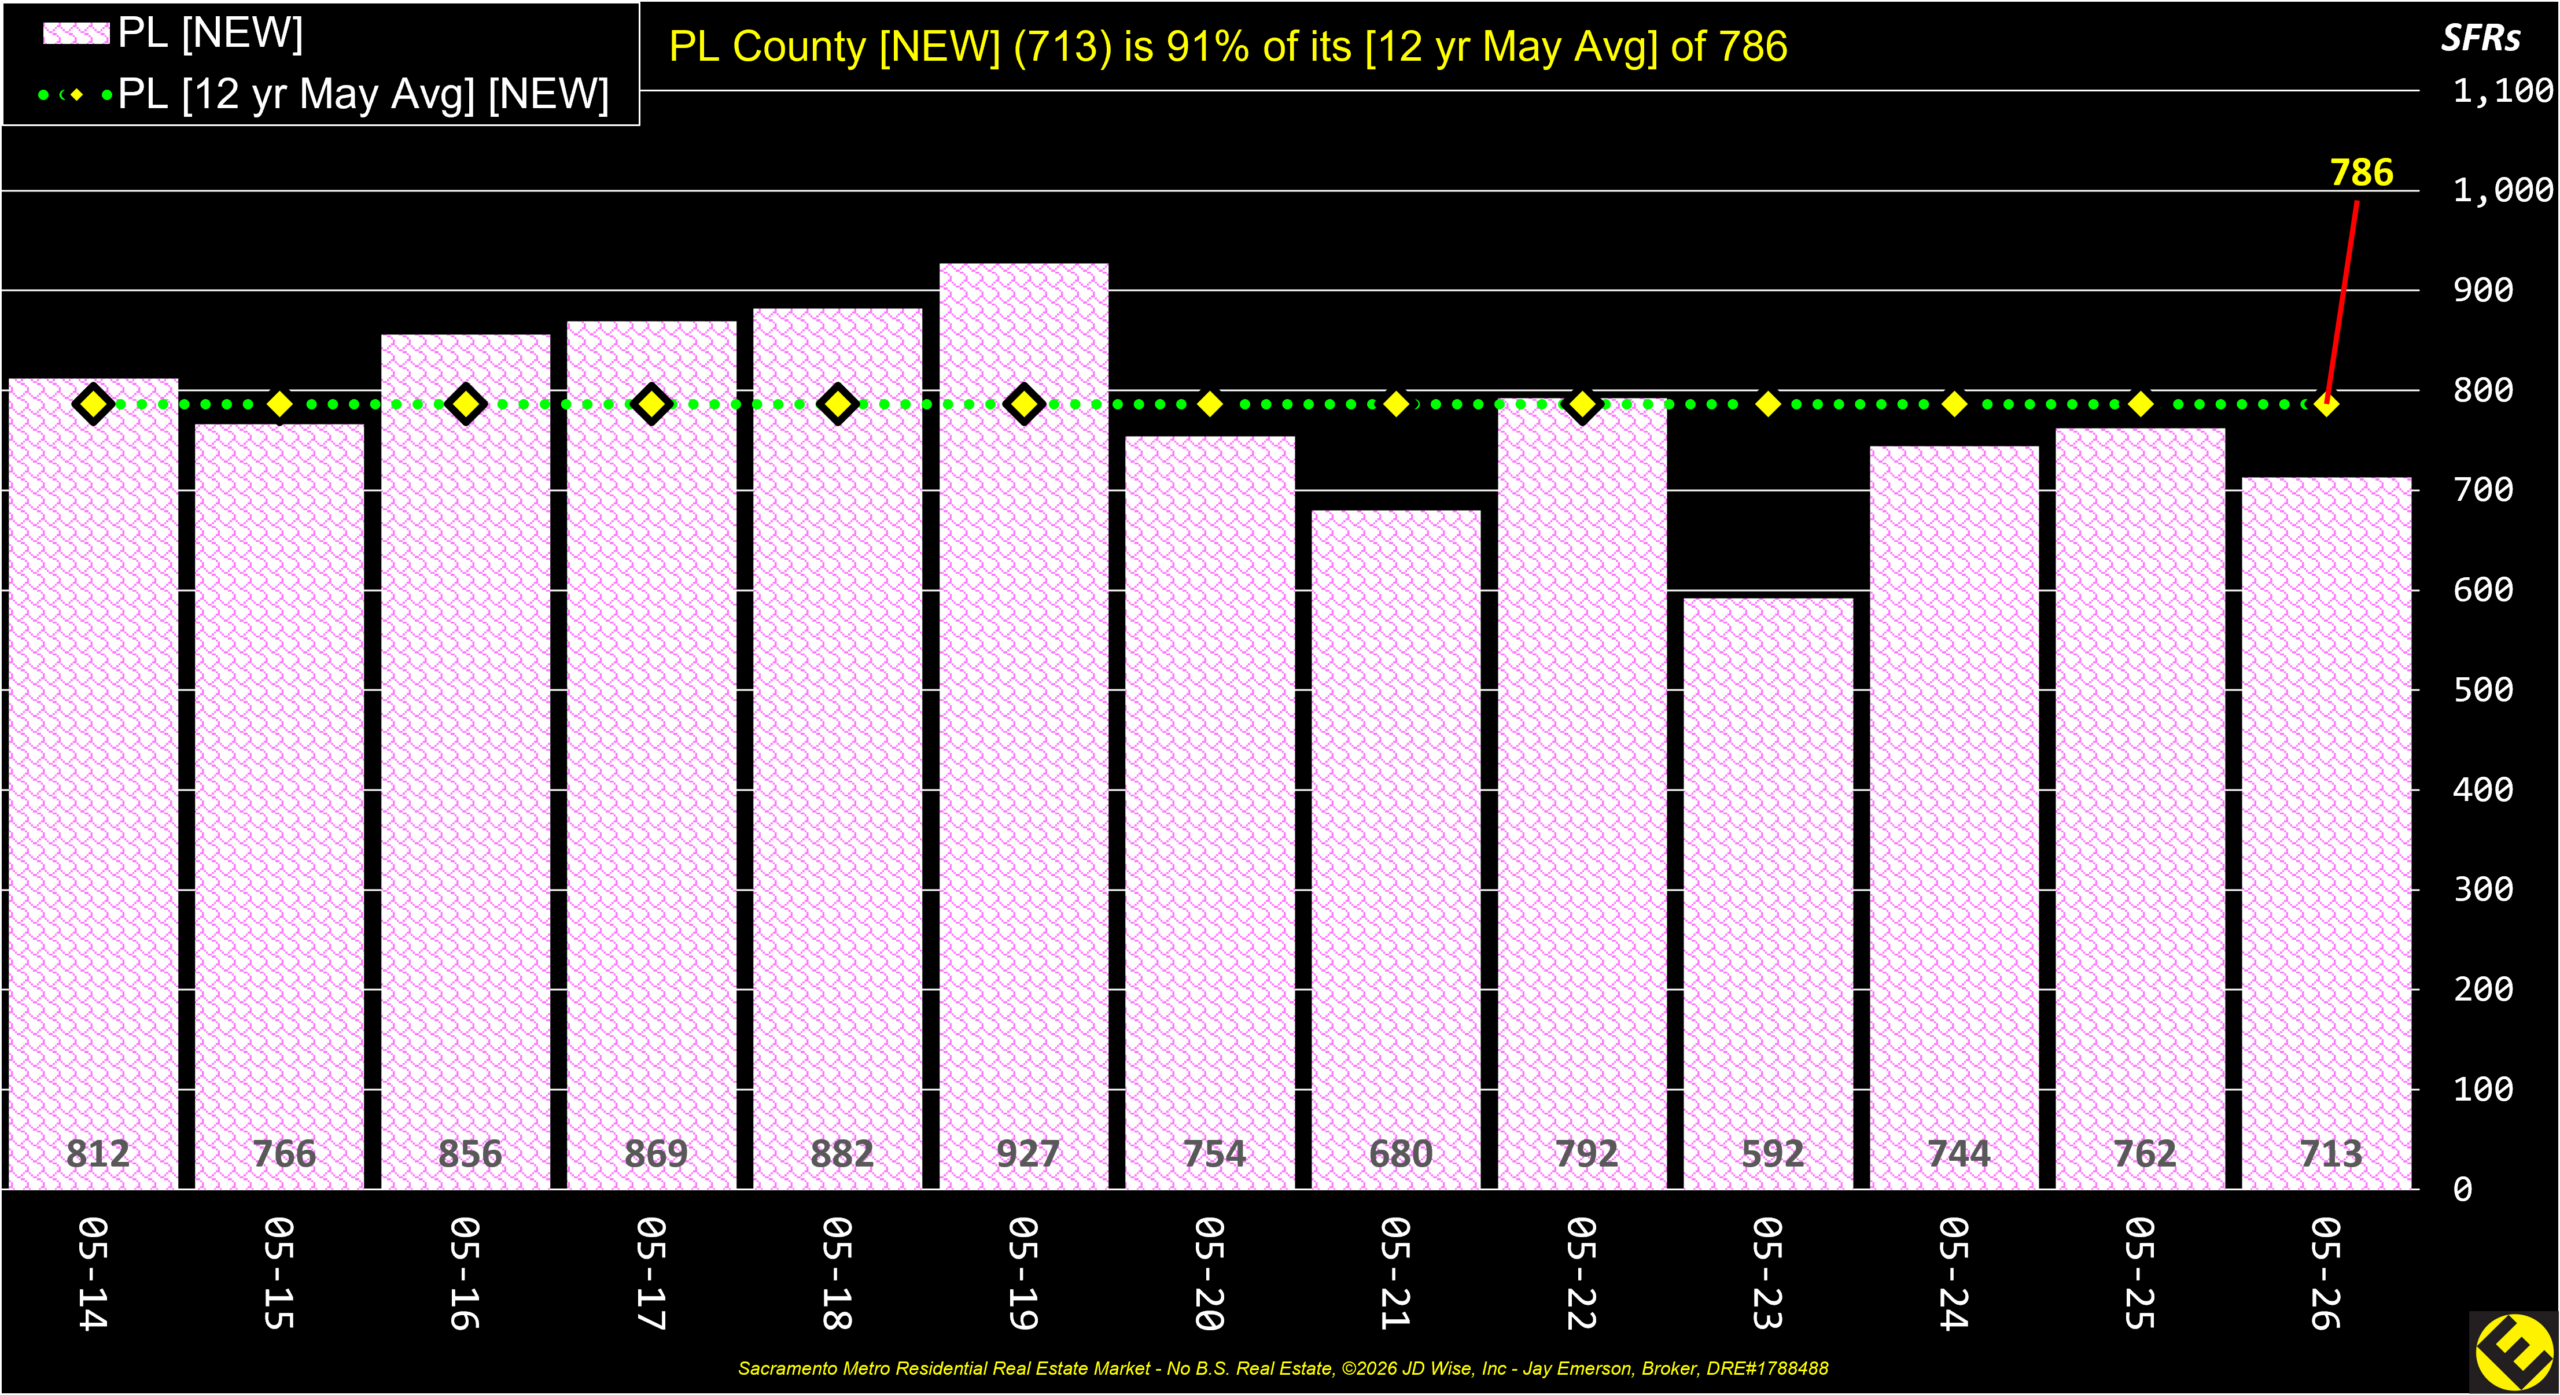
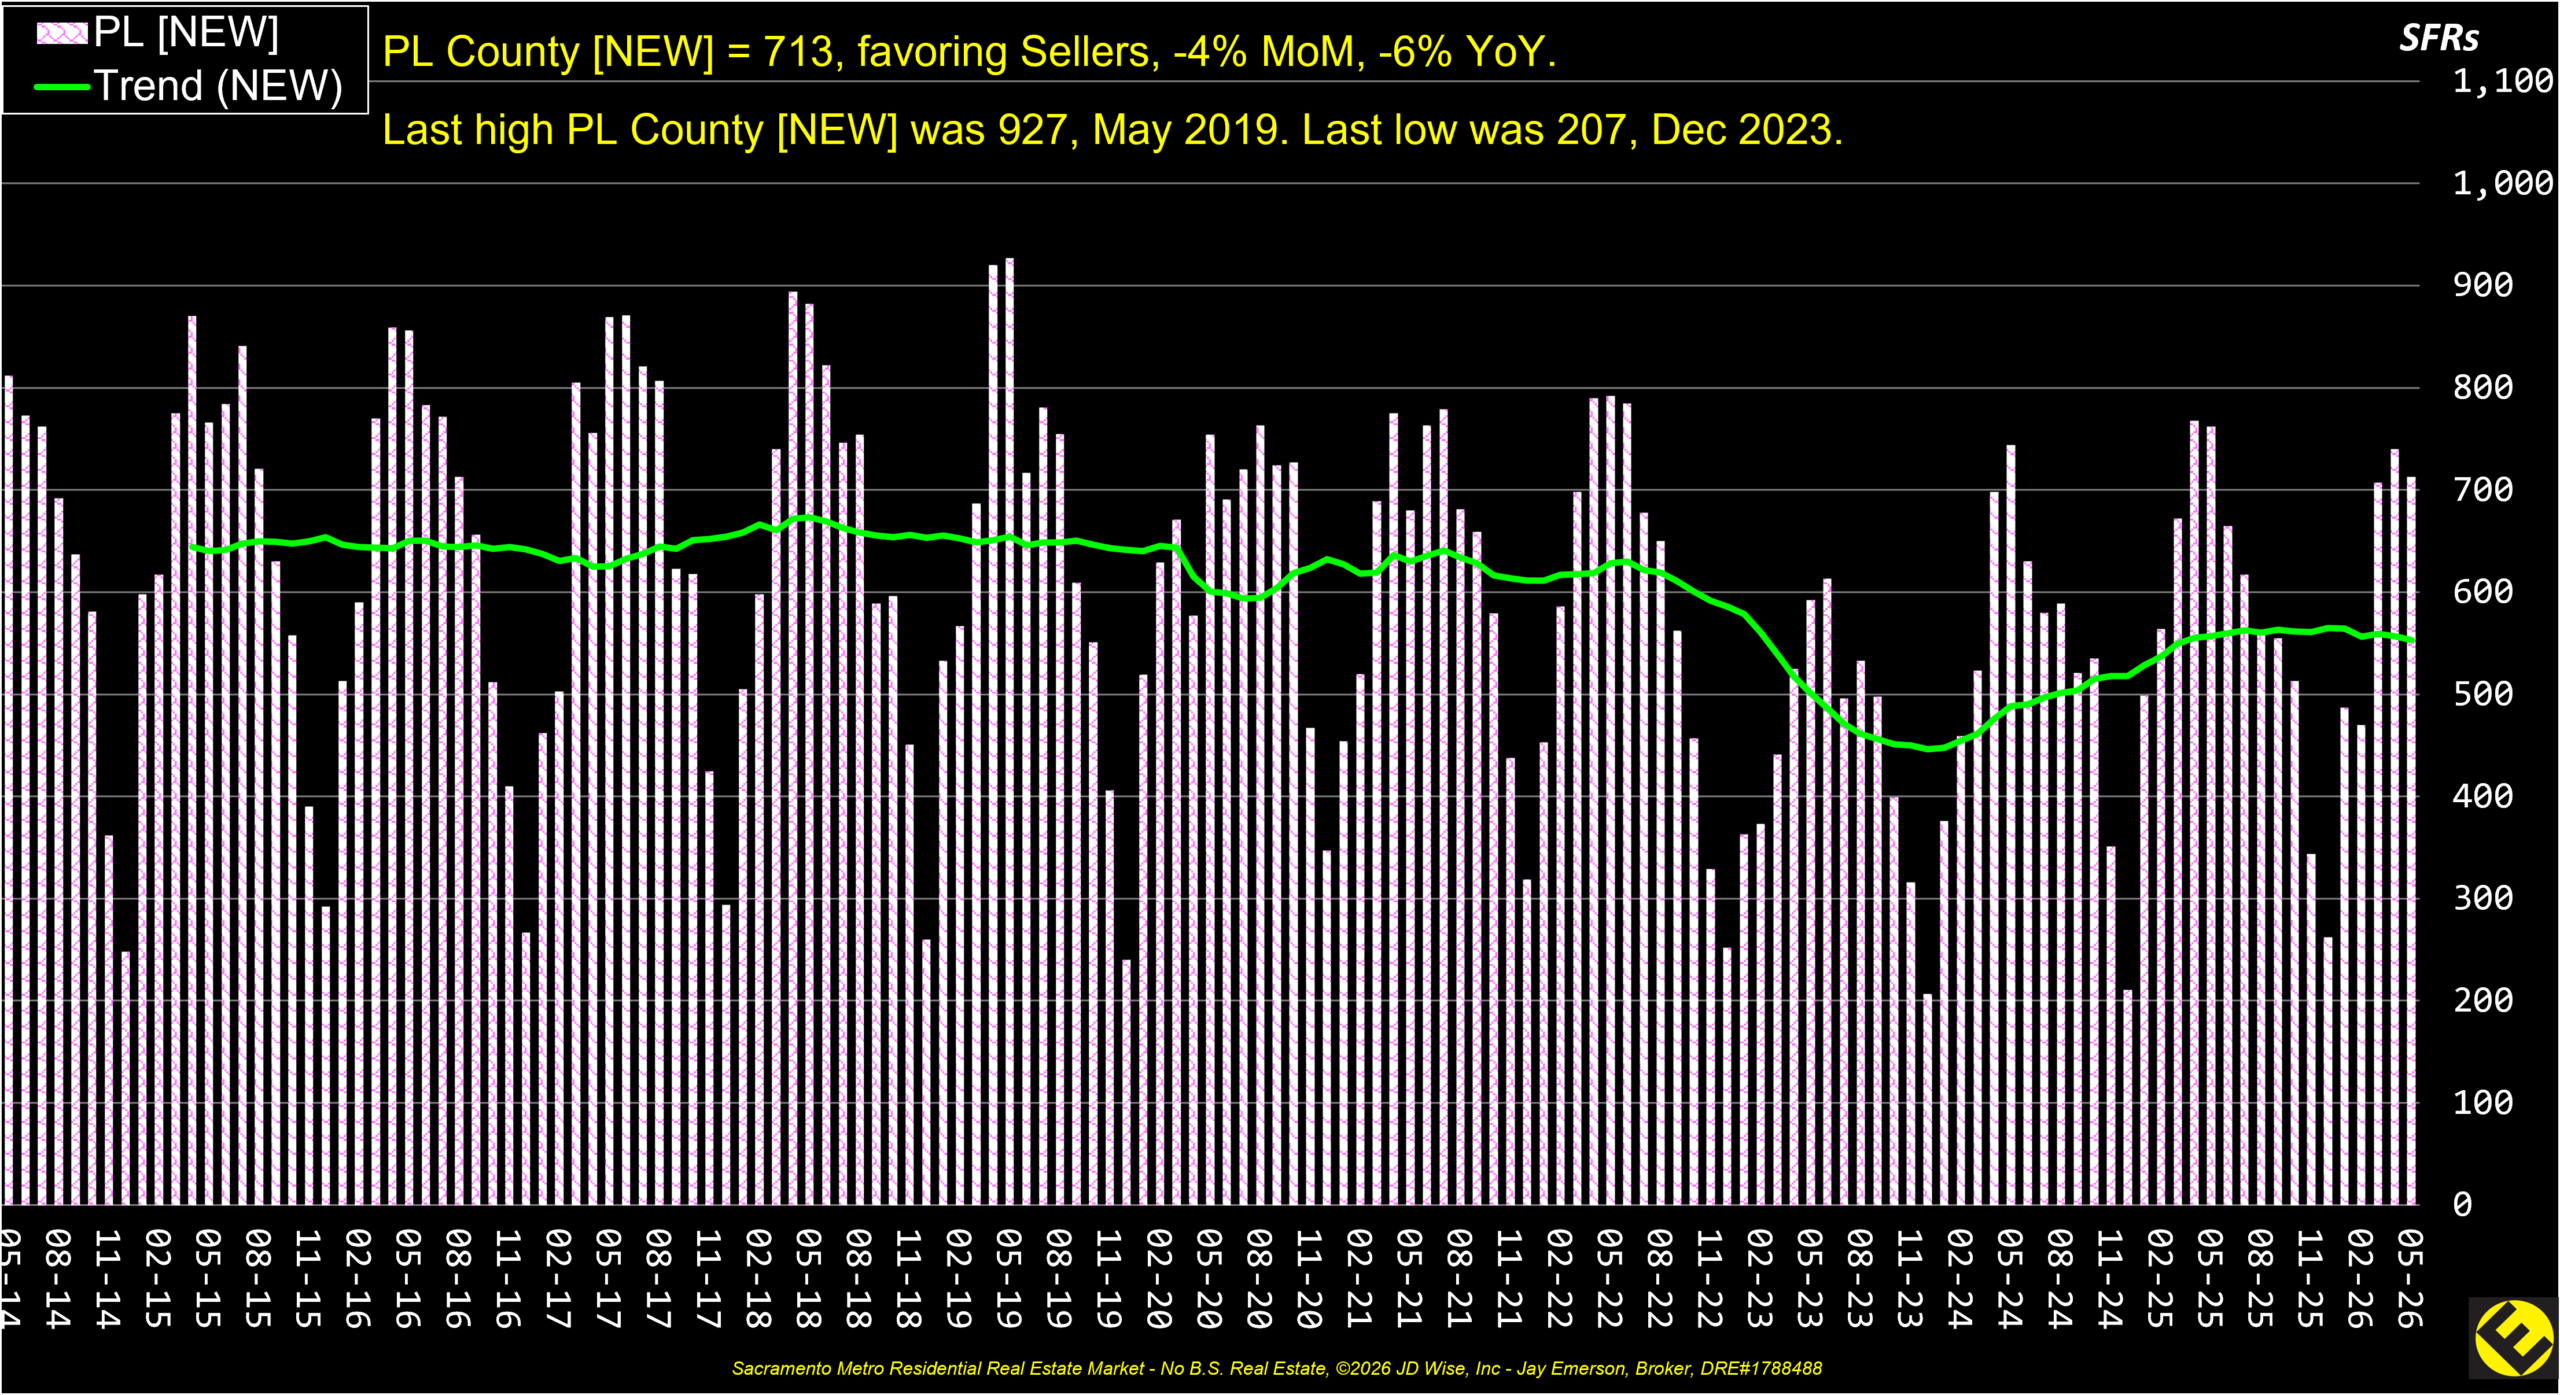
Using raw and monthly MLS data from 3 Counties (Sacramento, El Dorado, Placer) for New, Active, Pended, and Sold listings, the average Cumulative Days on Market, and the average Median Price. The data for the Composite Average is for the 52 zip codes, not these 3 Counties.

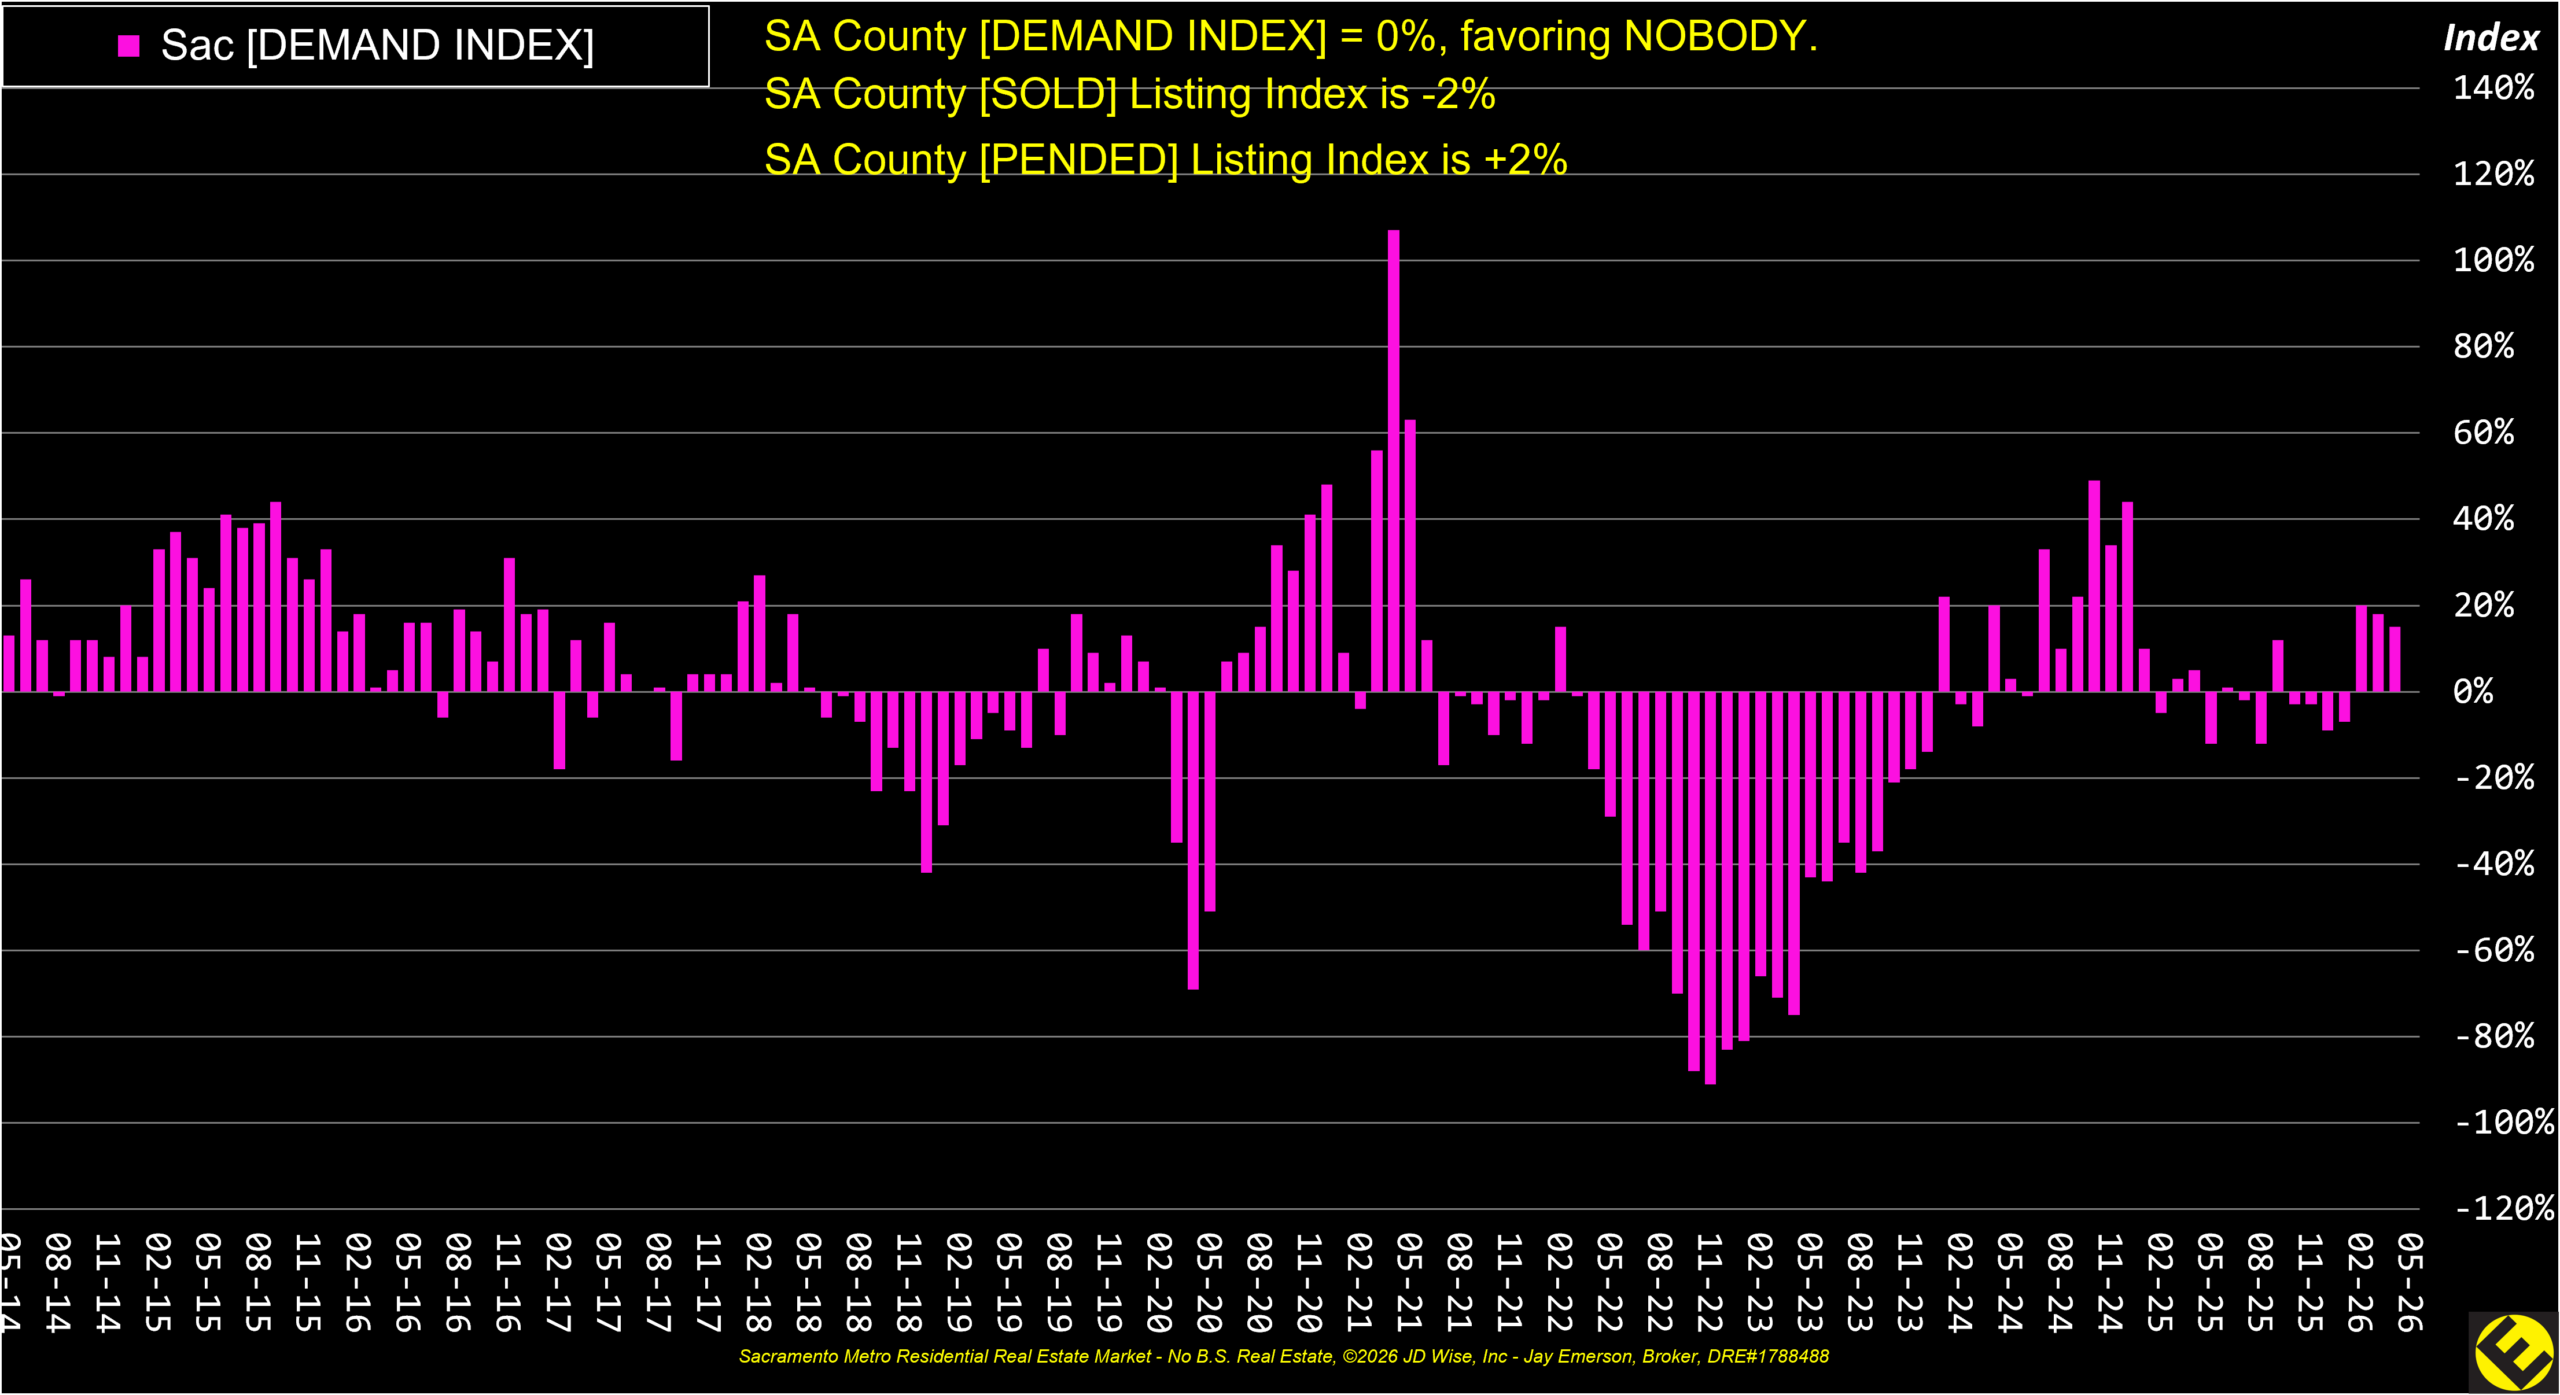
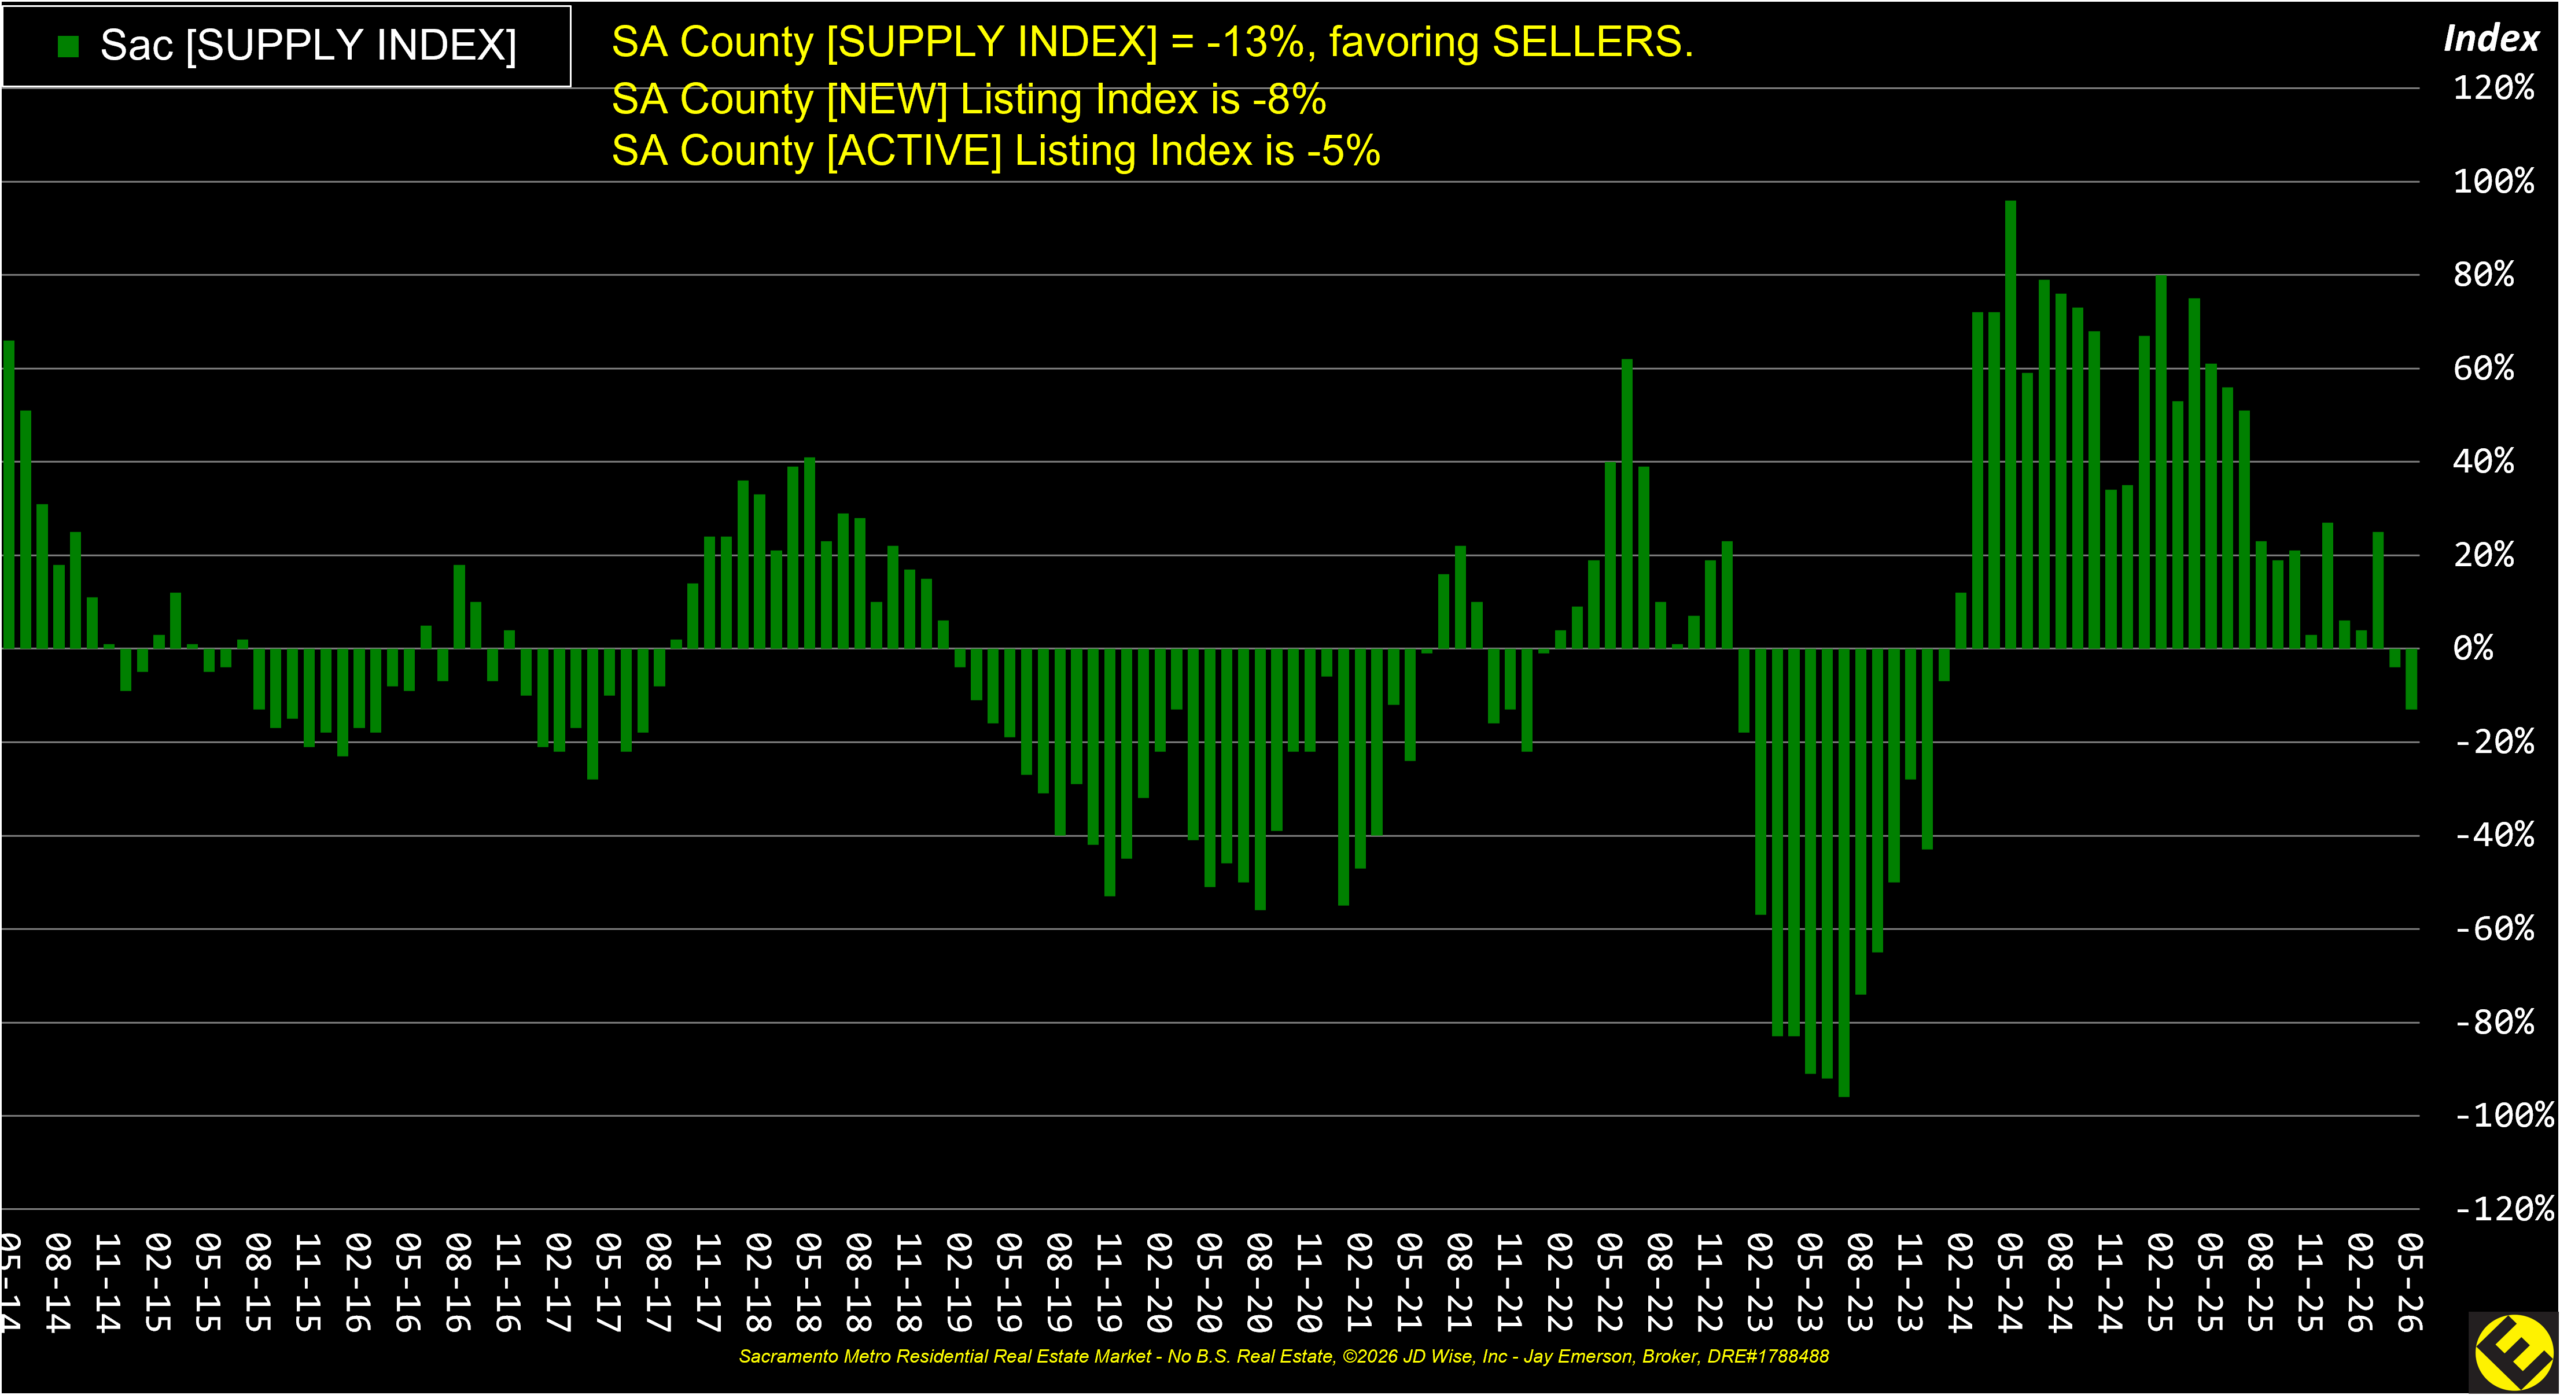
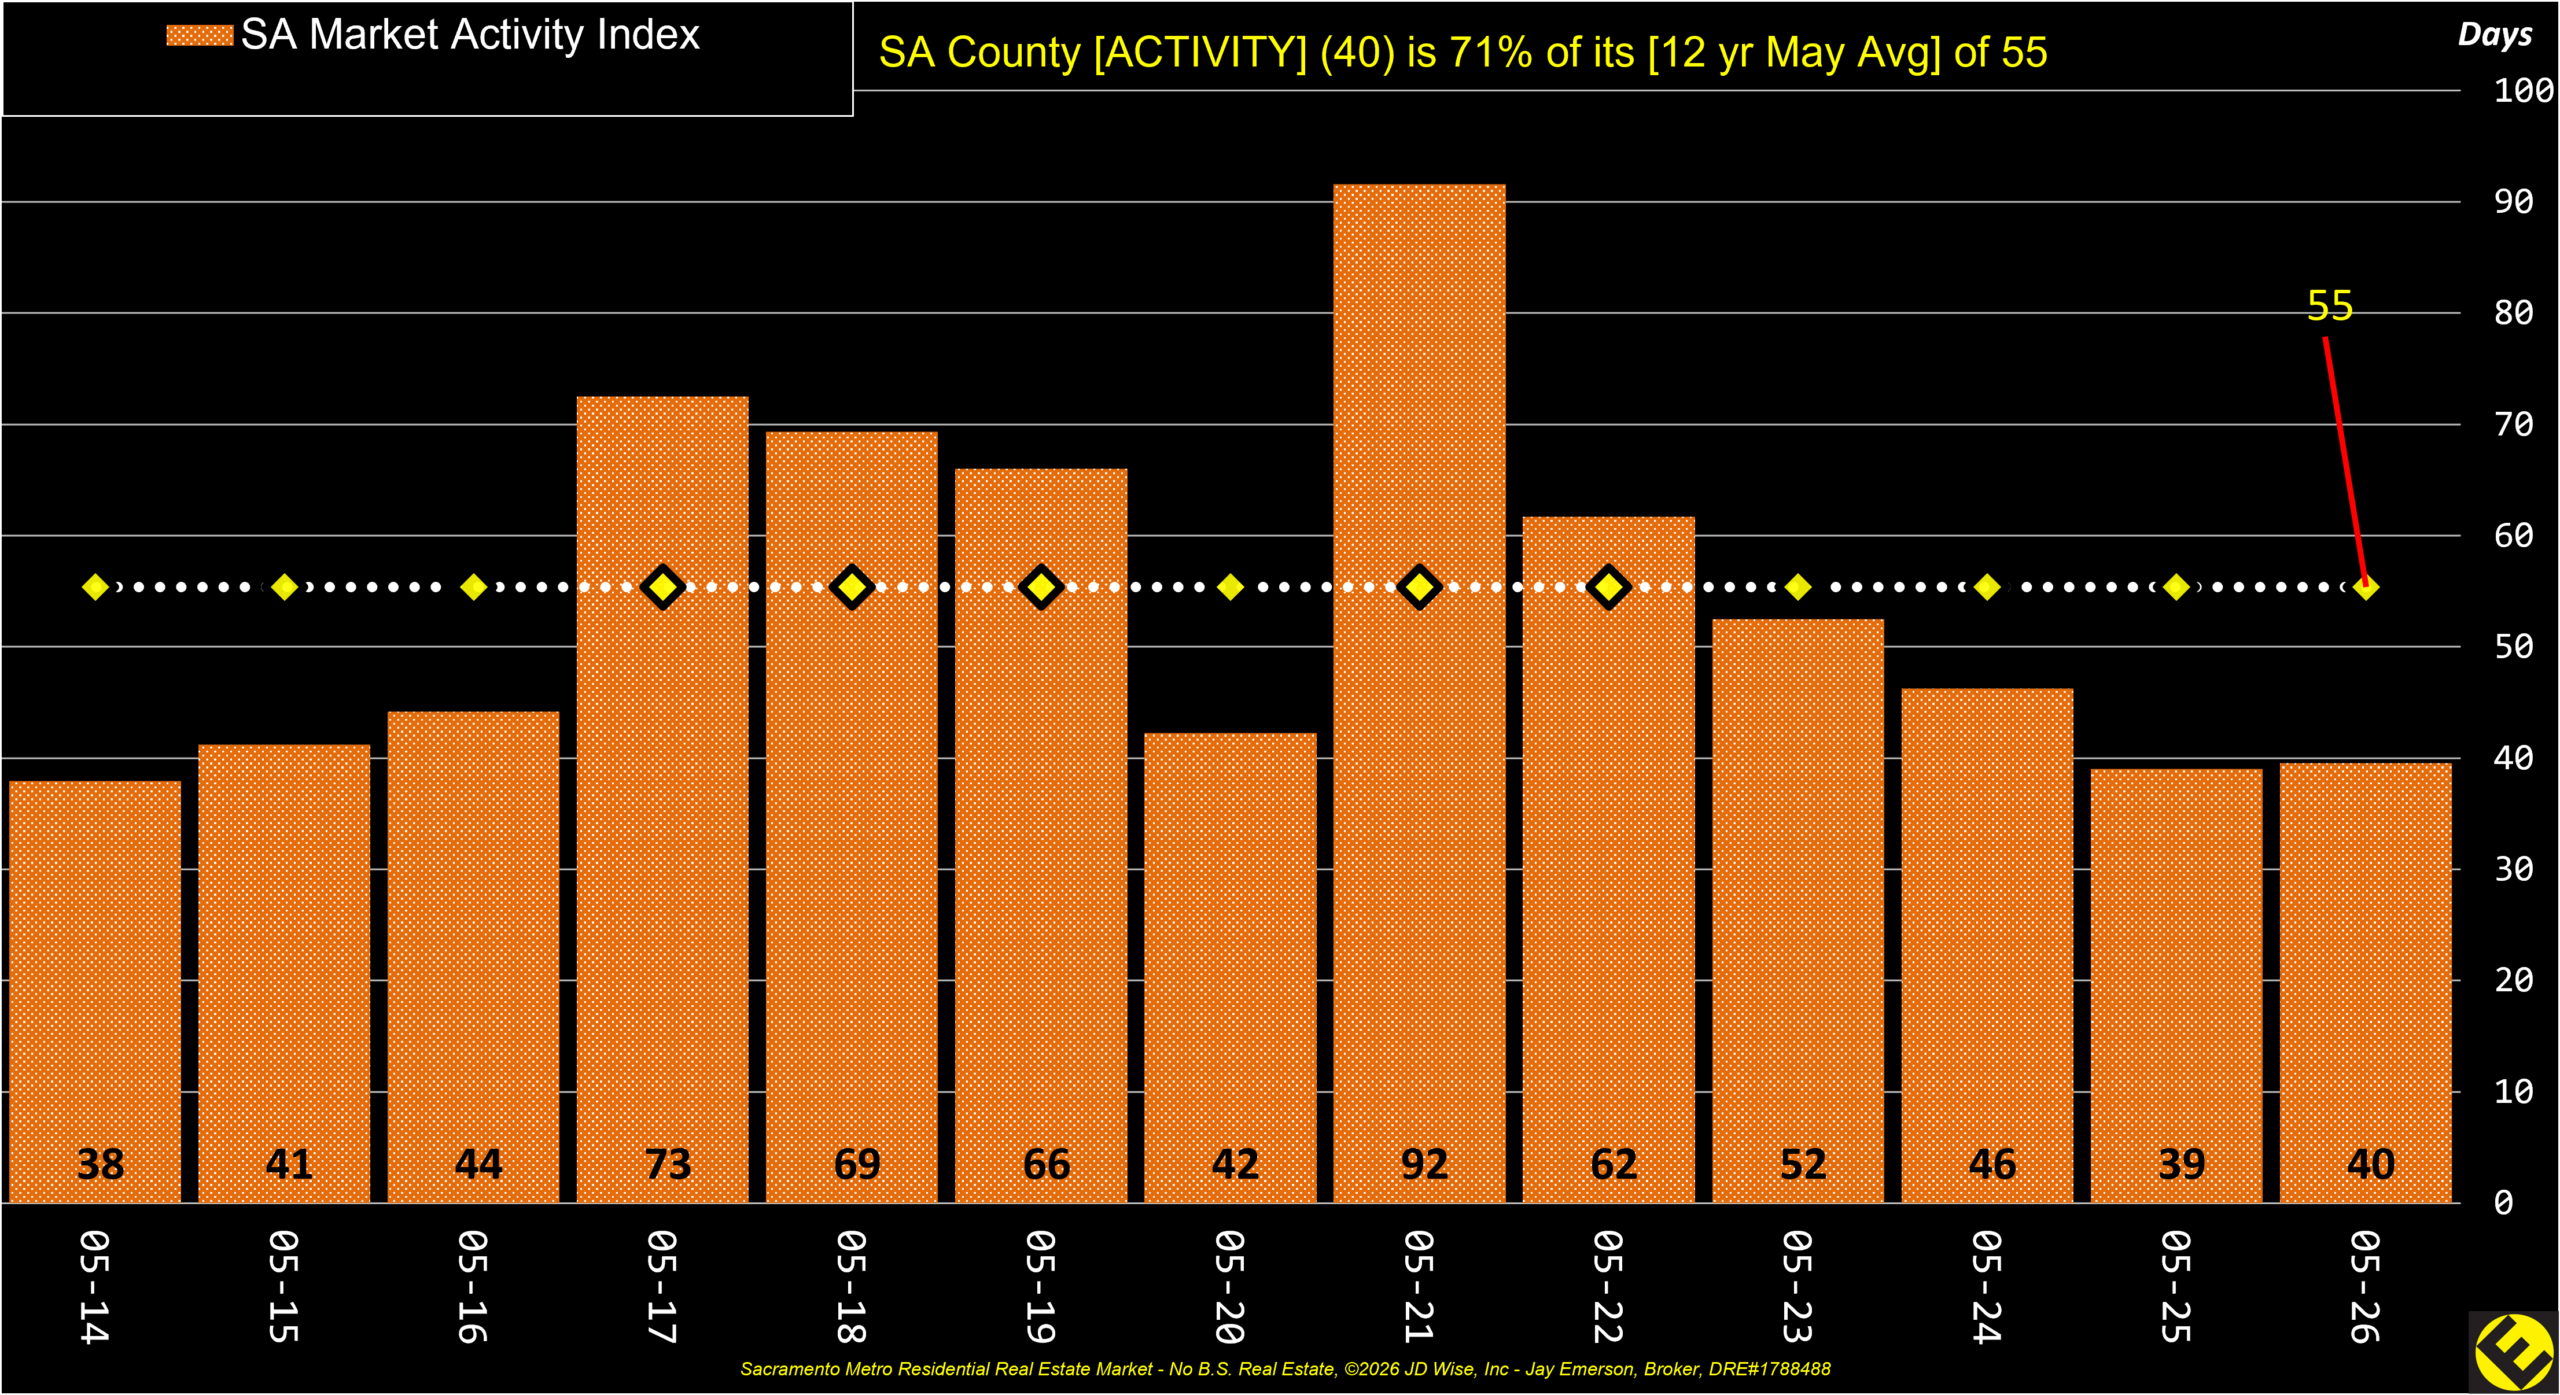
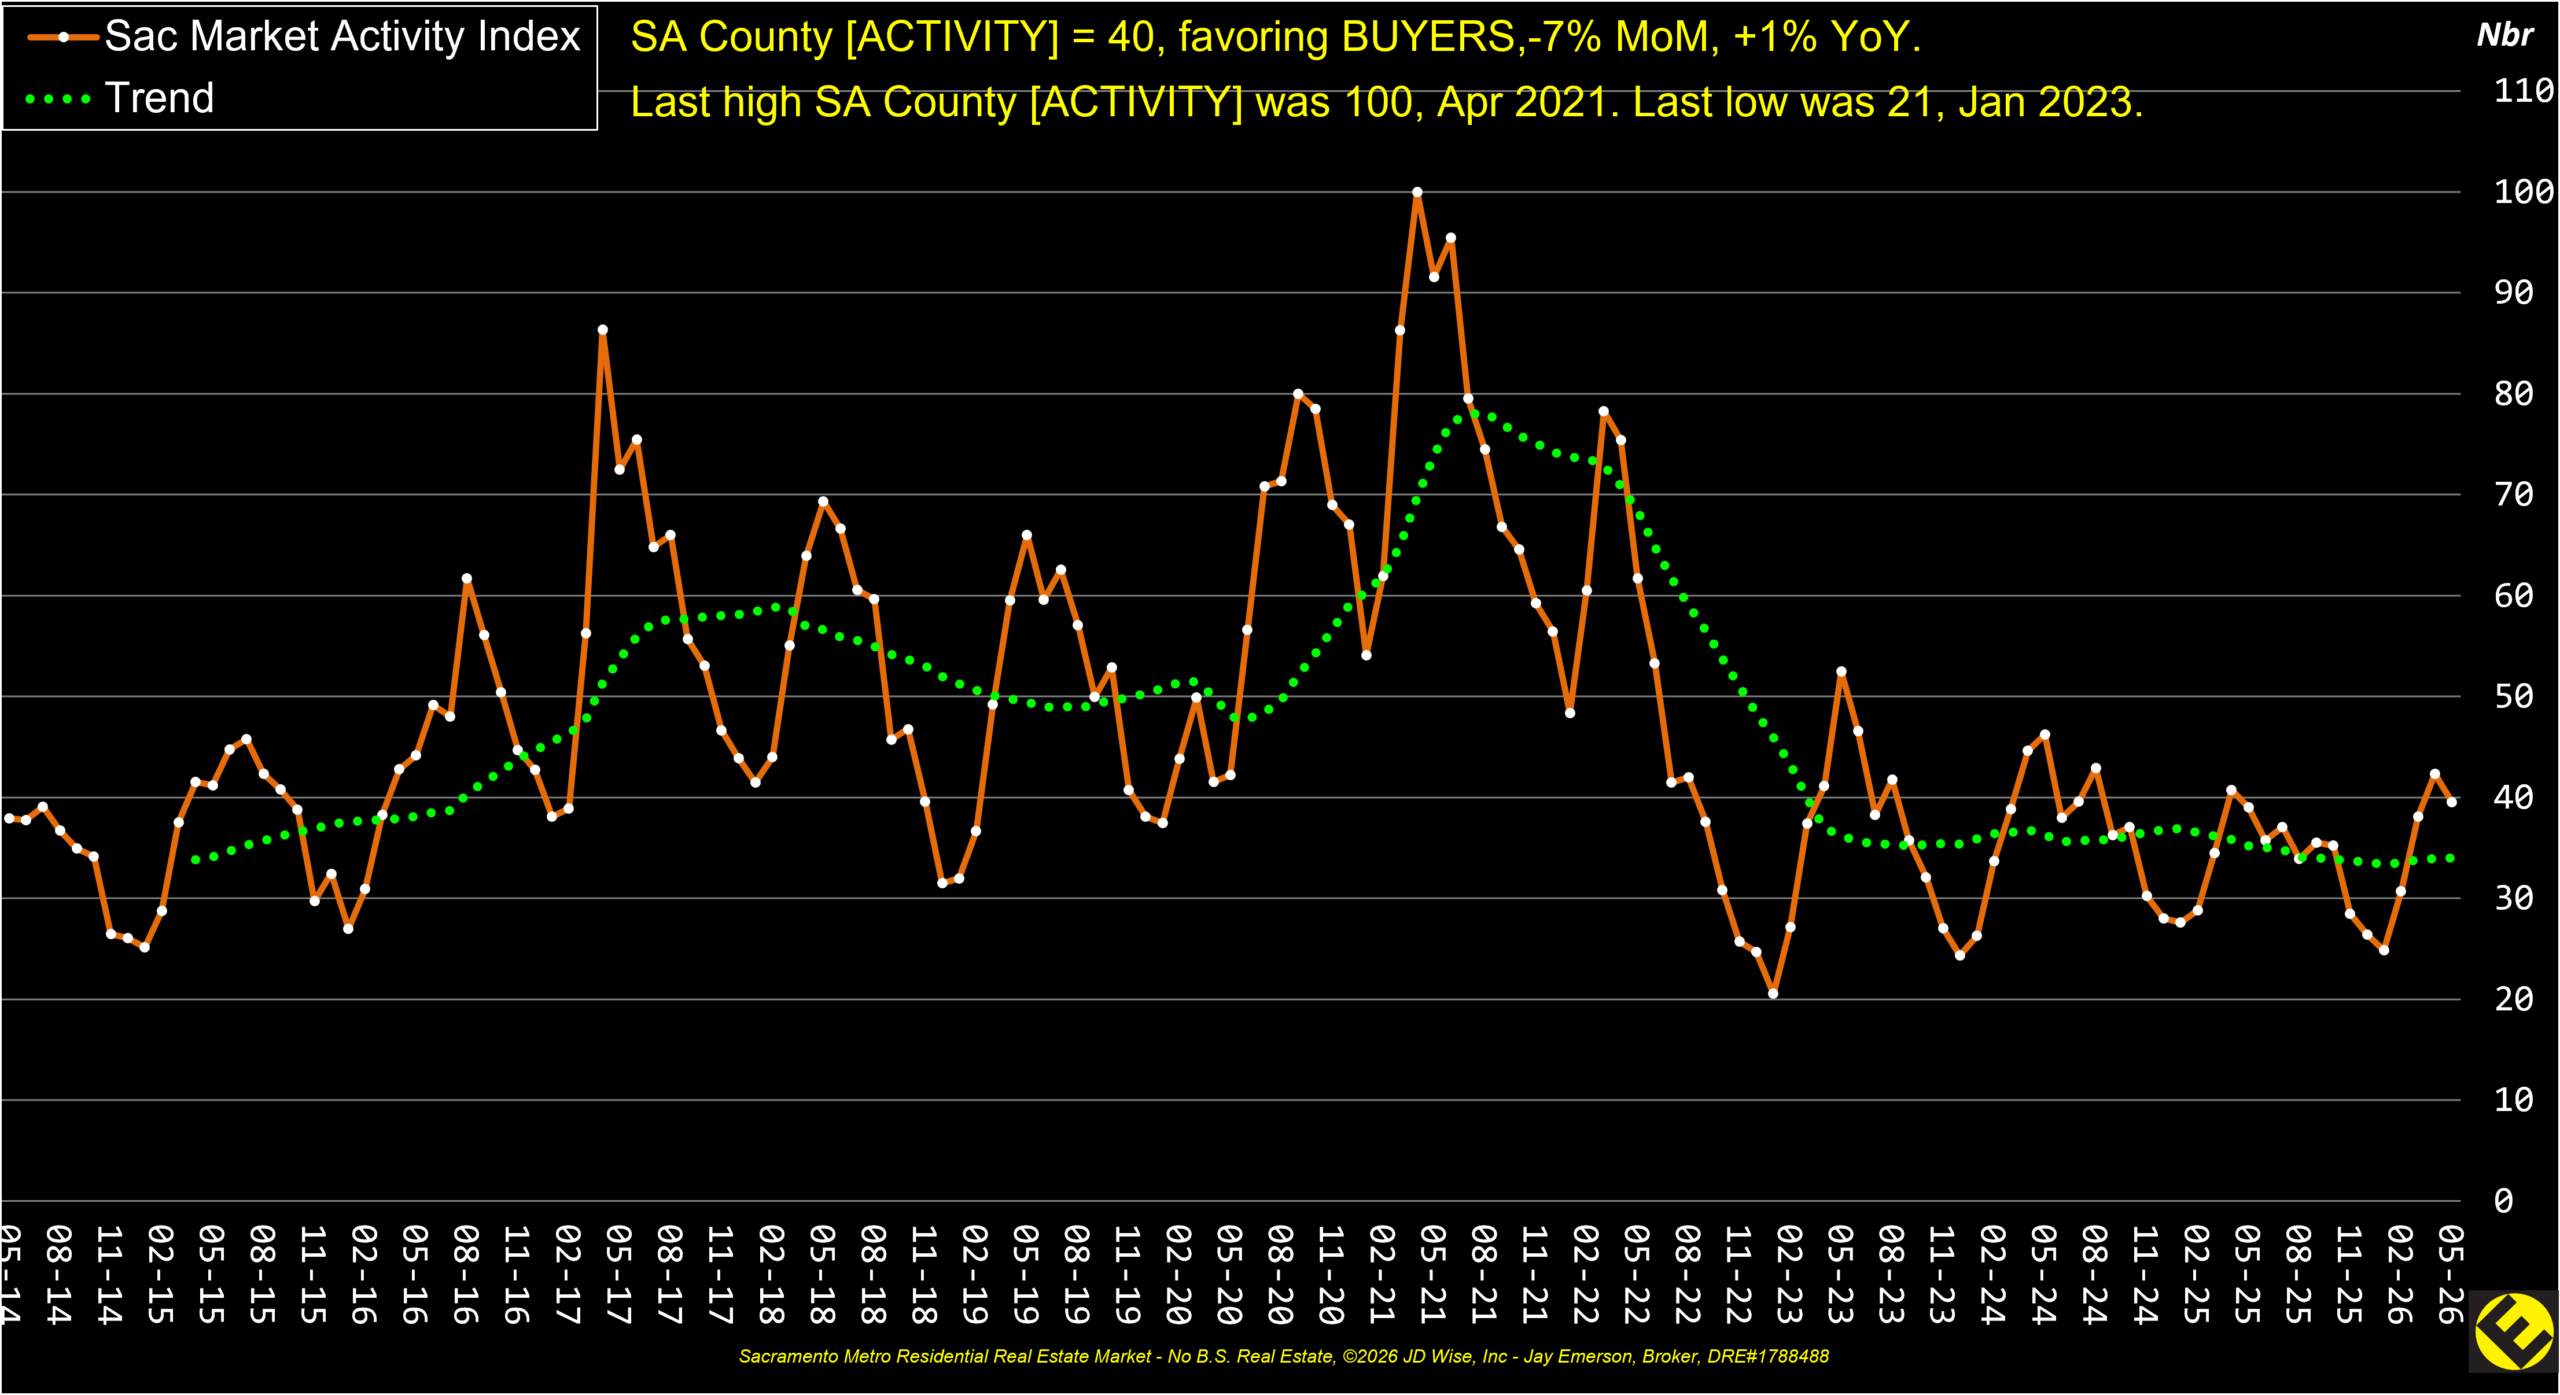
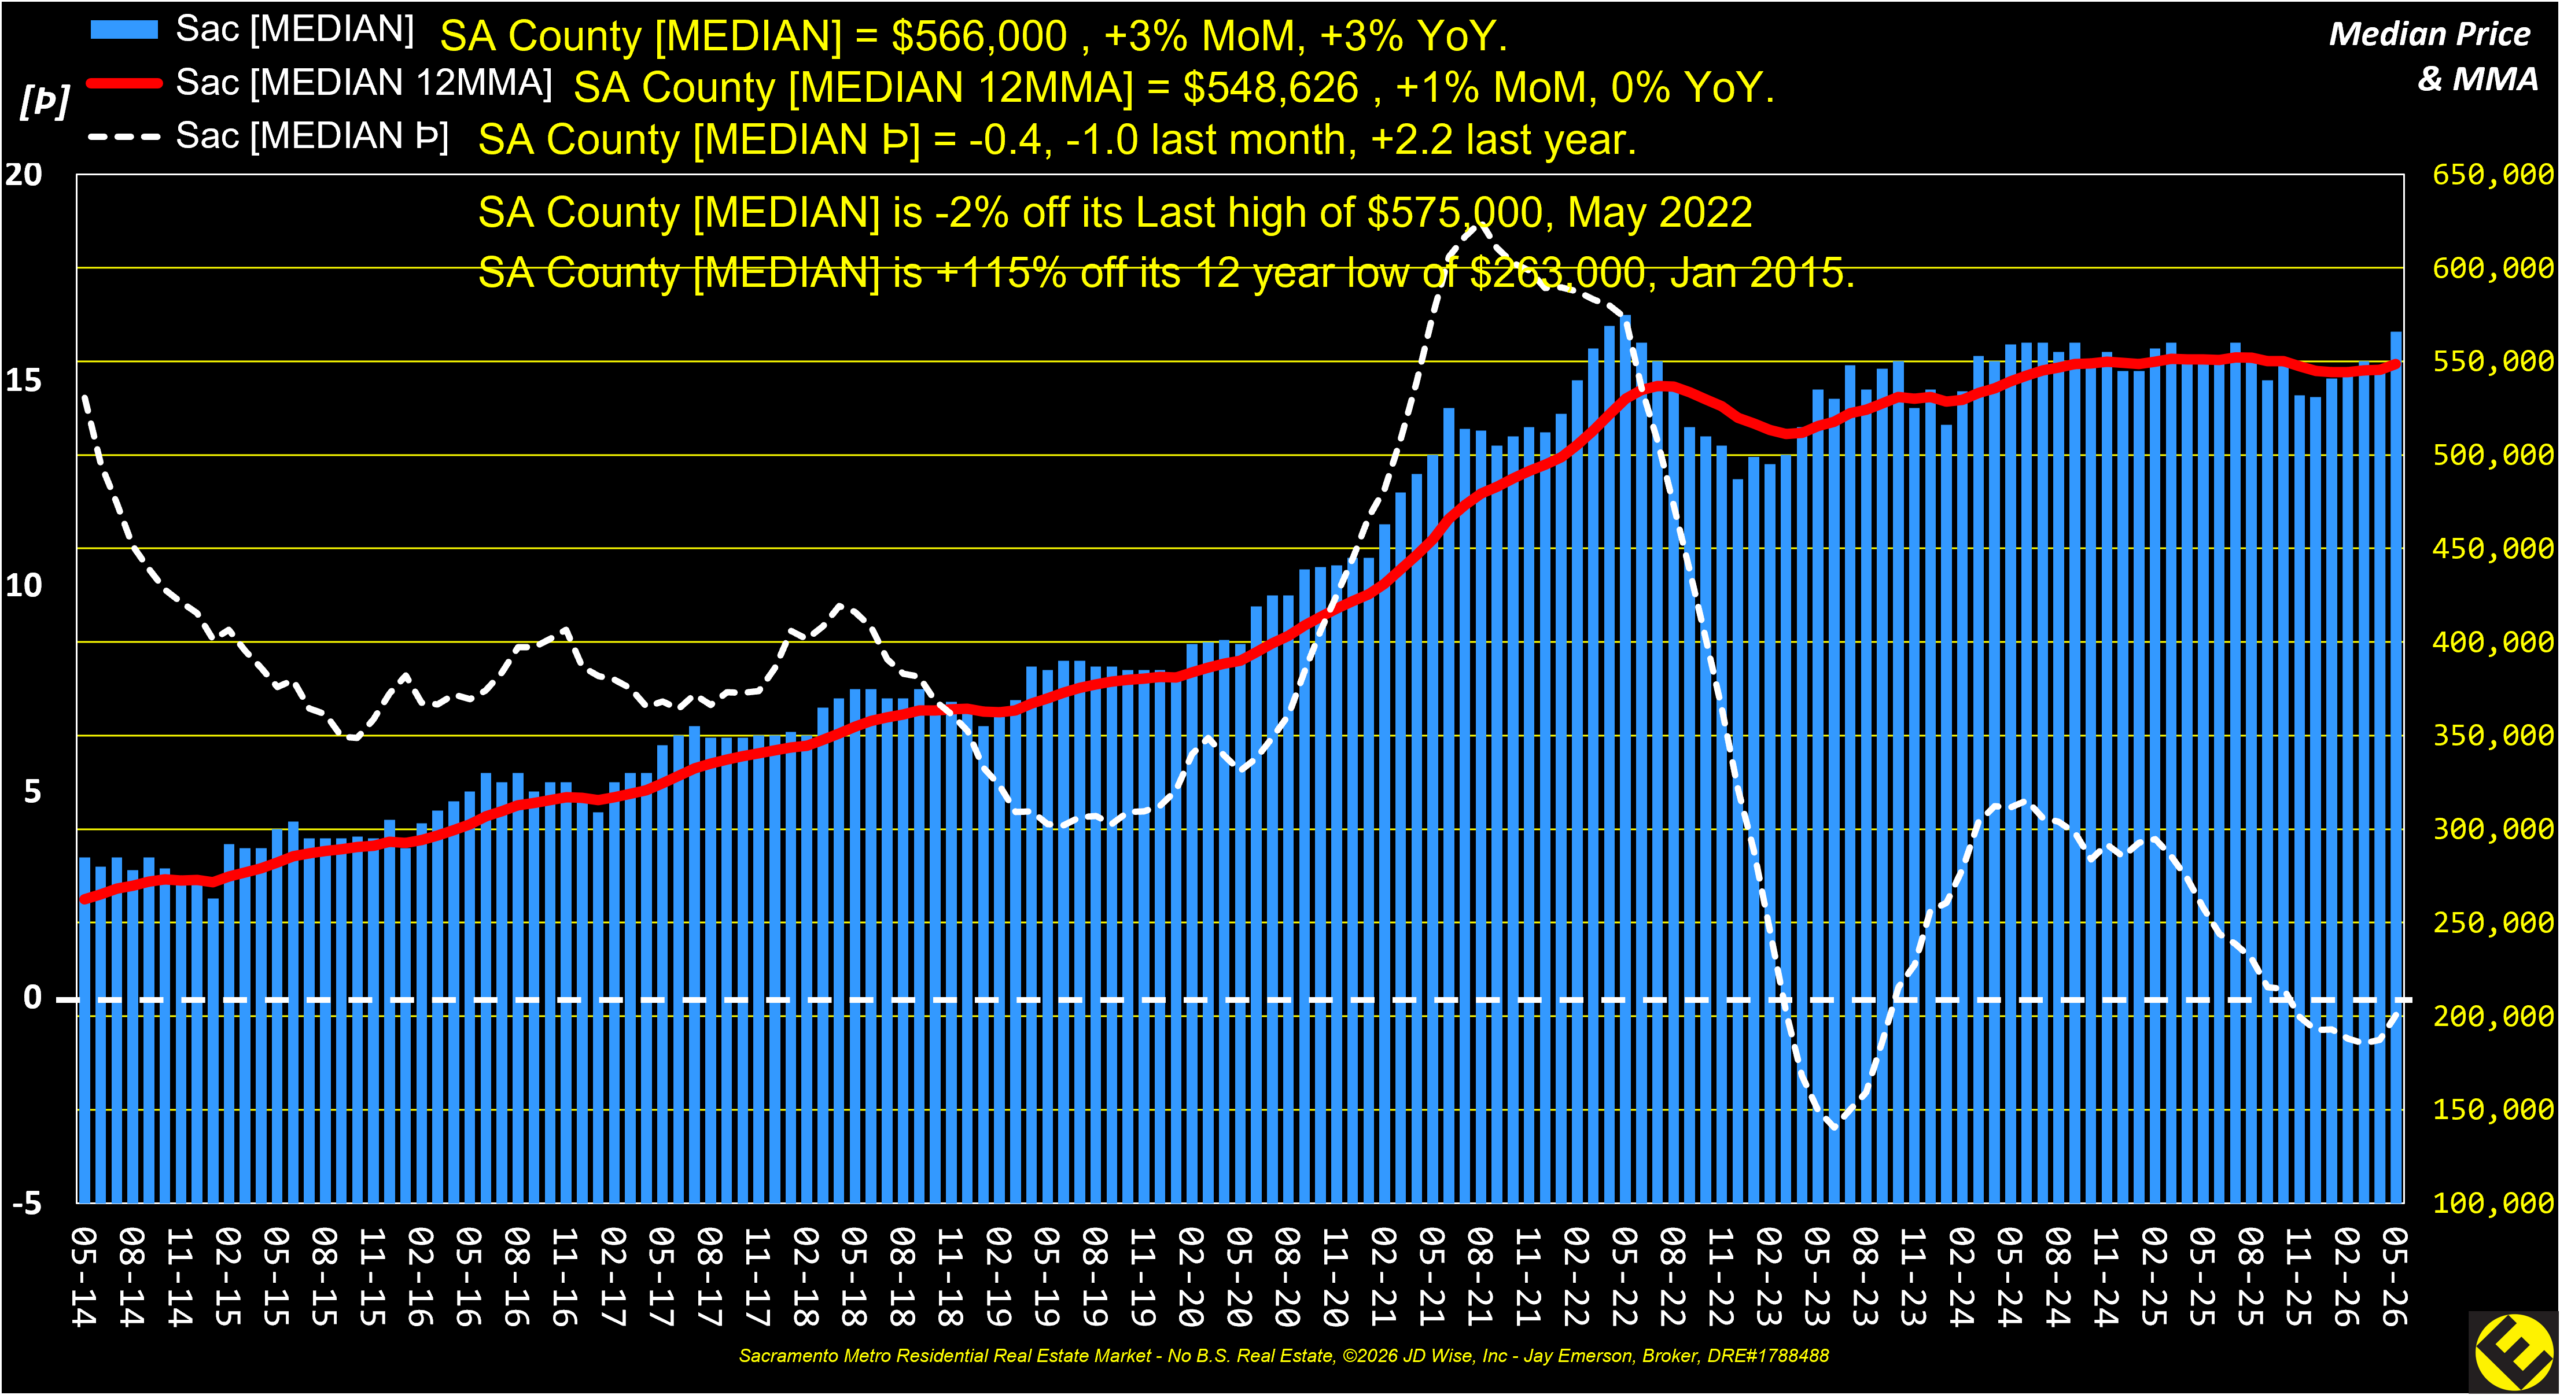
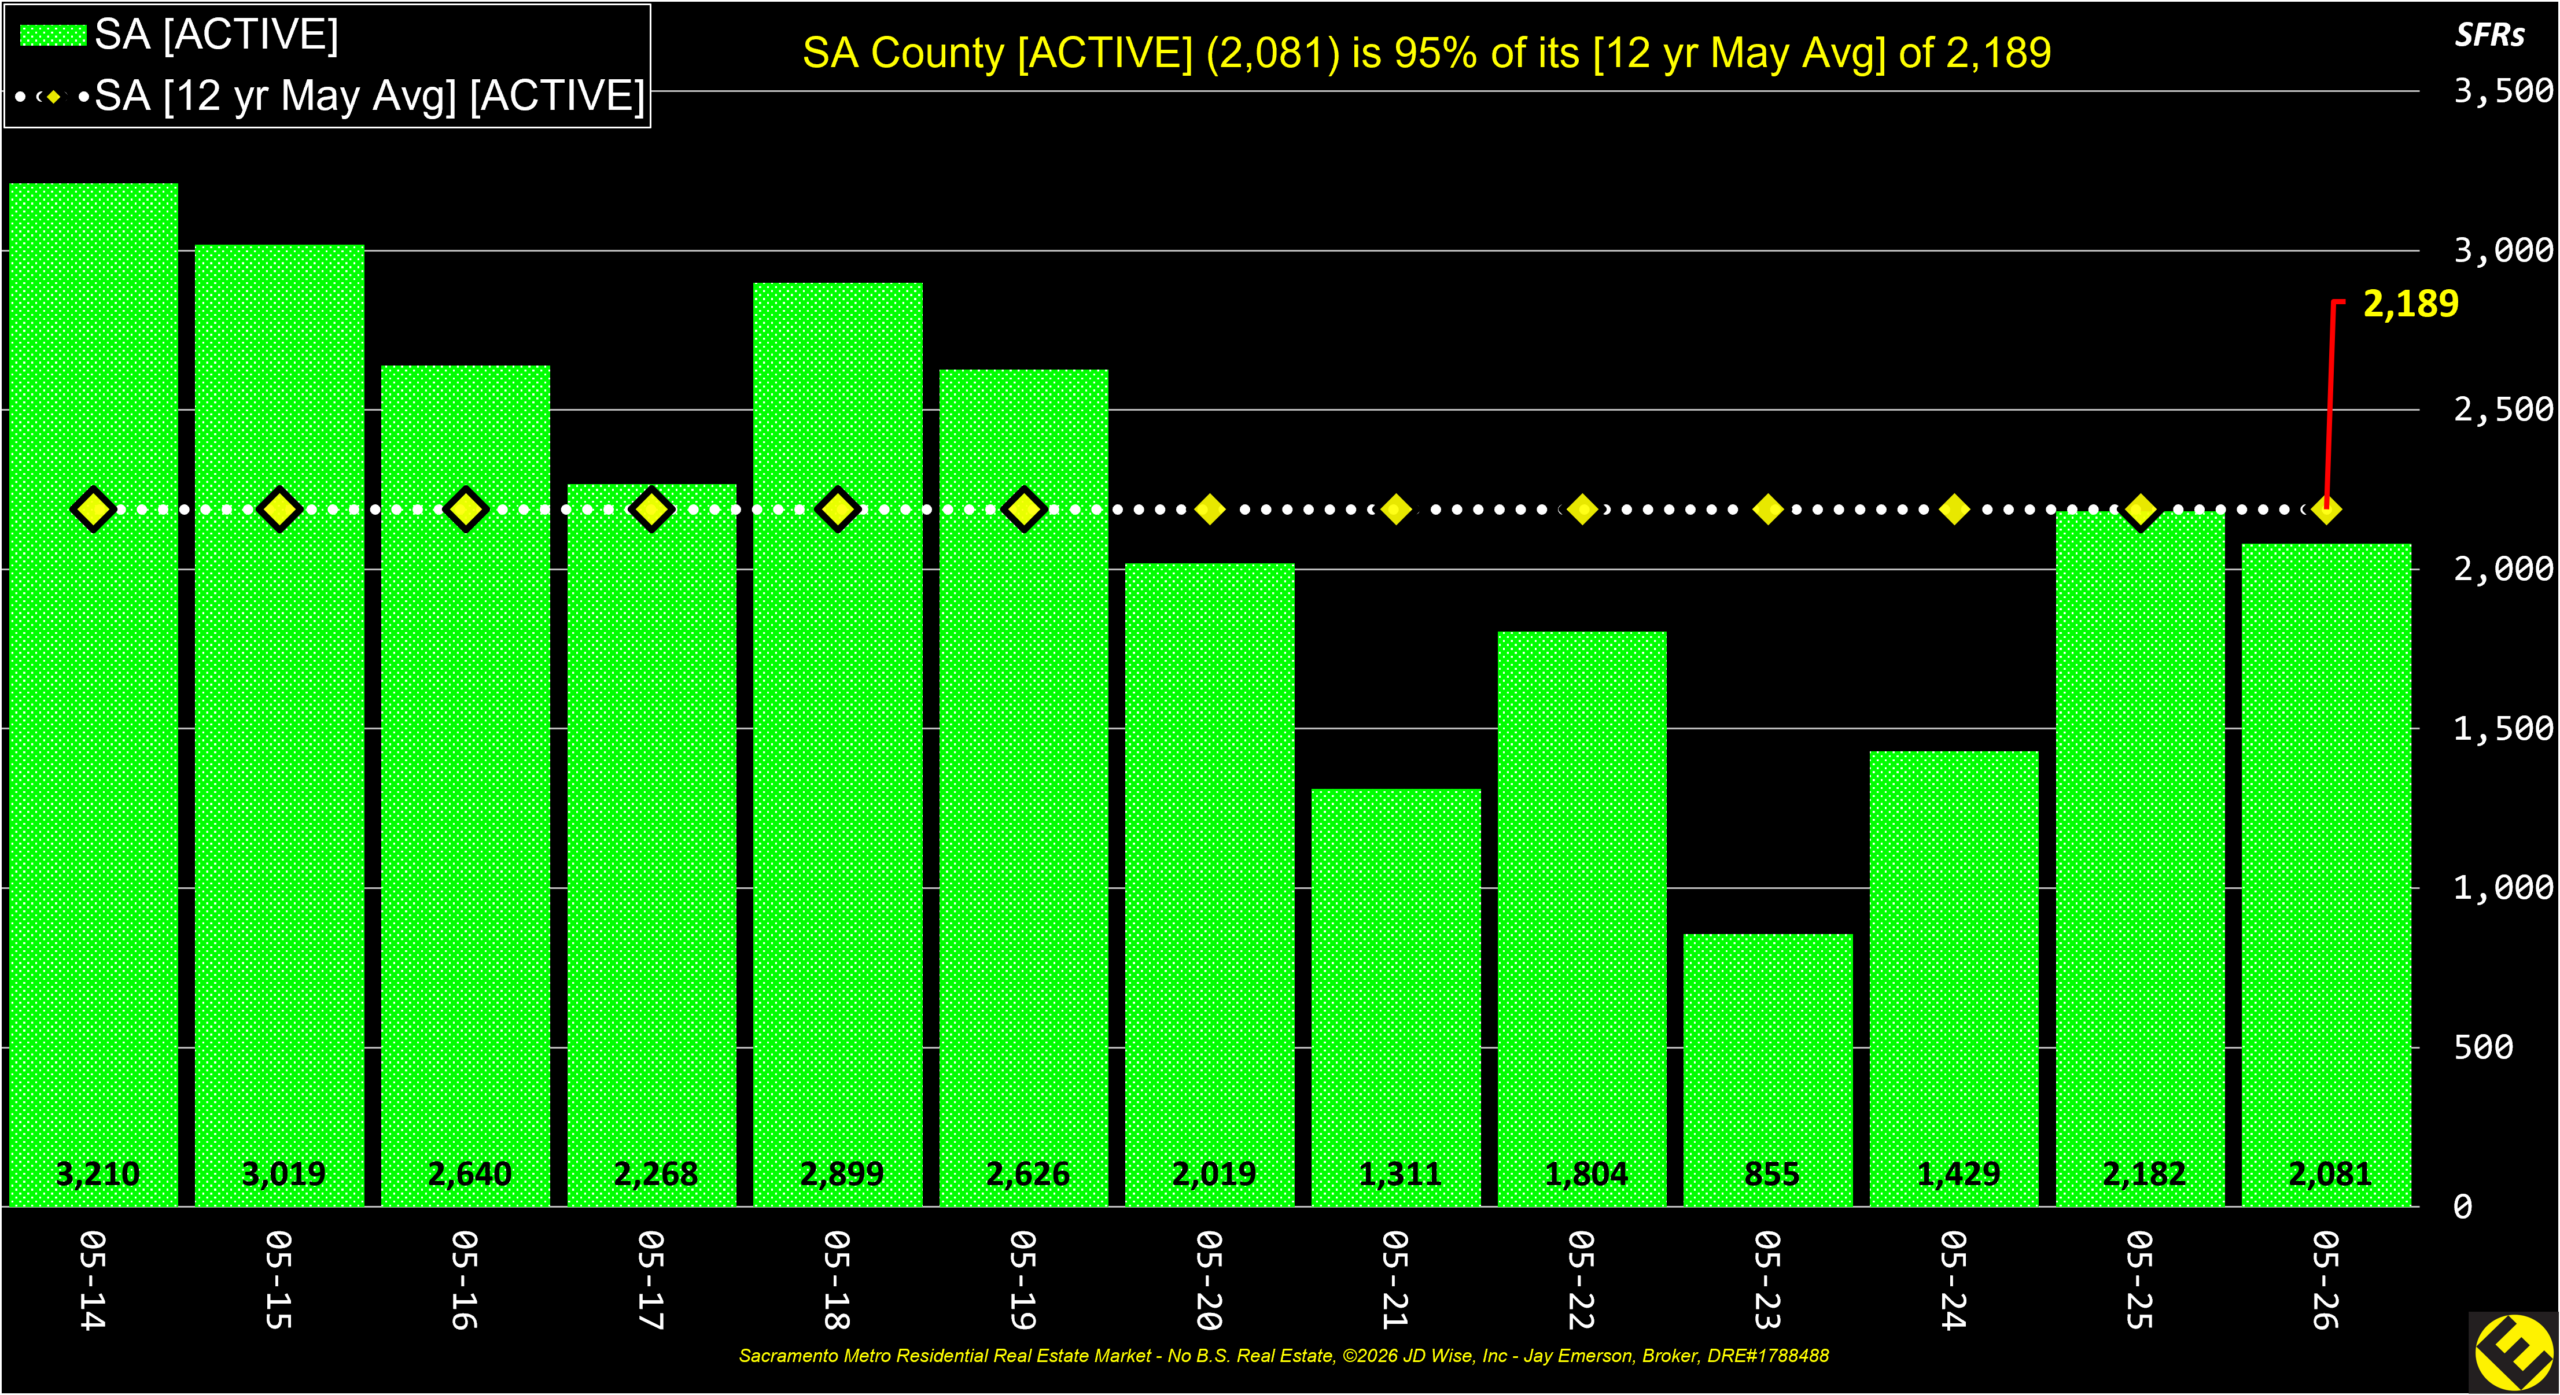
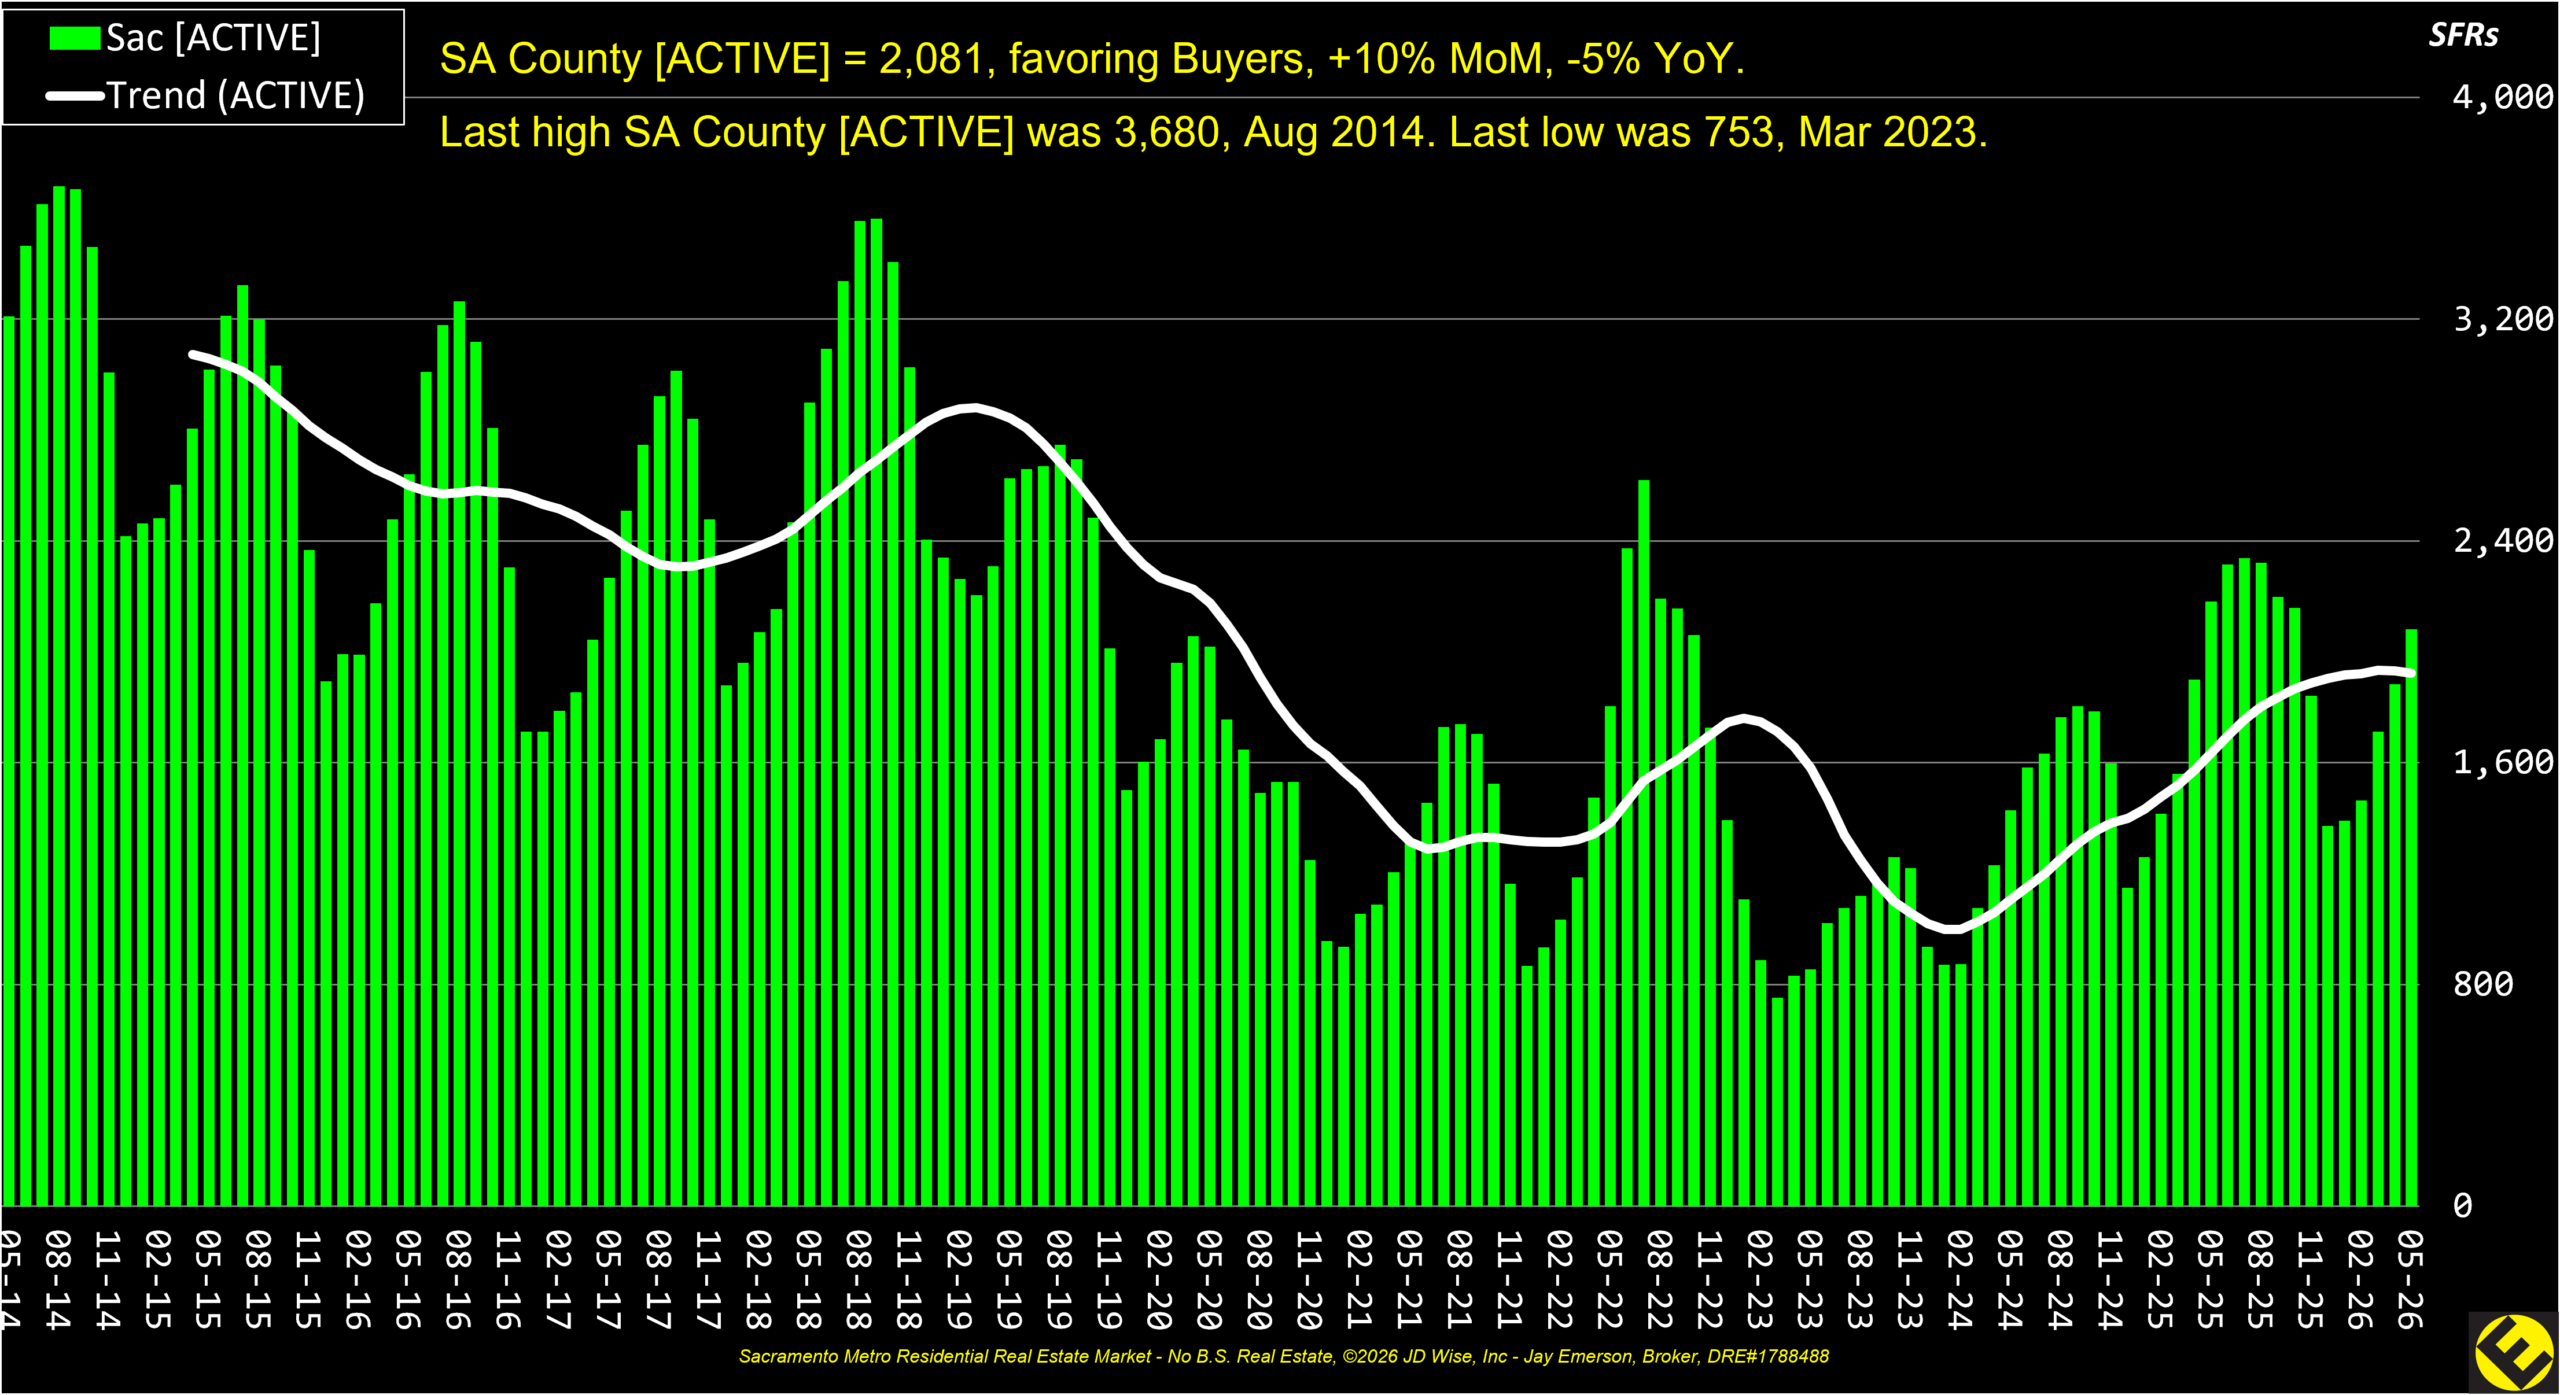
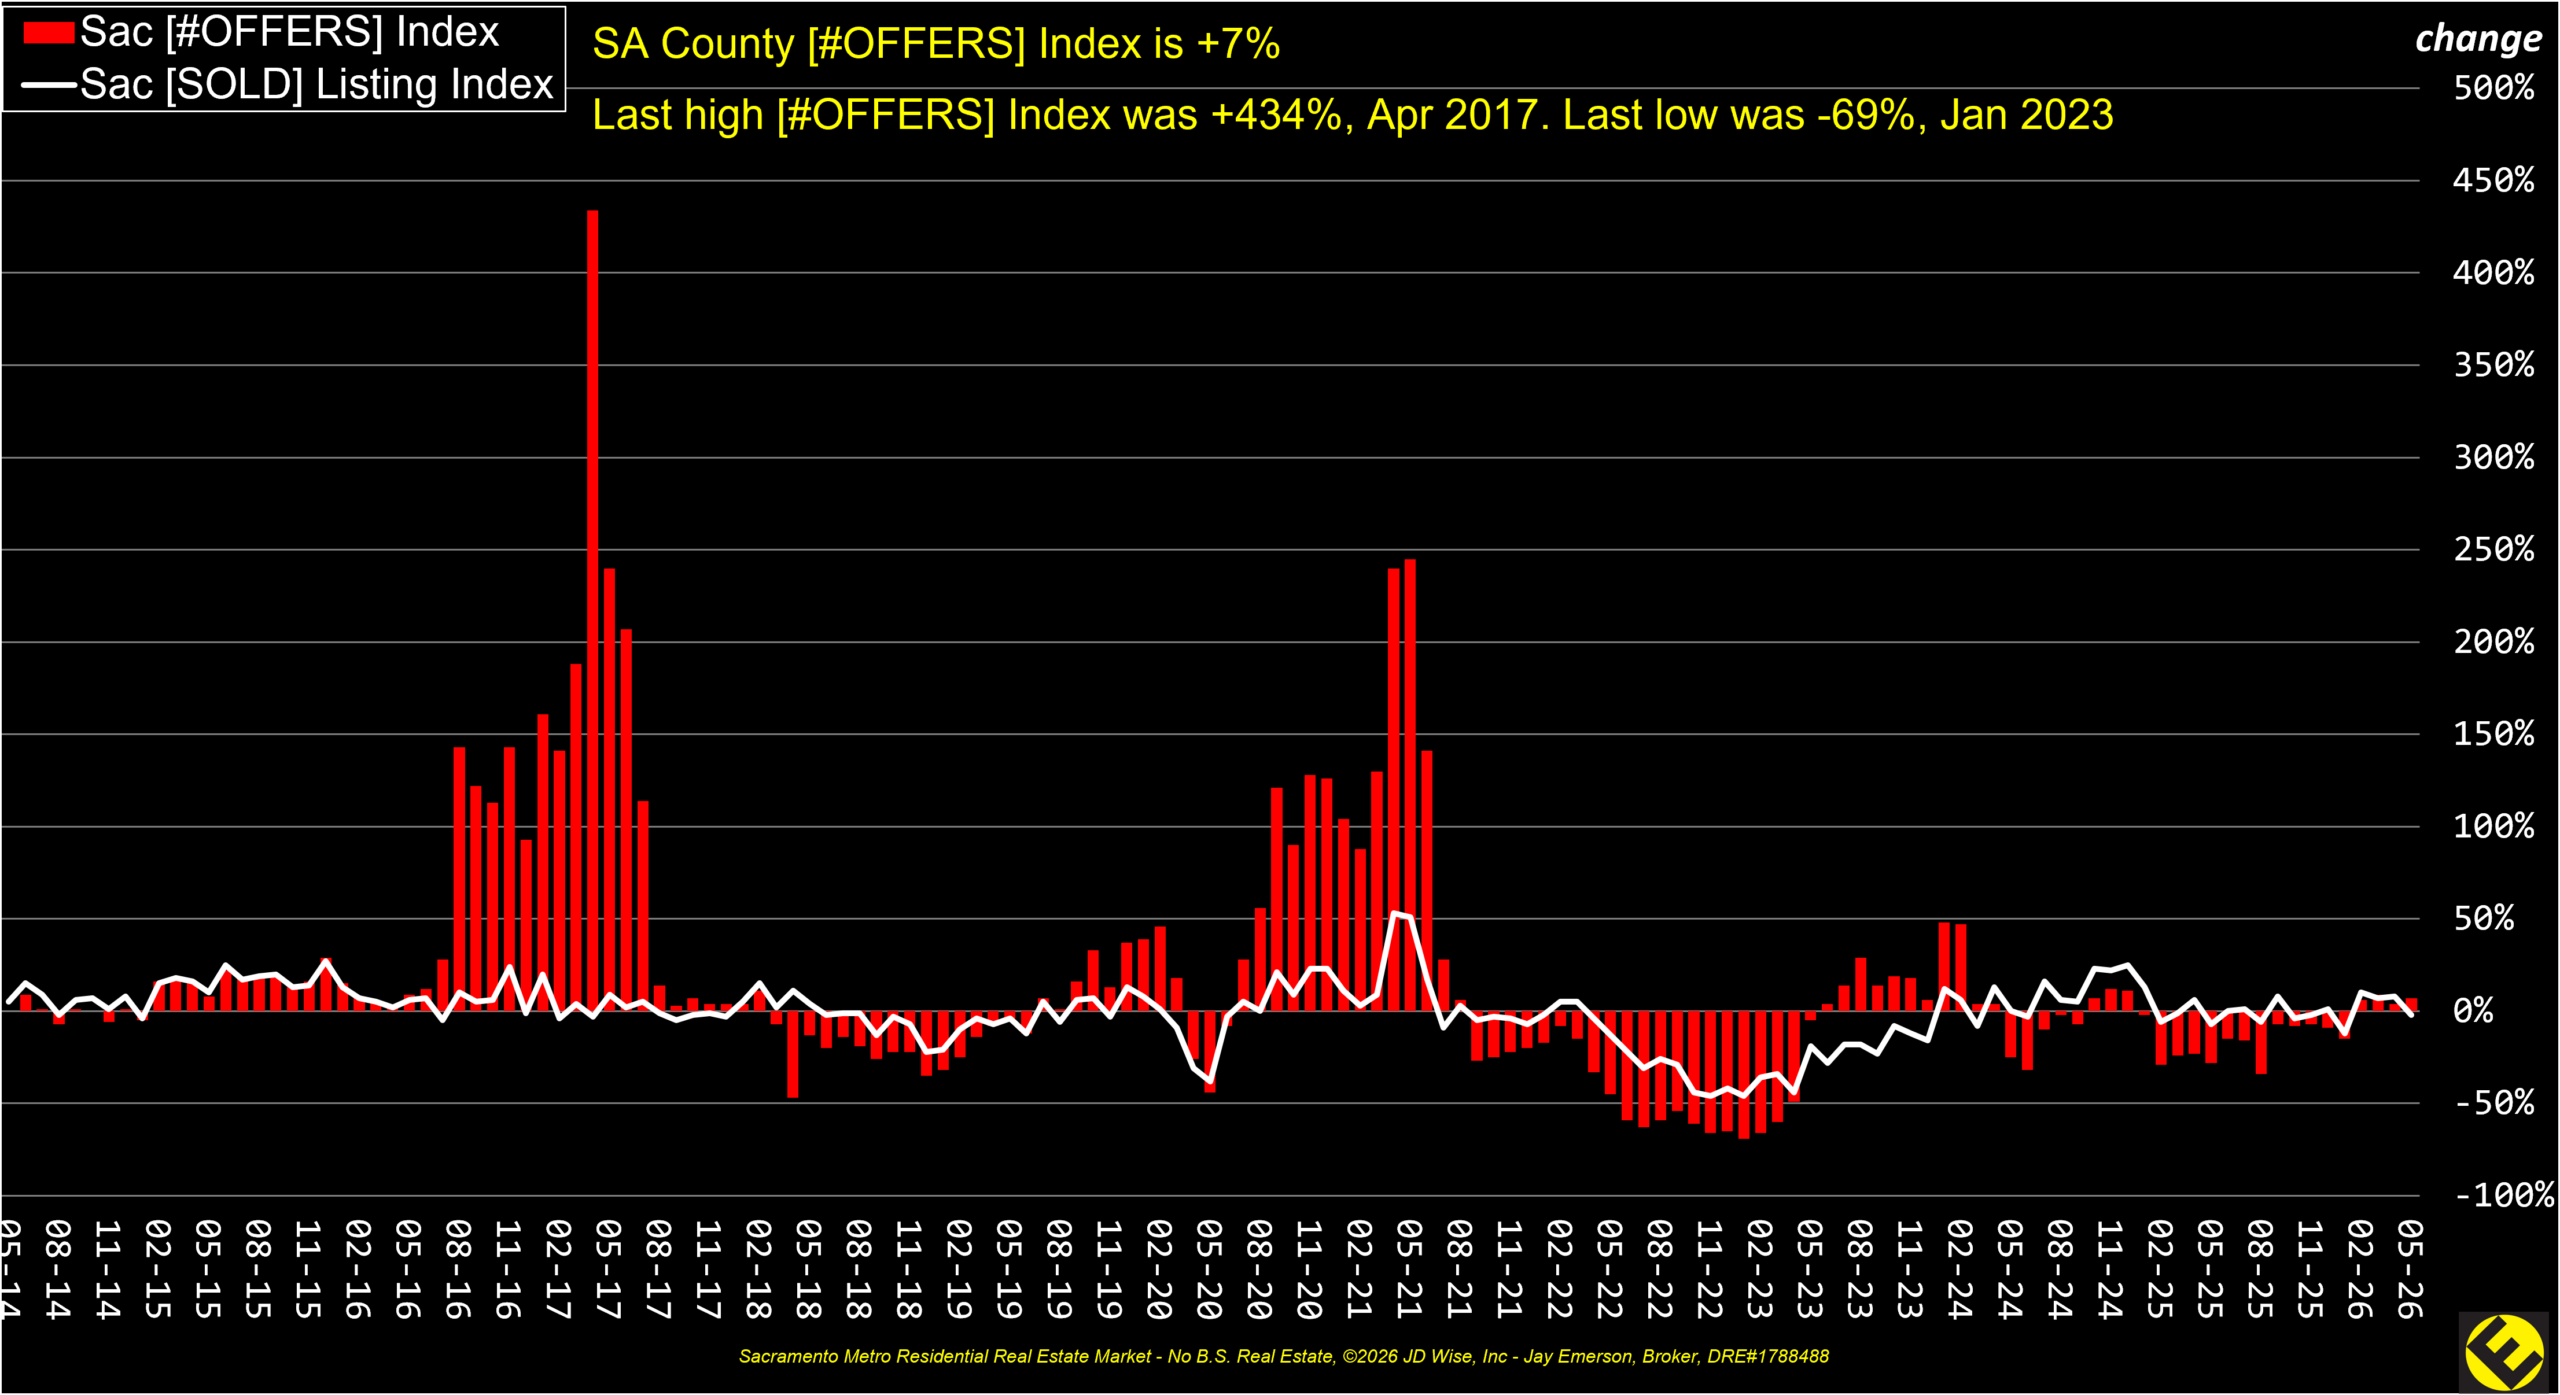
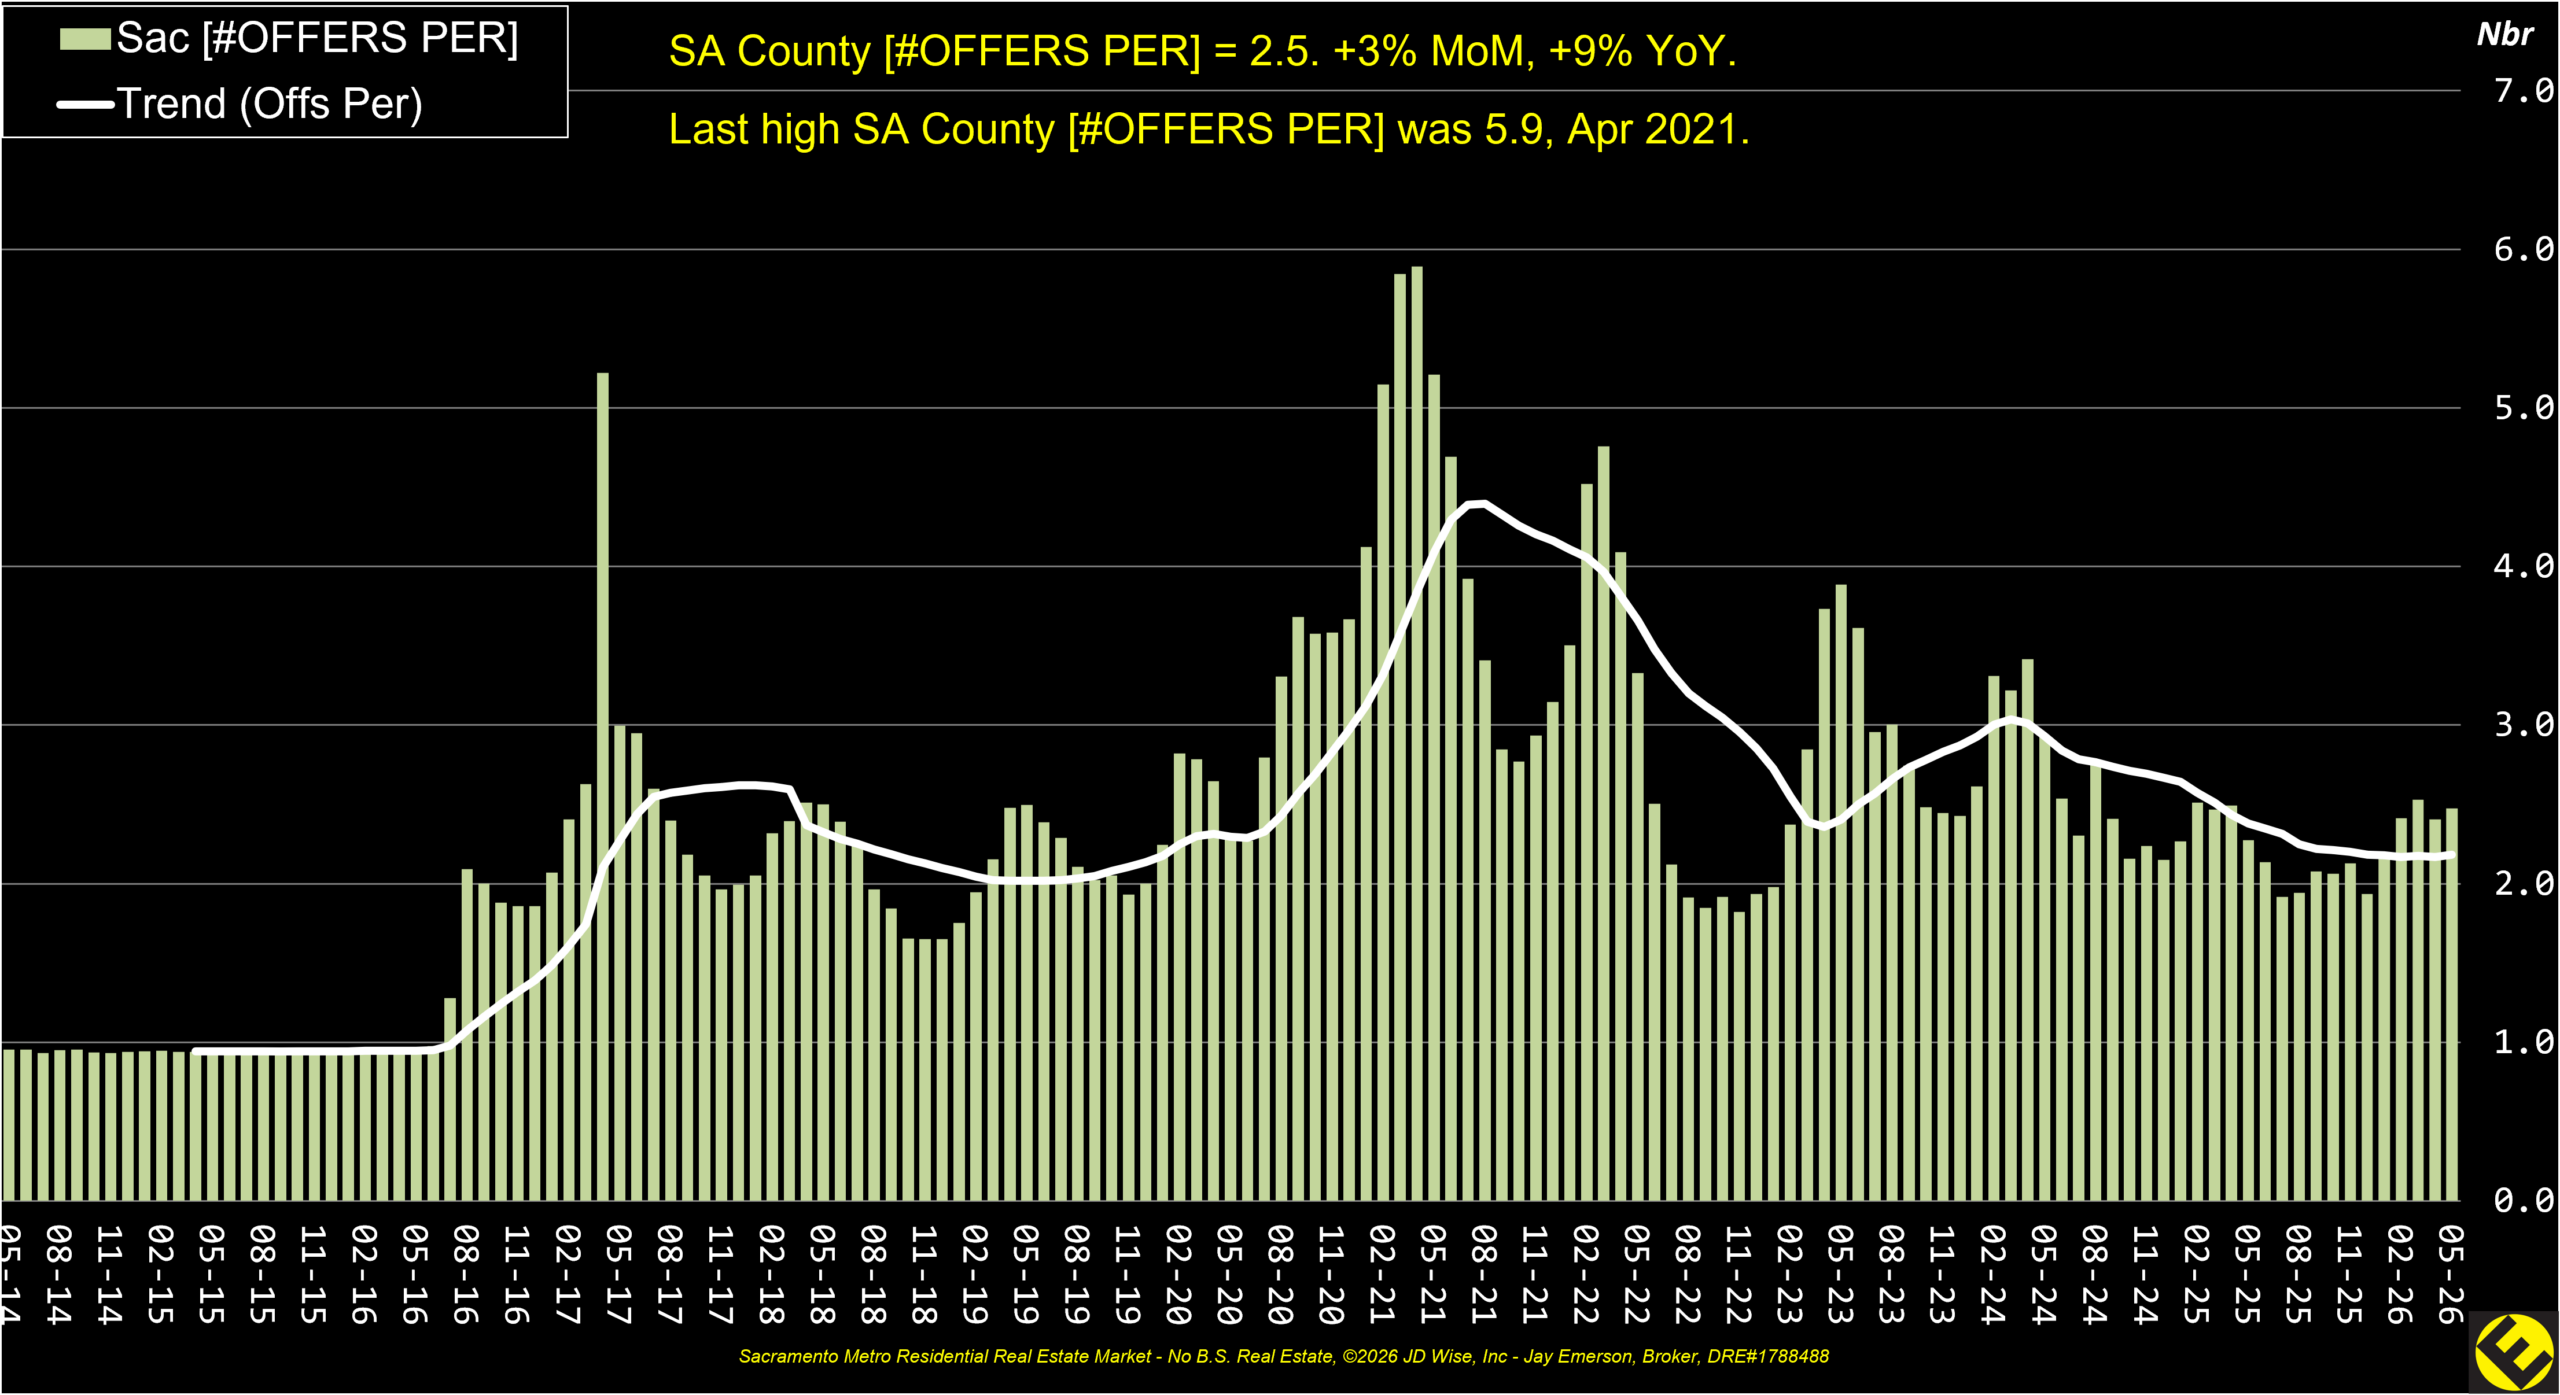
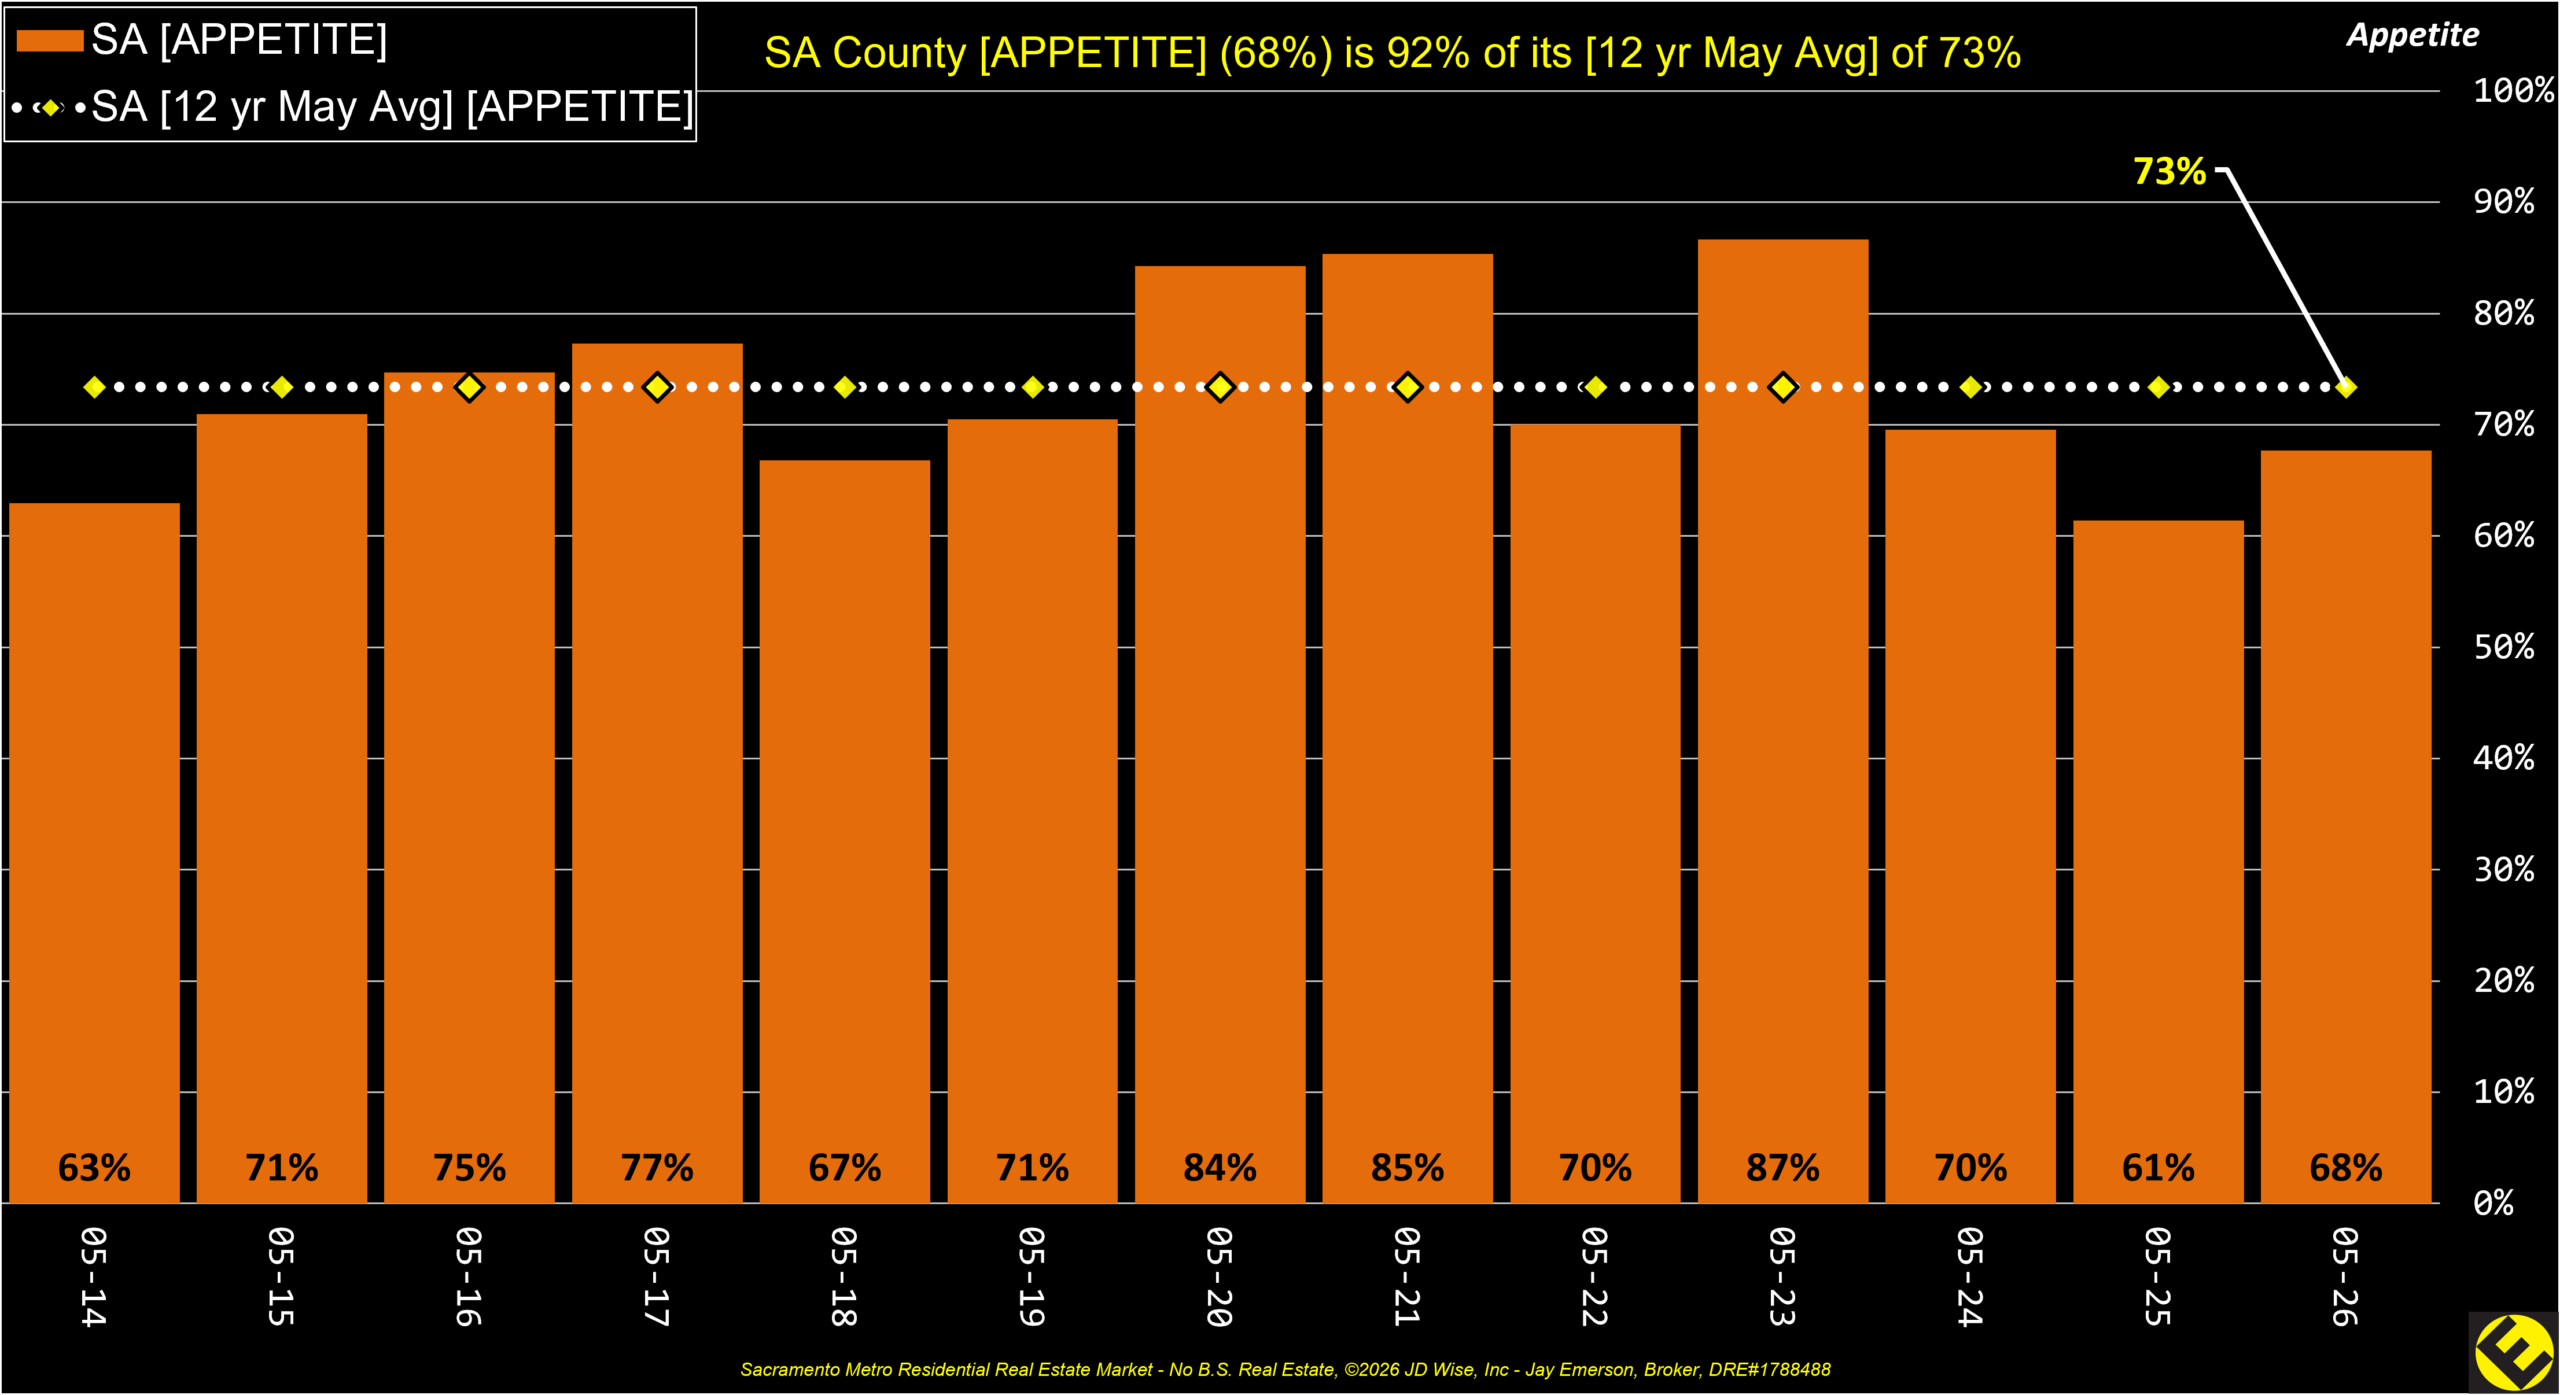
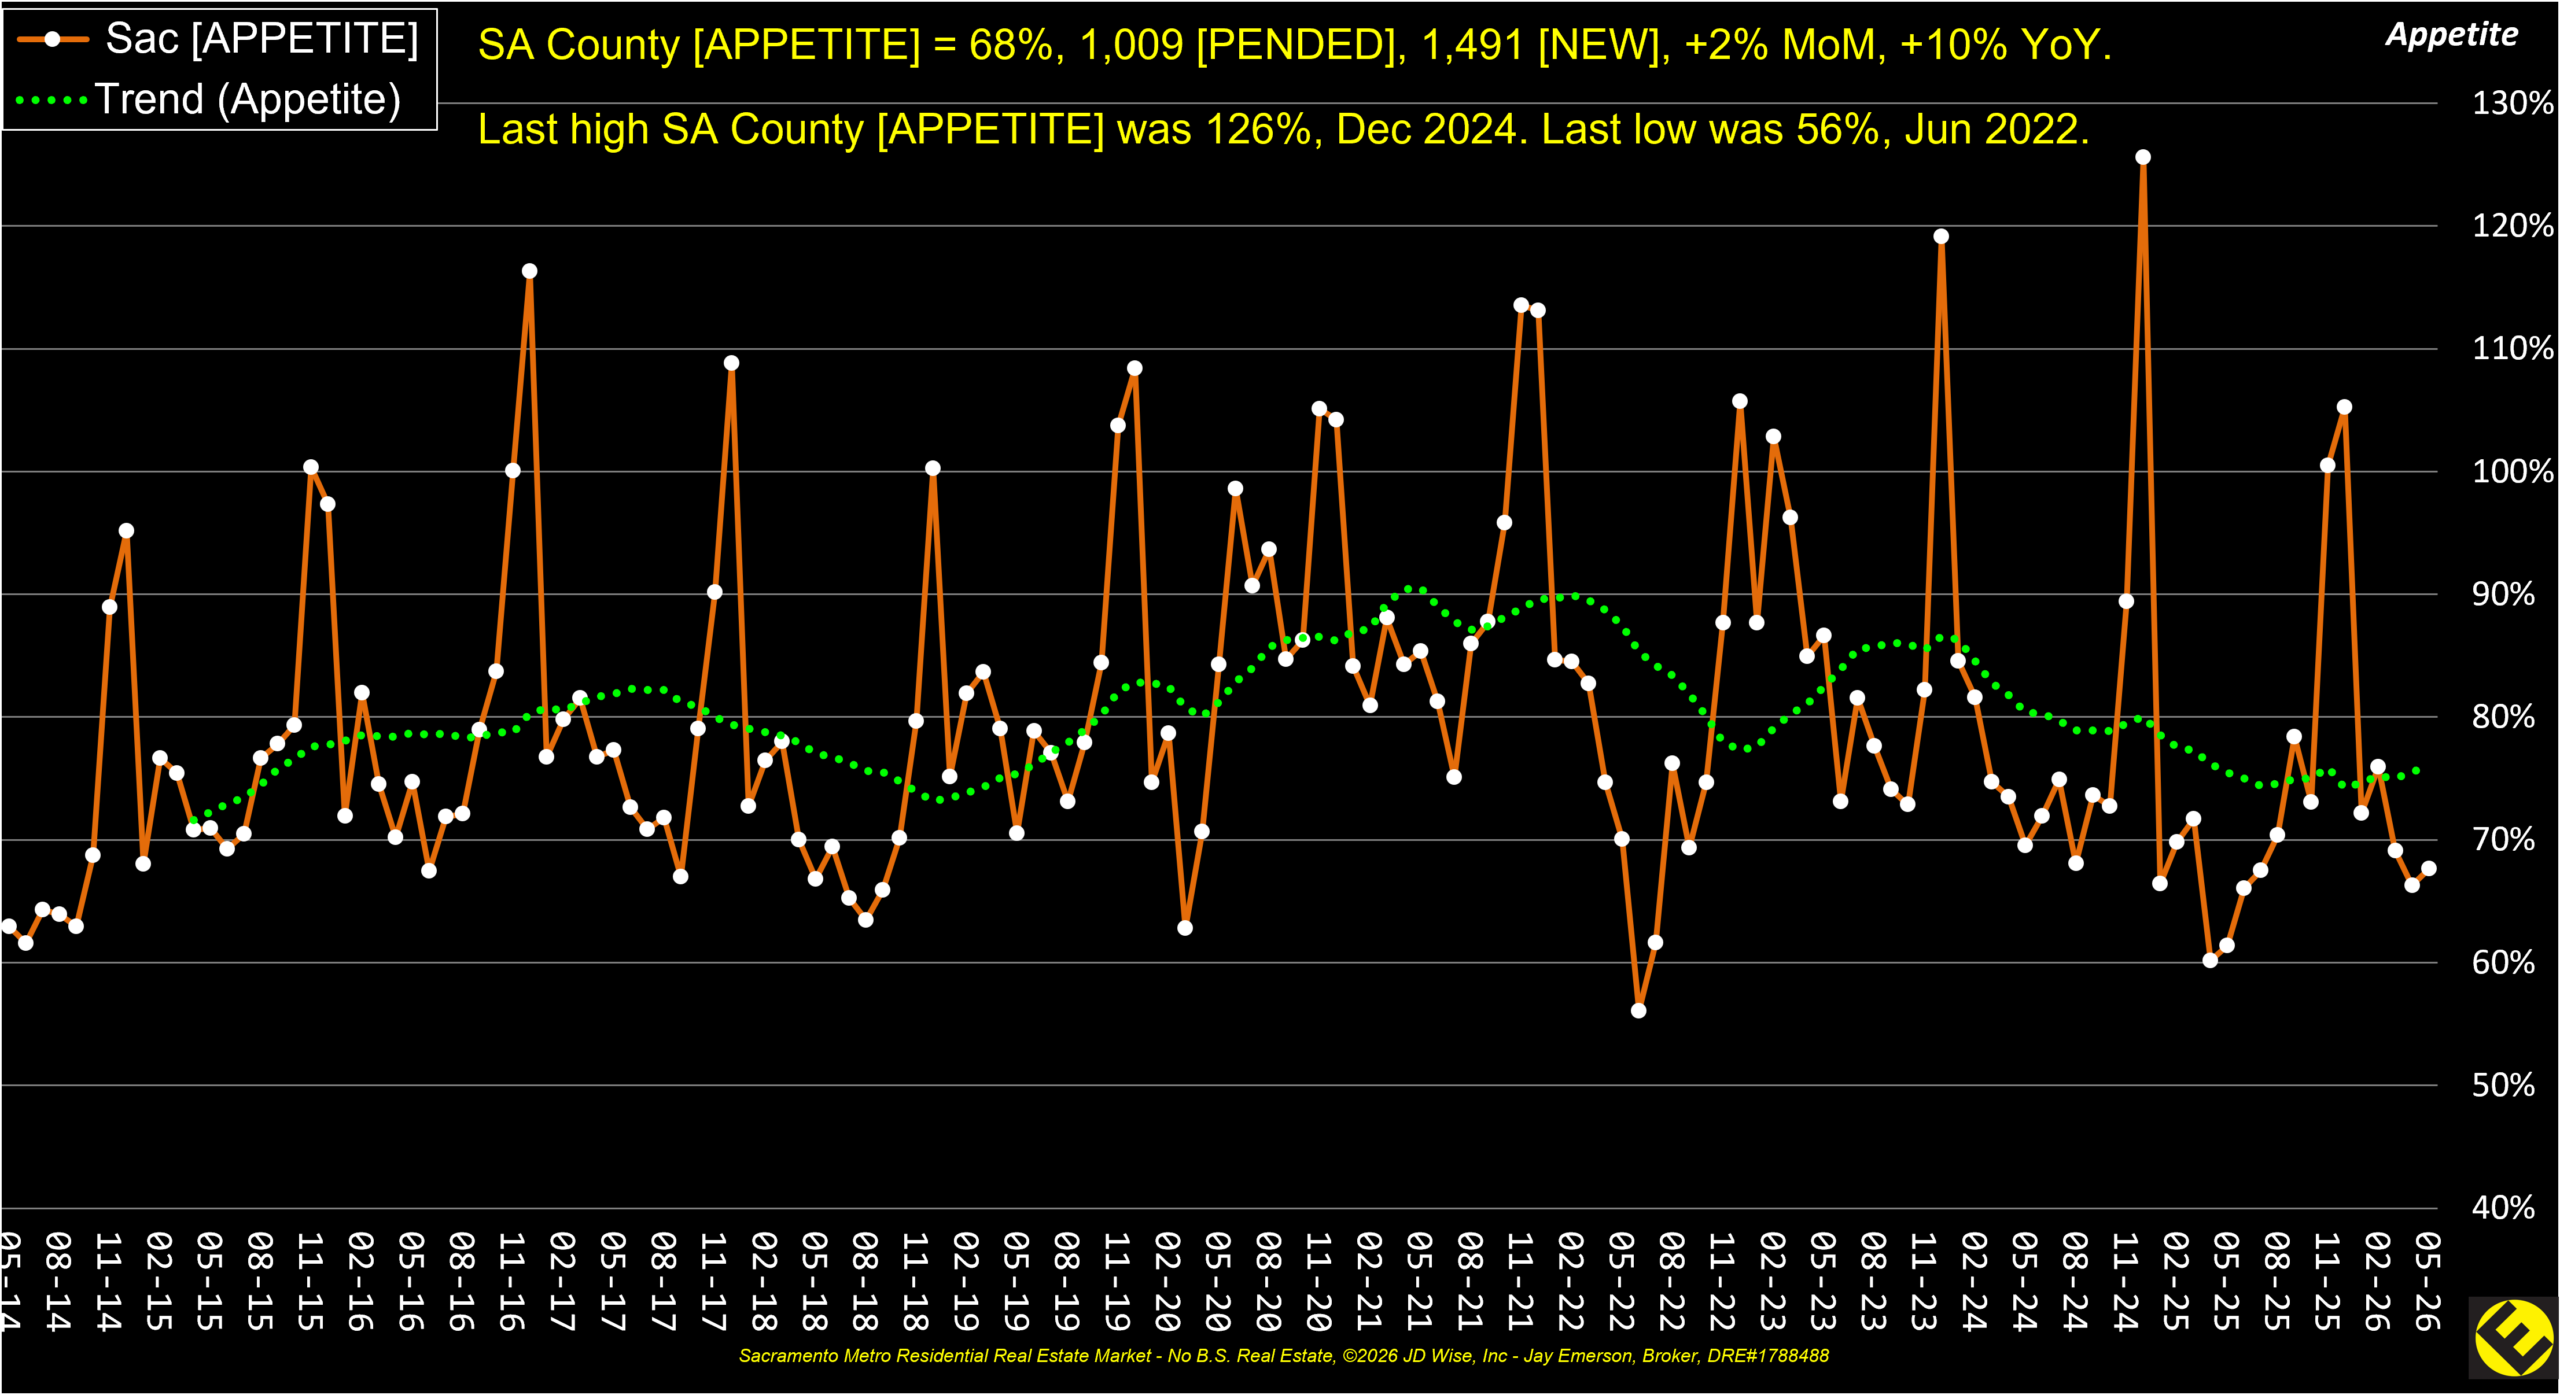
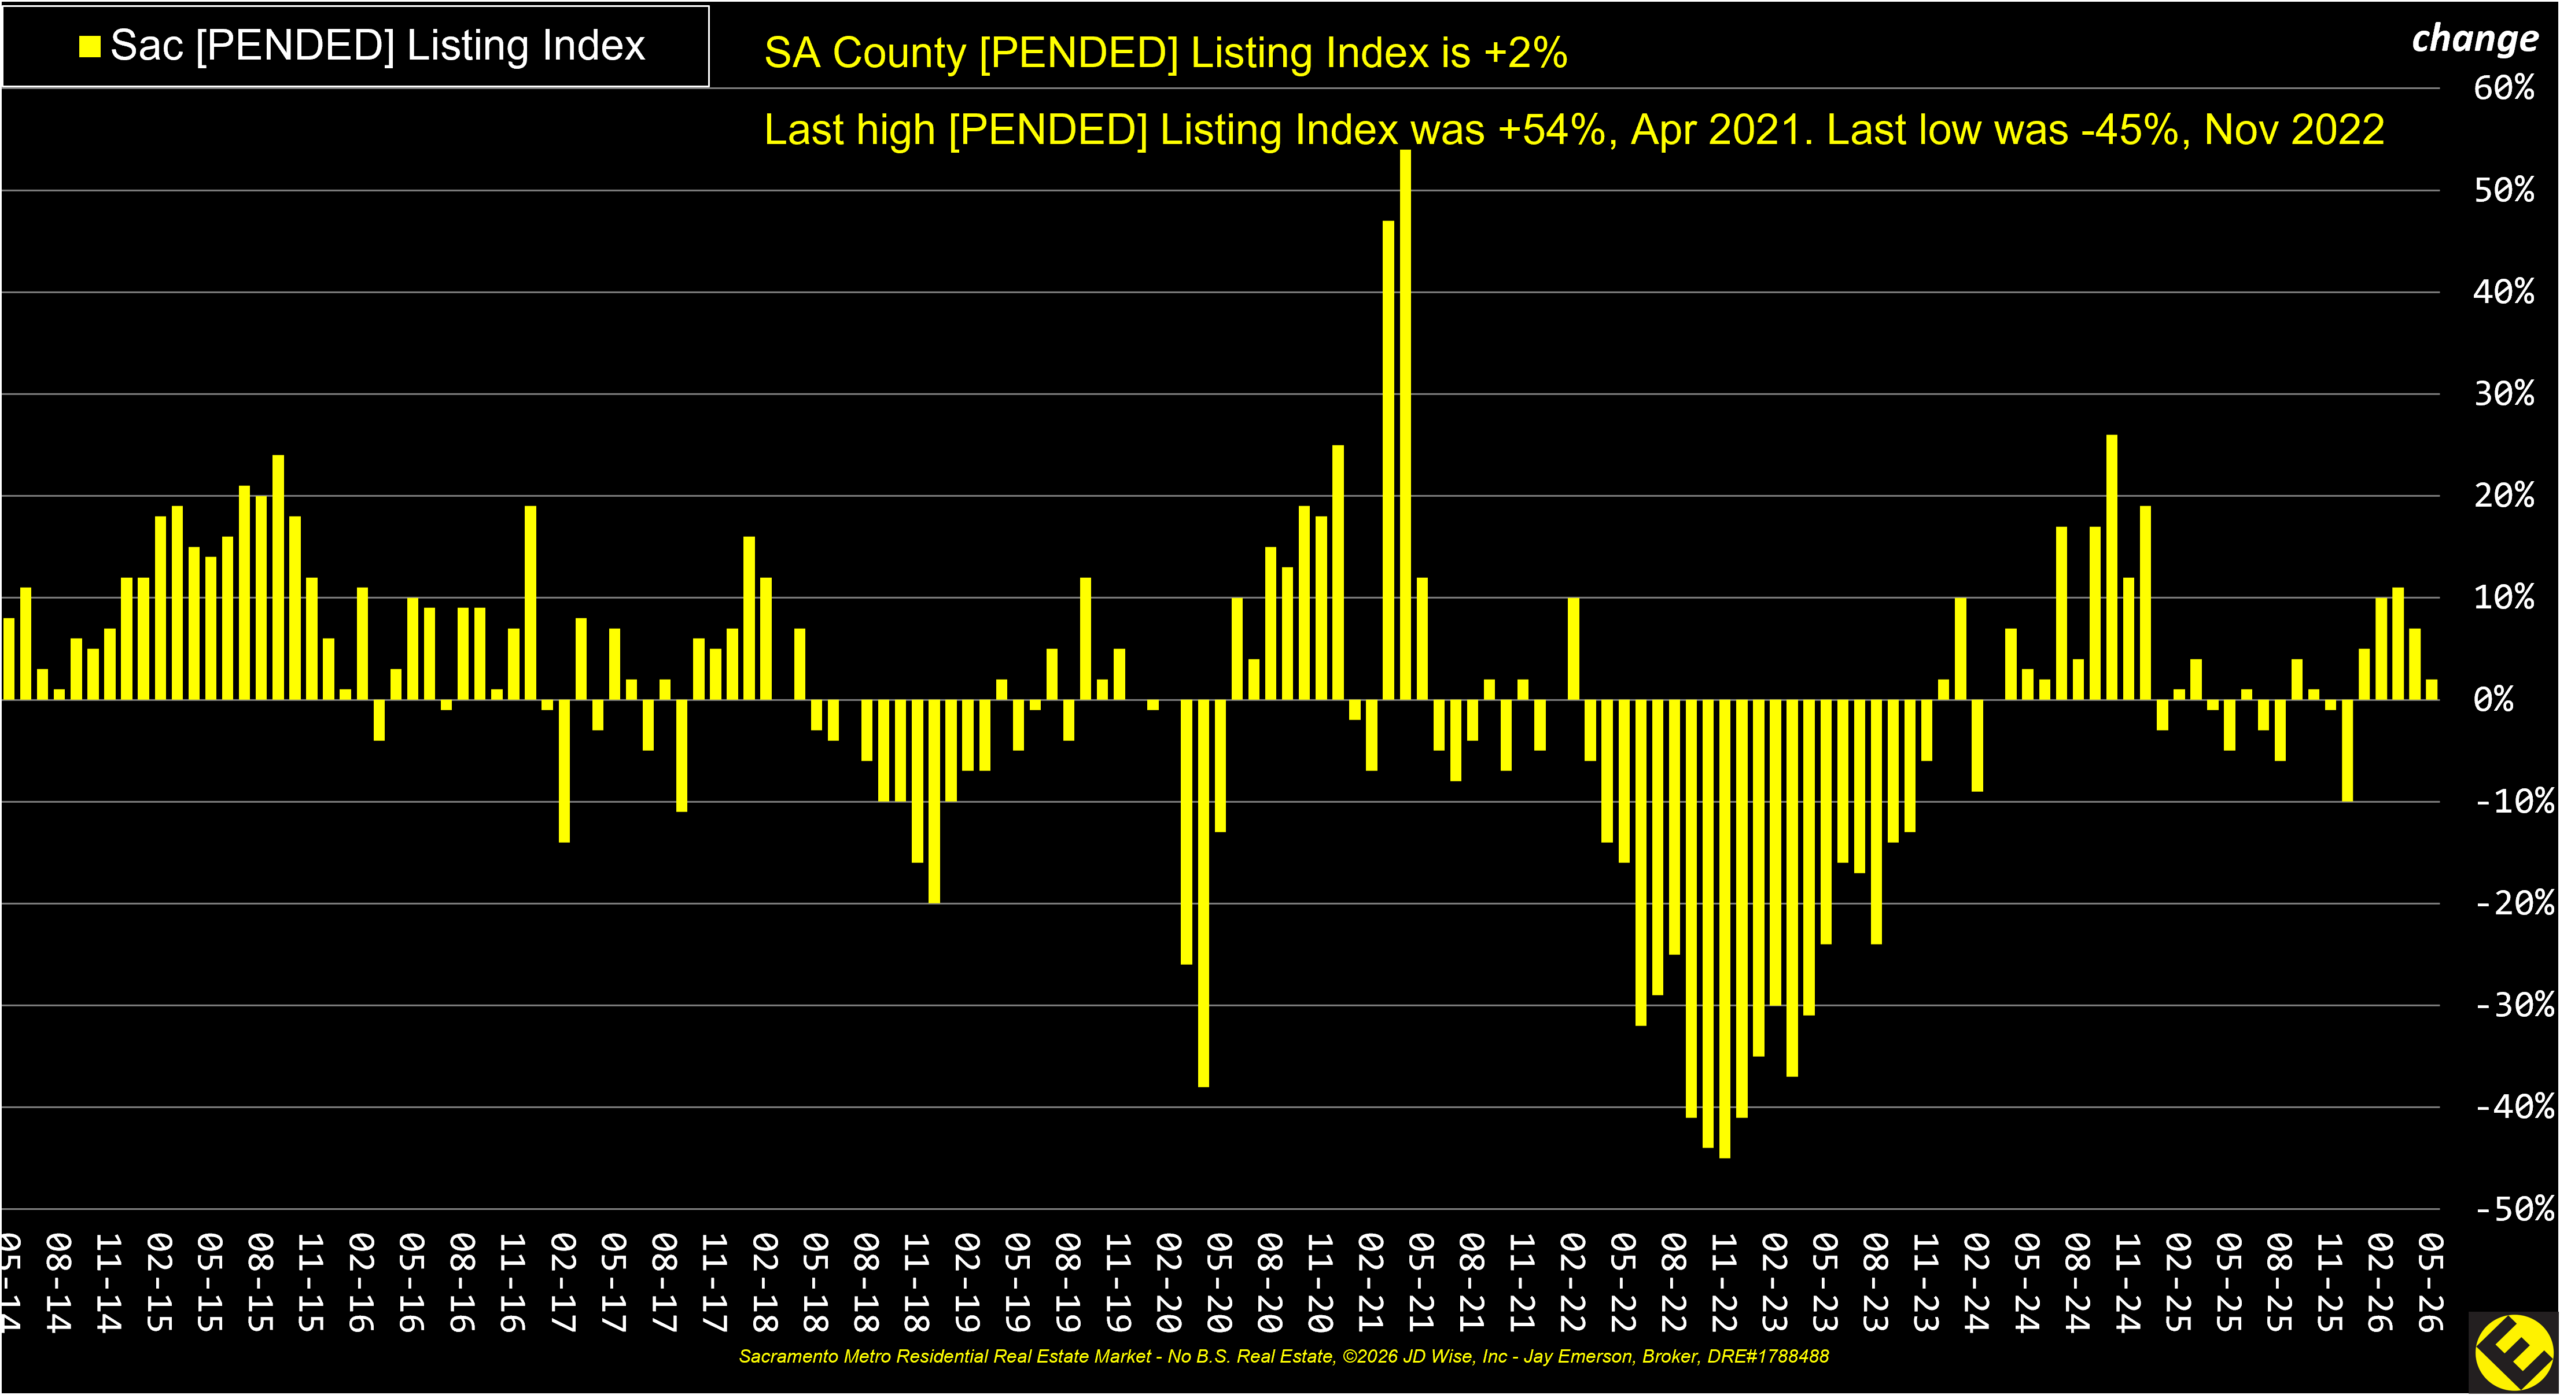
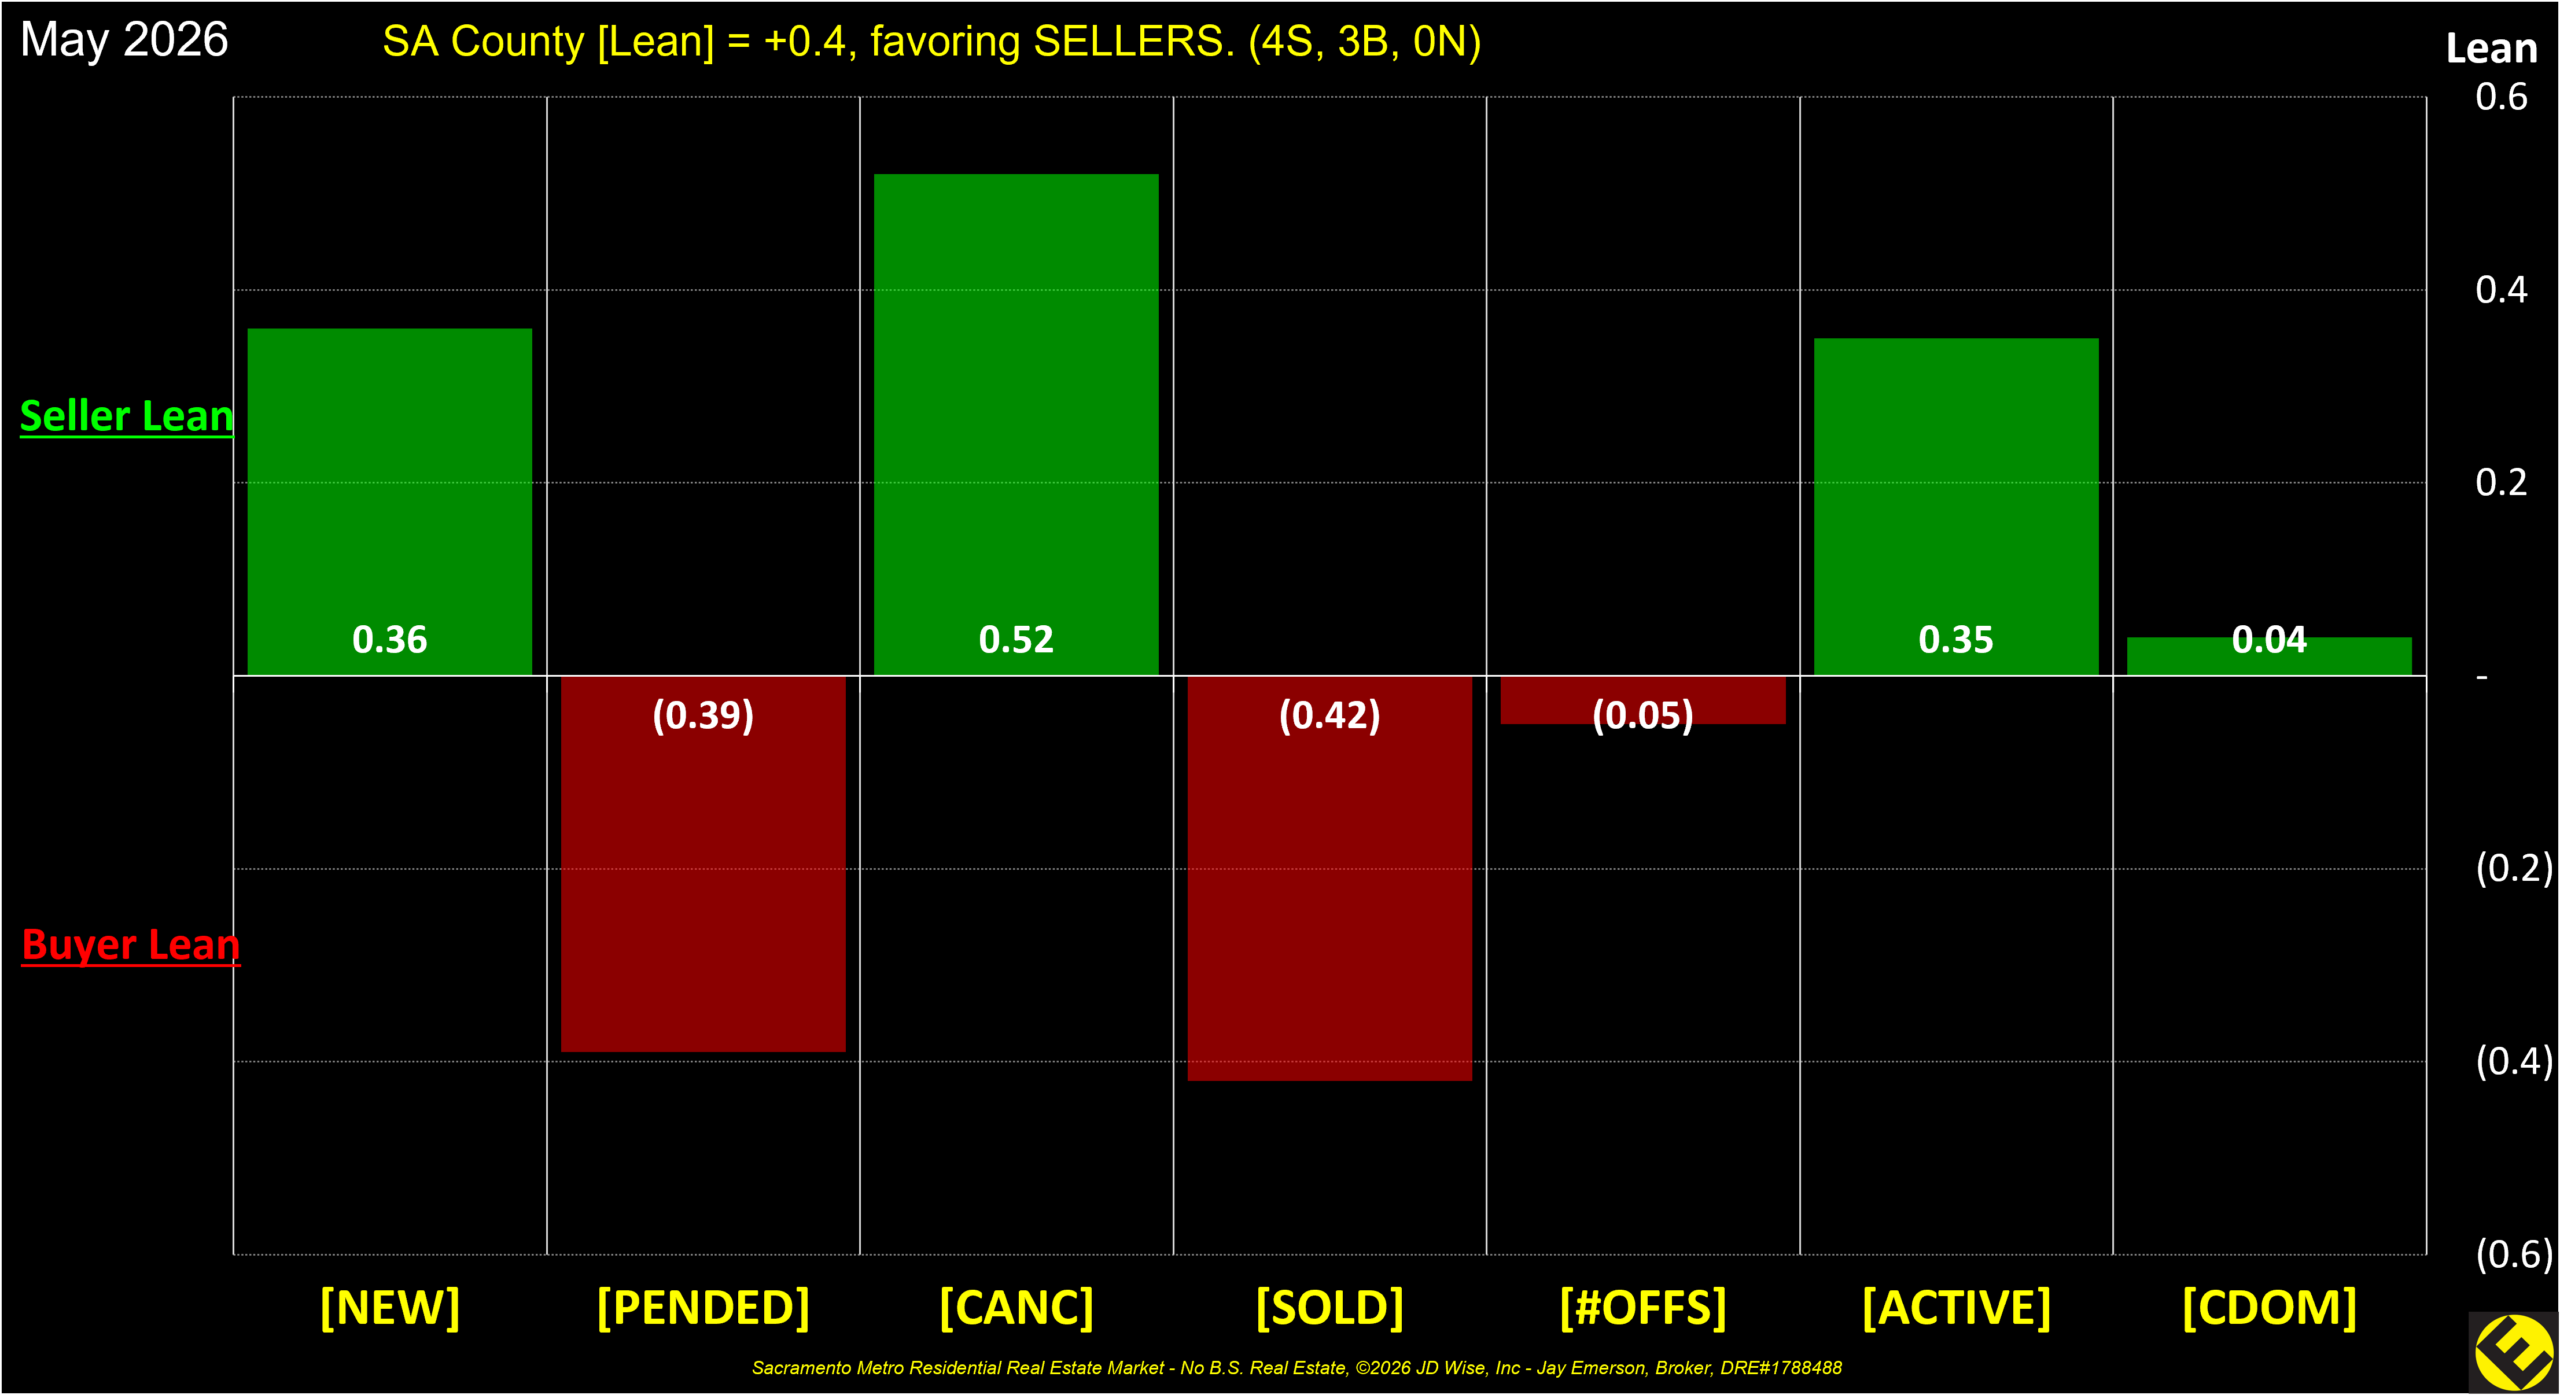
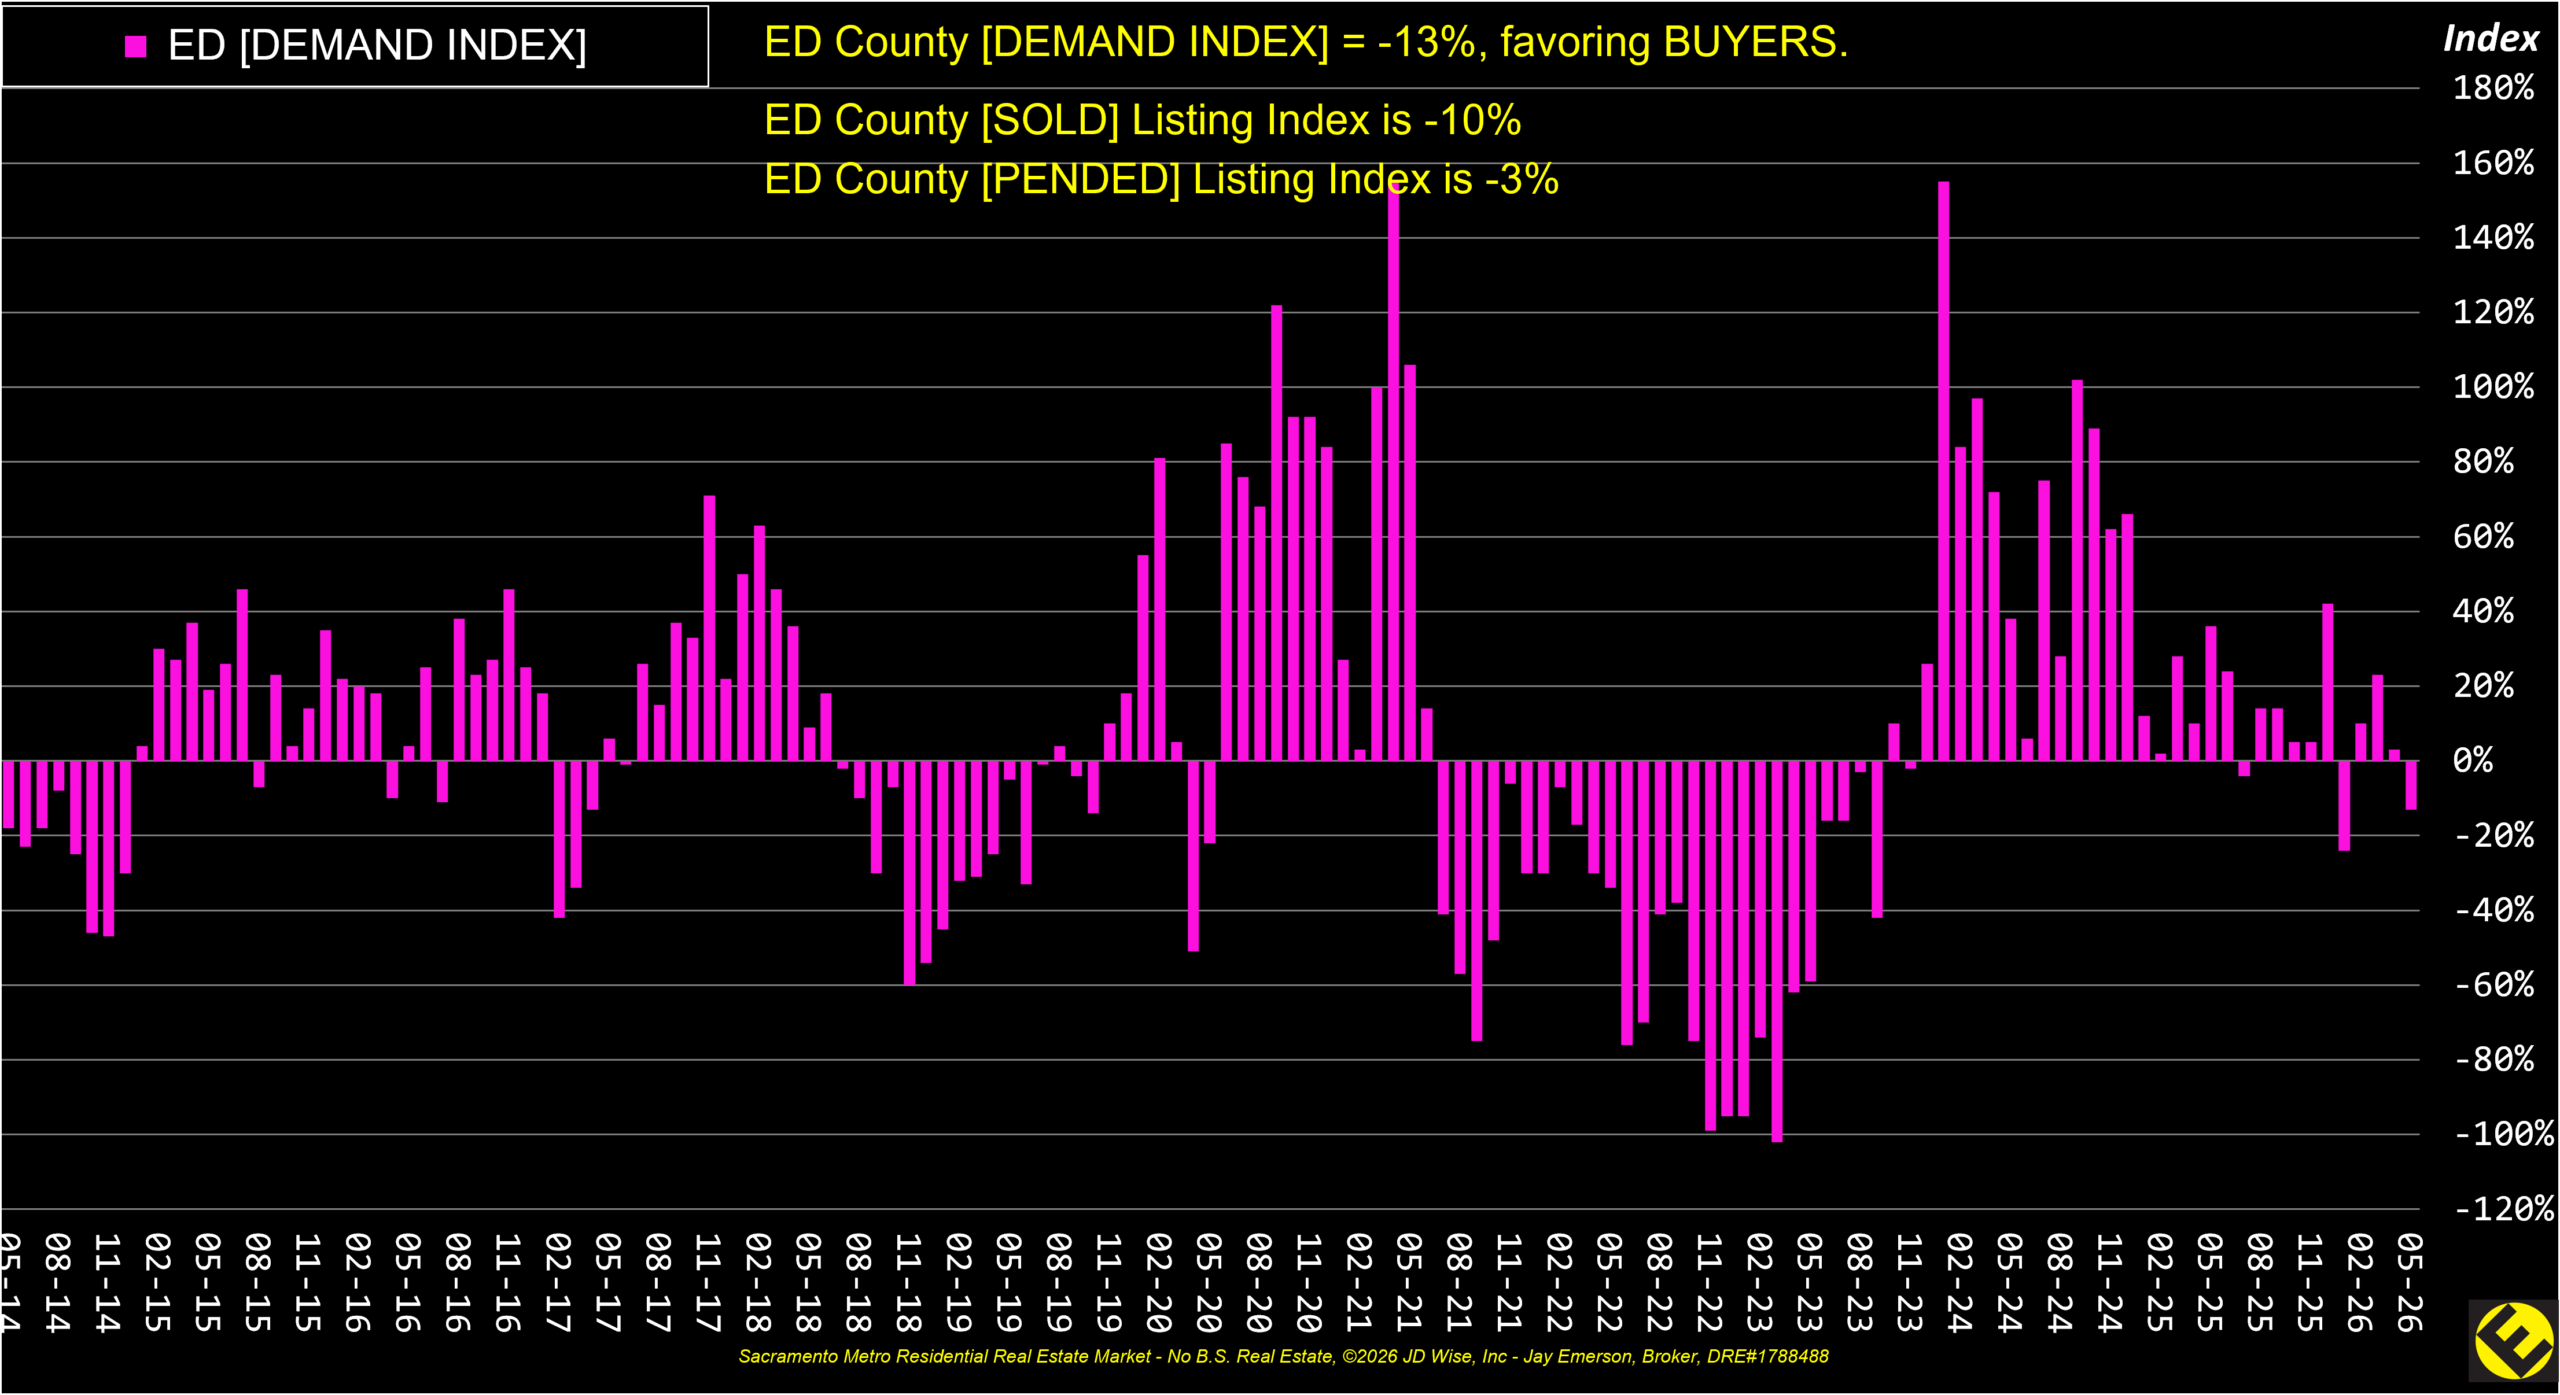
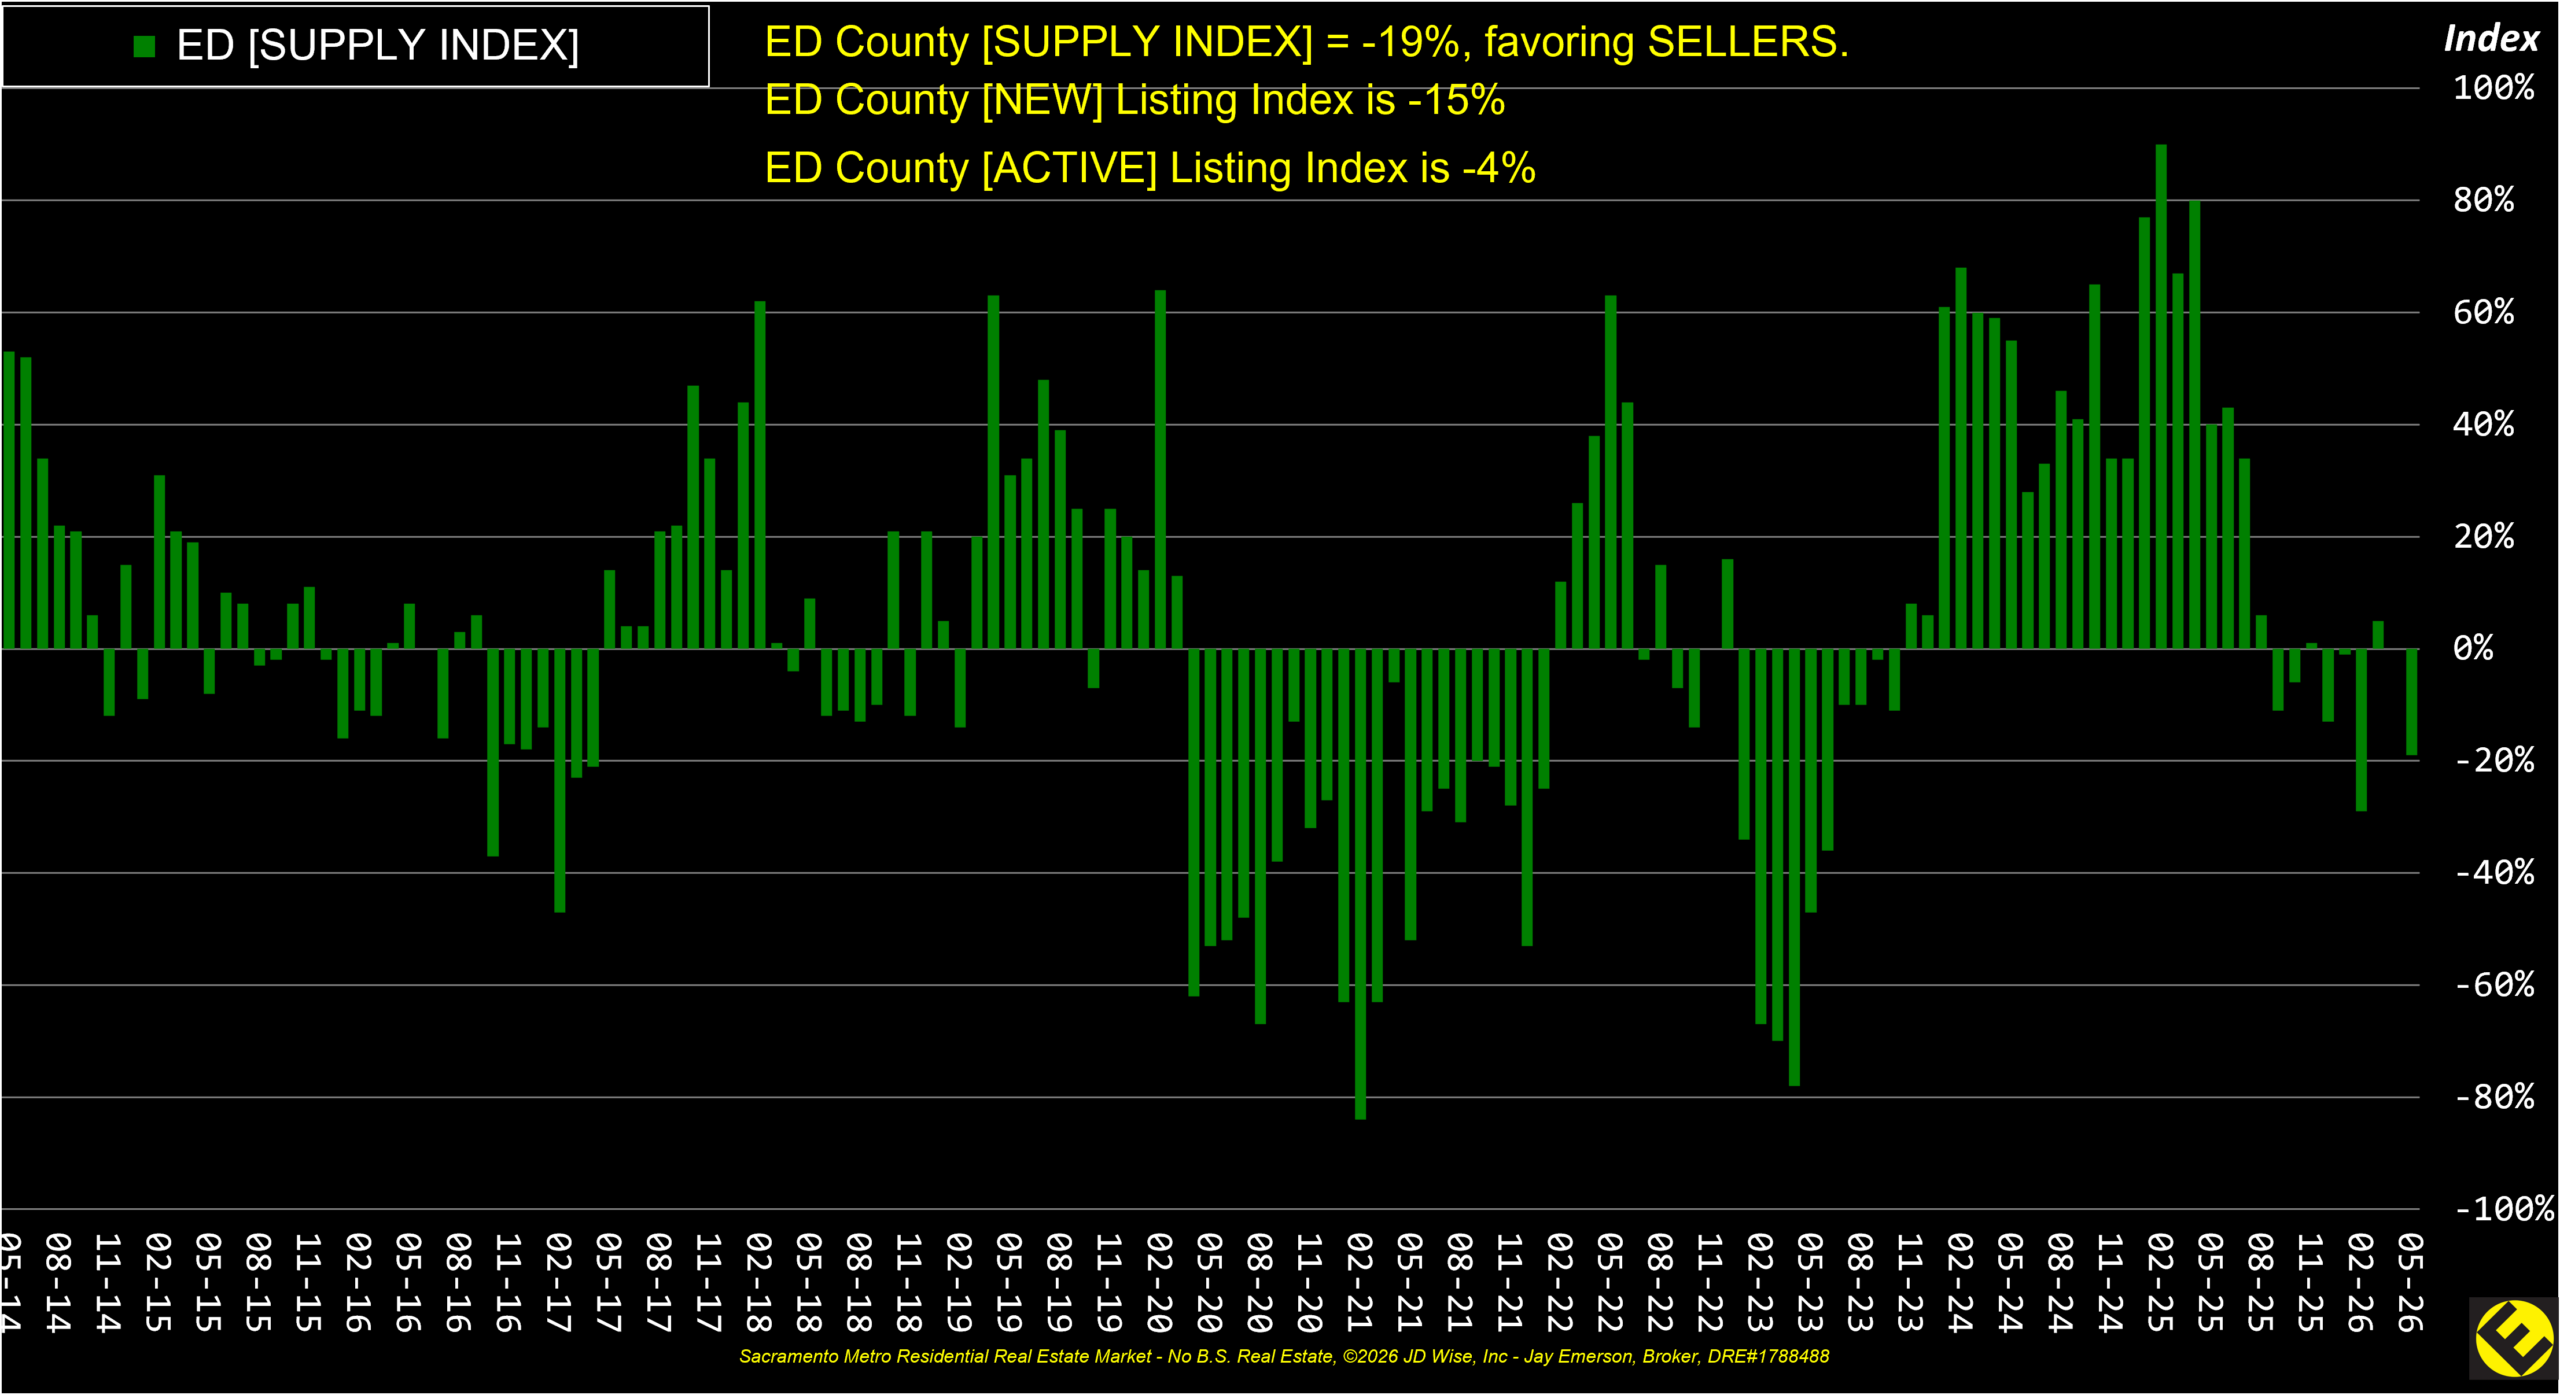
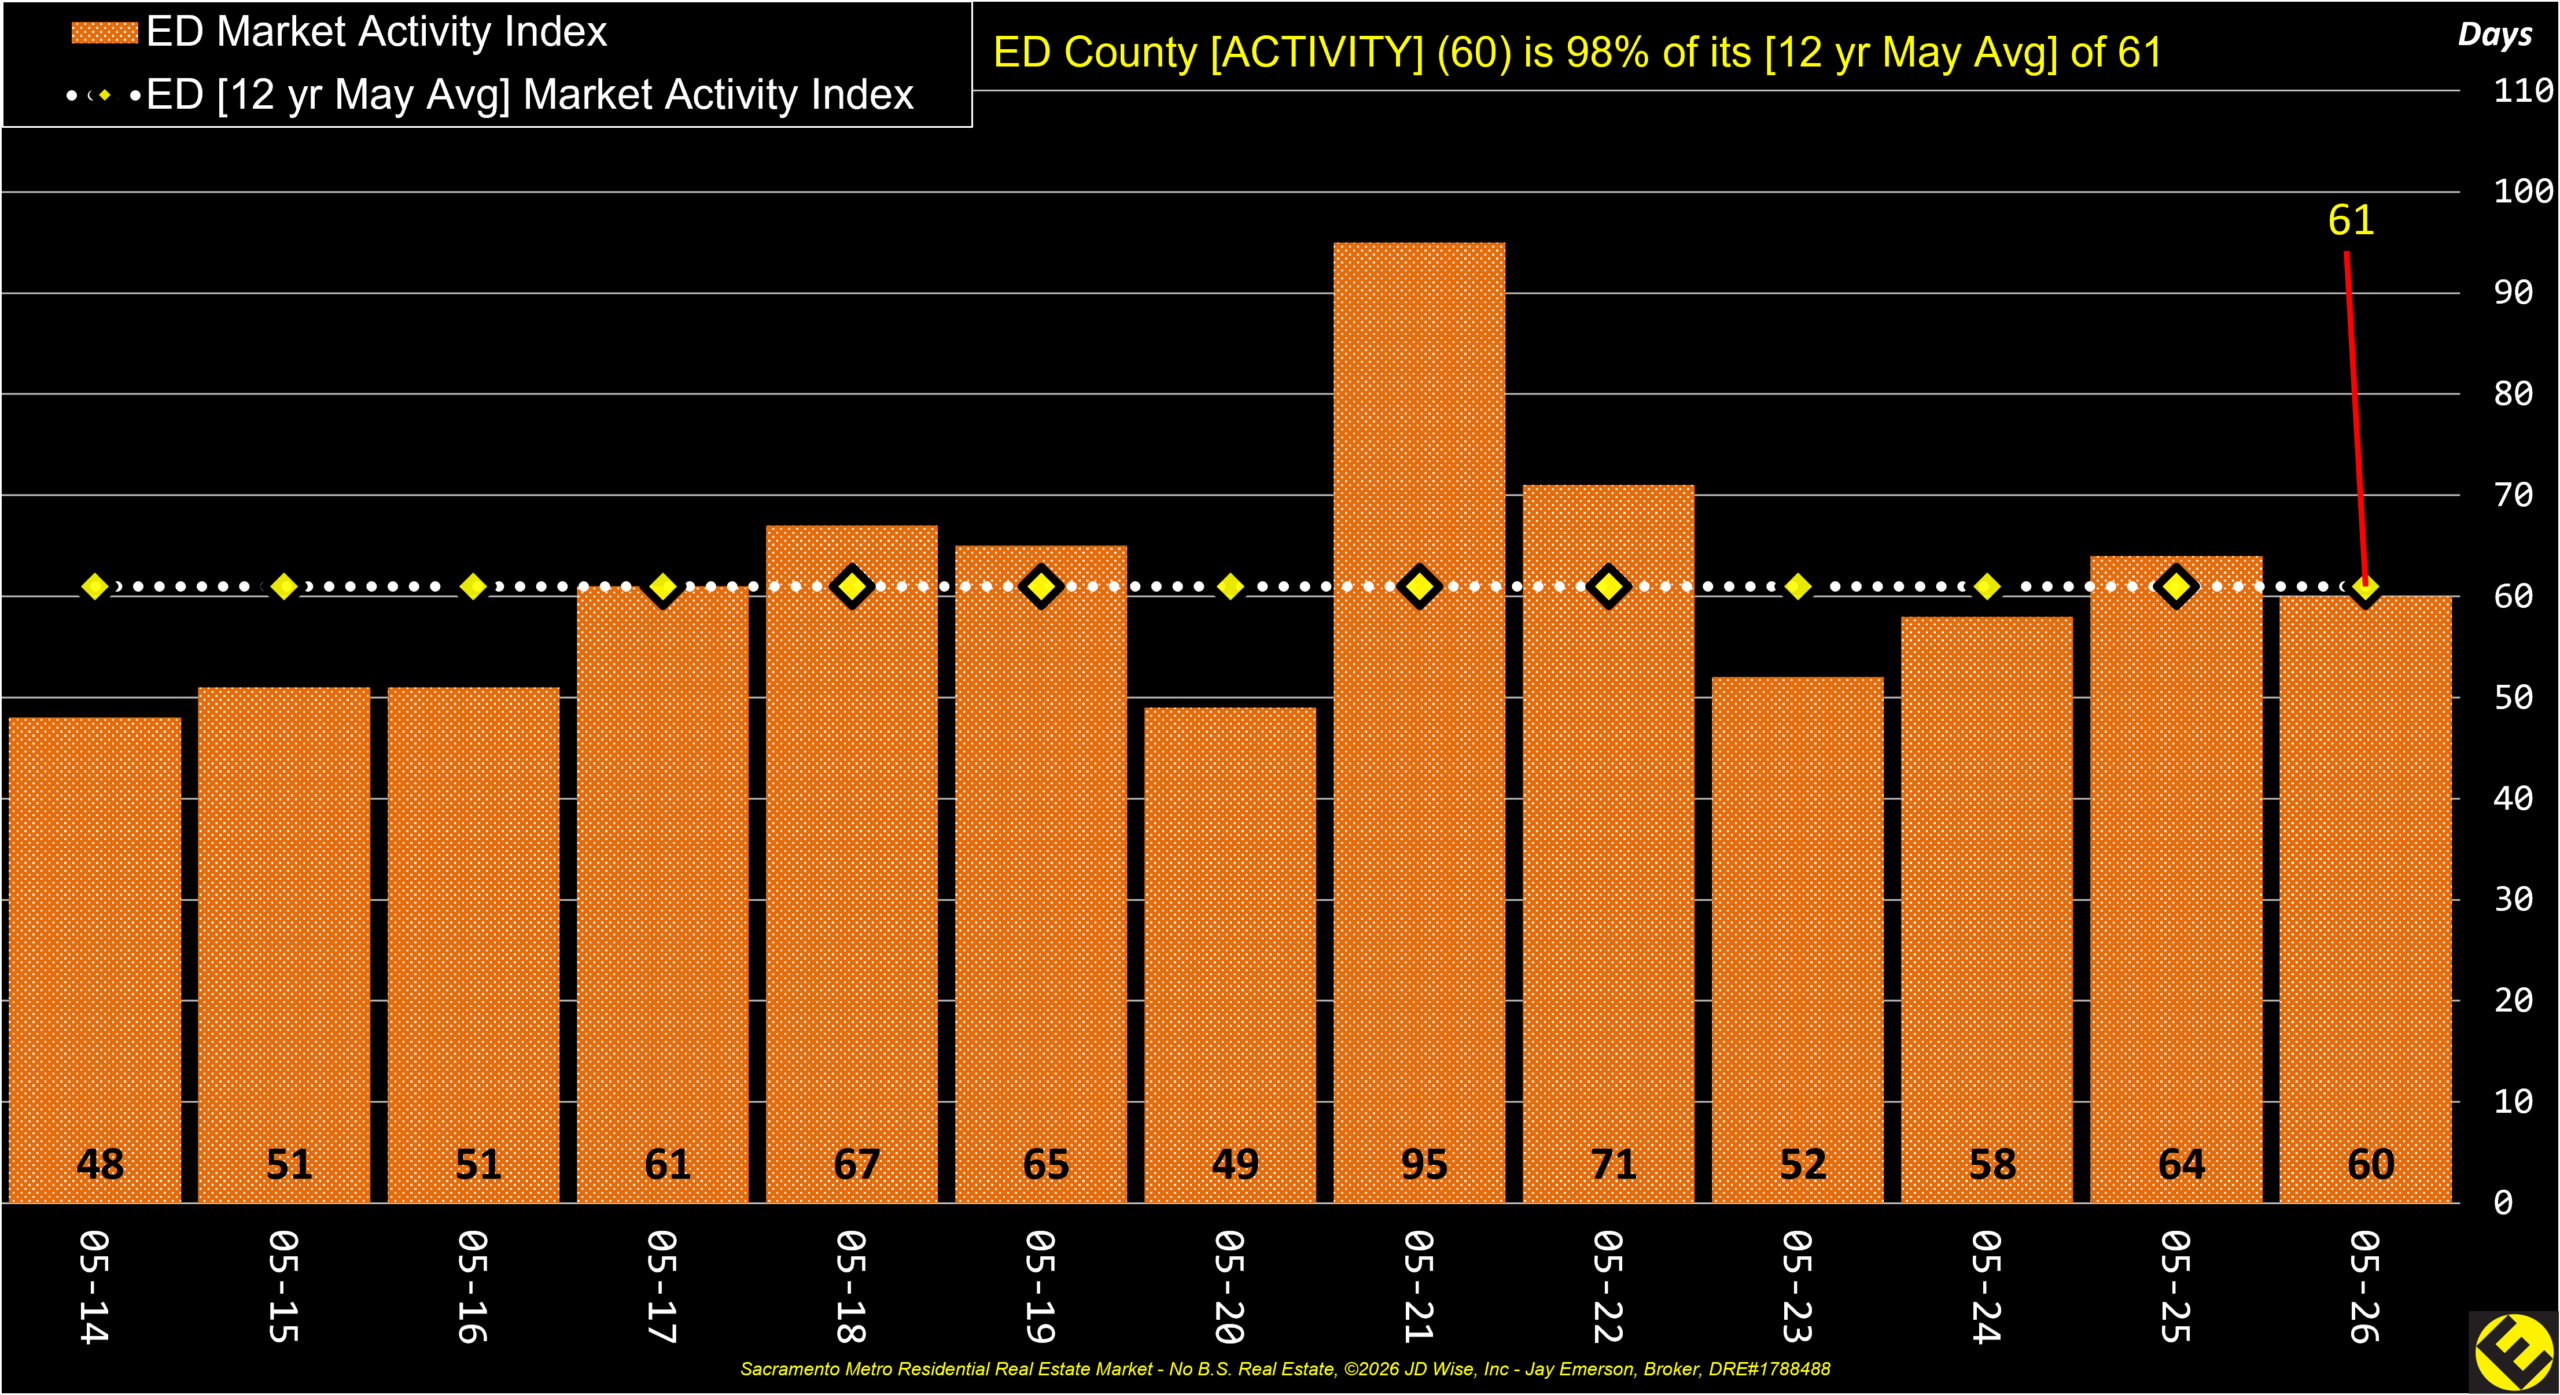
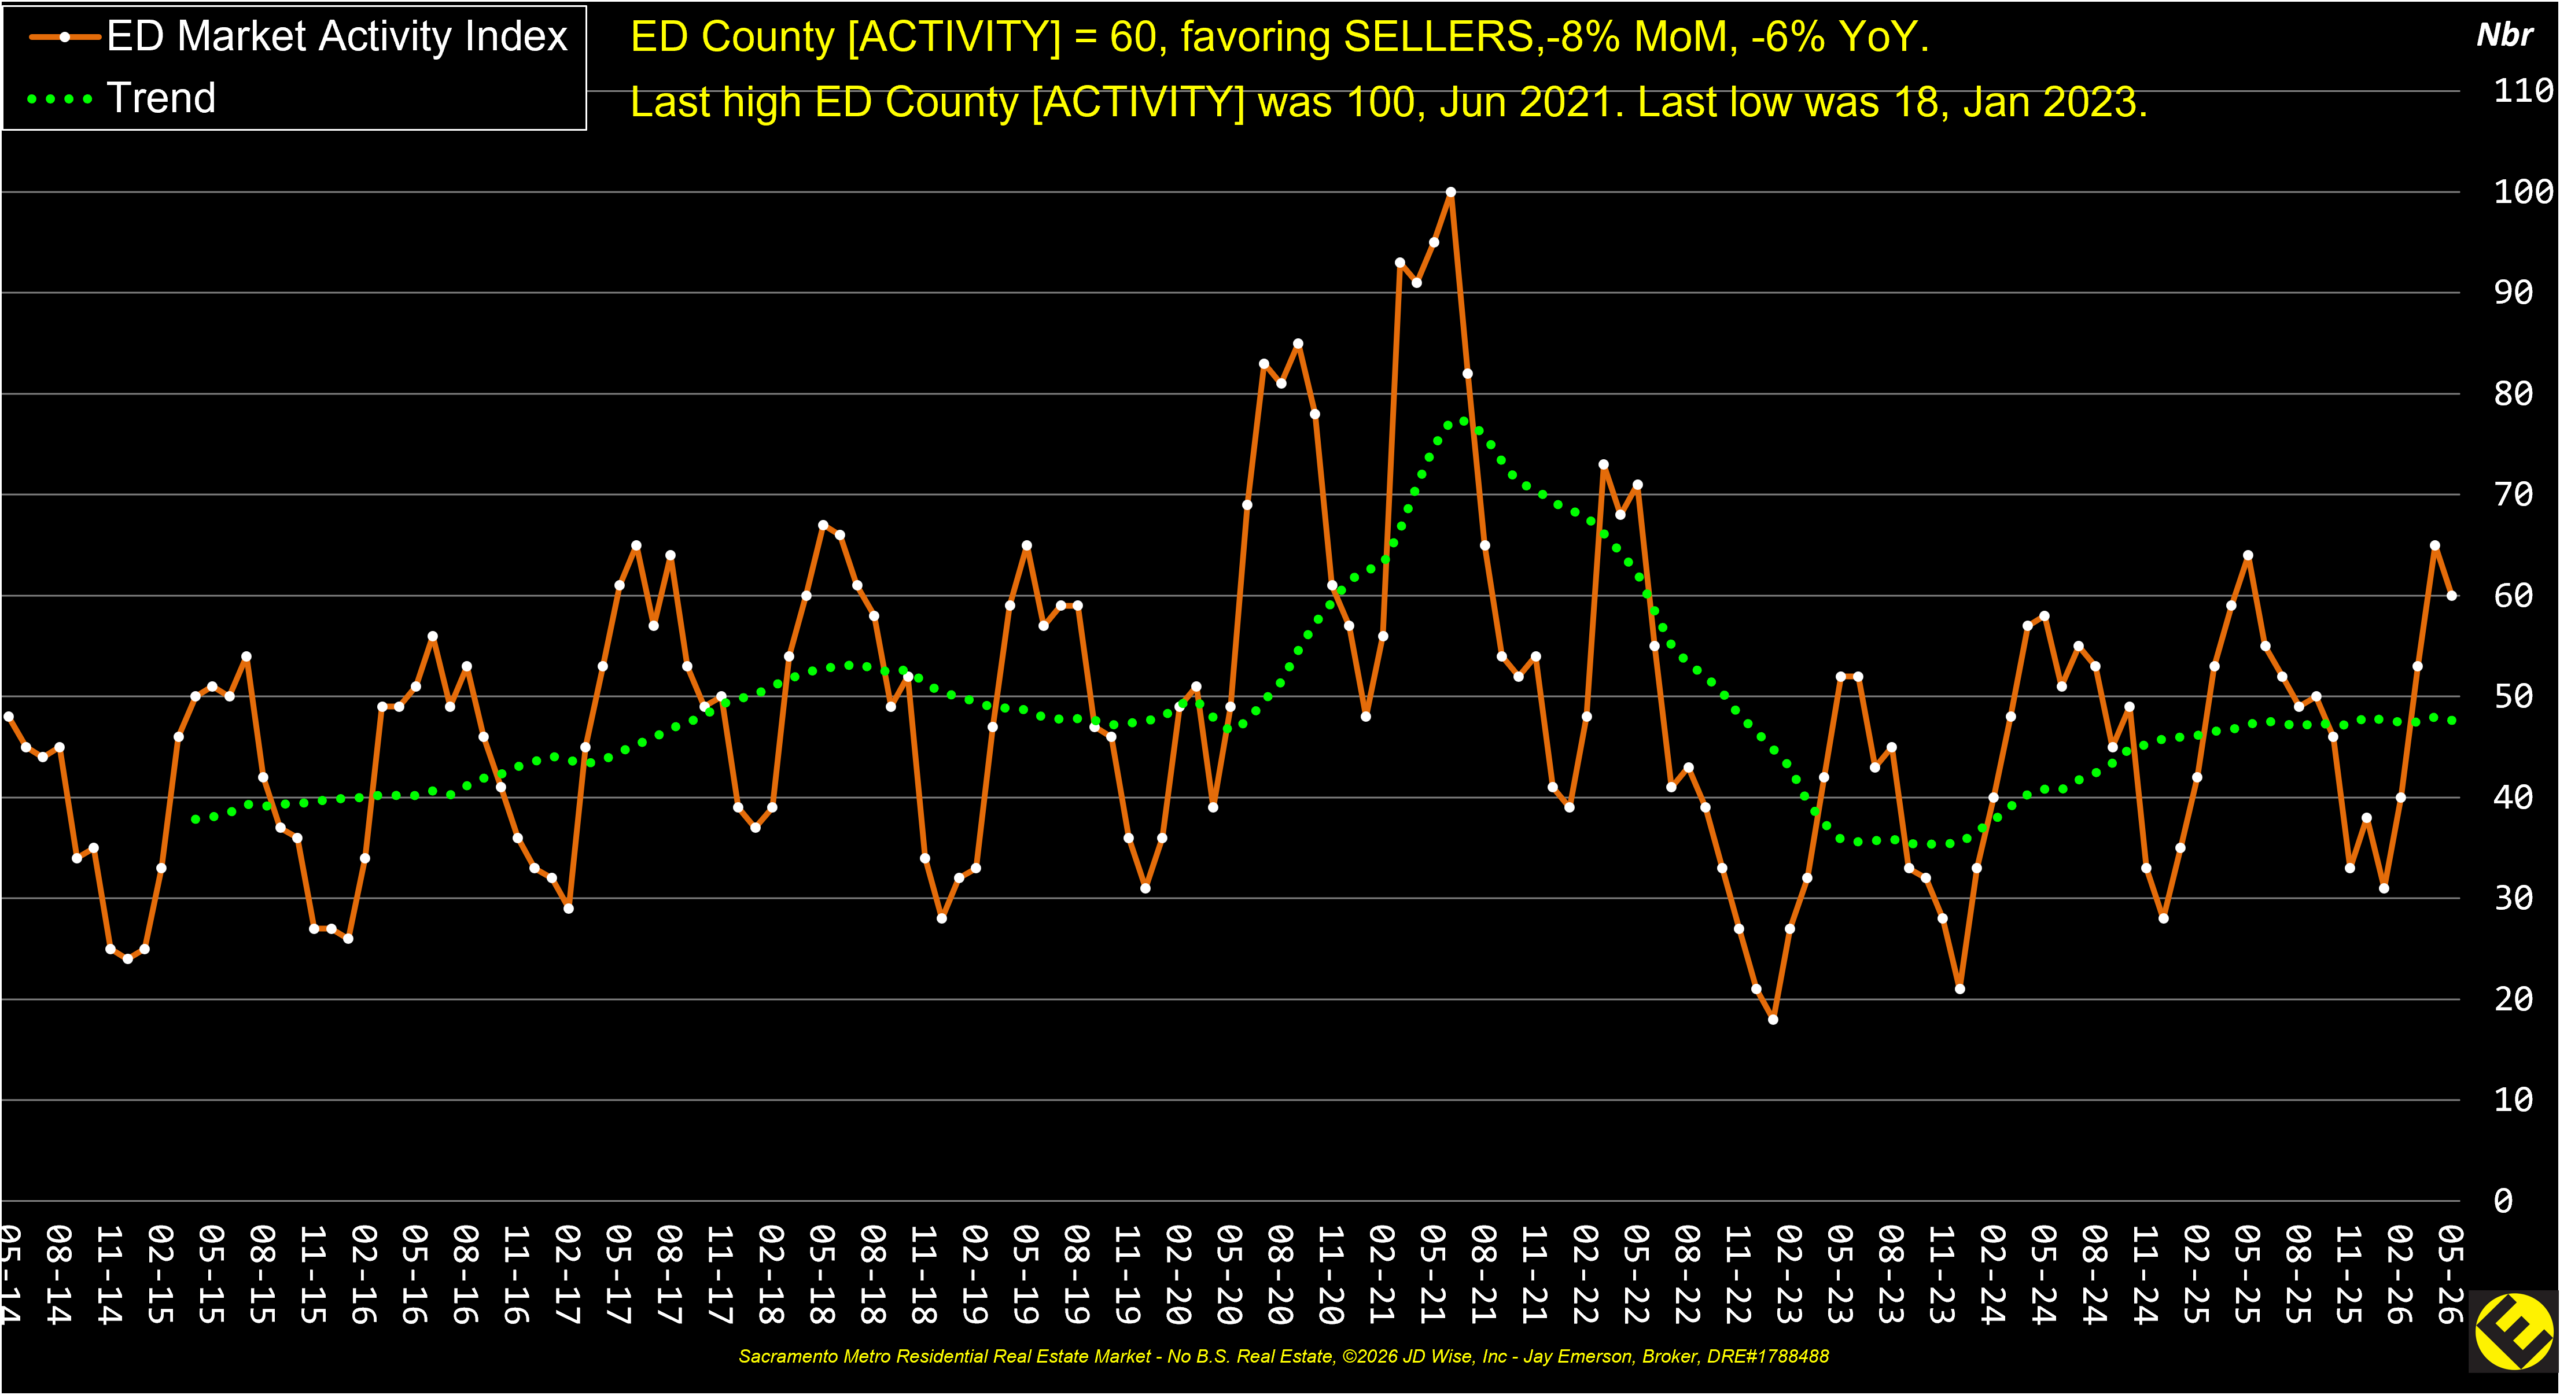
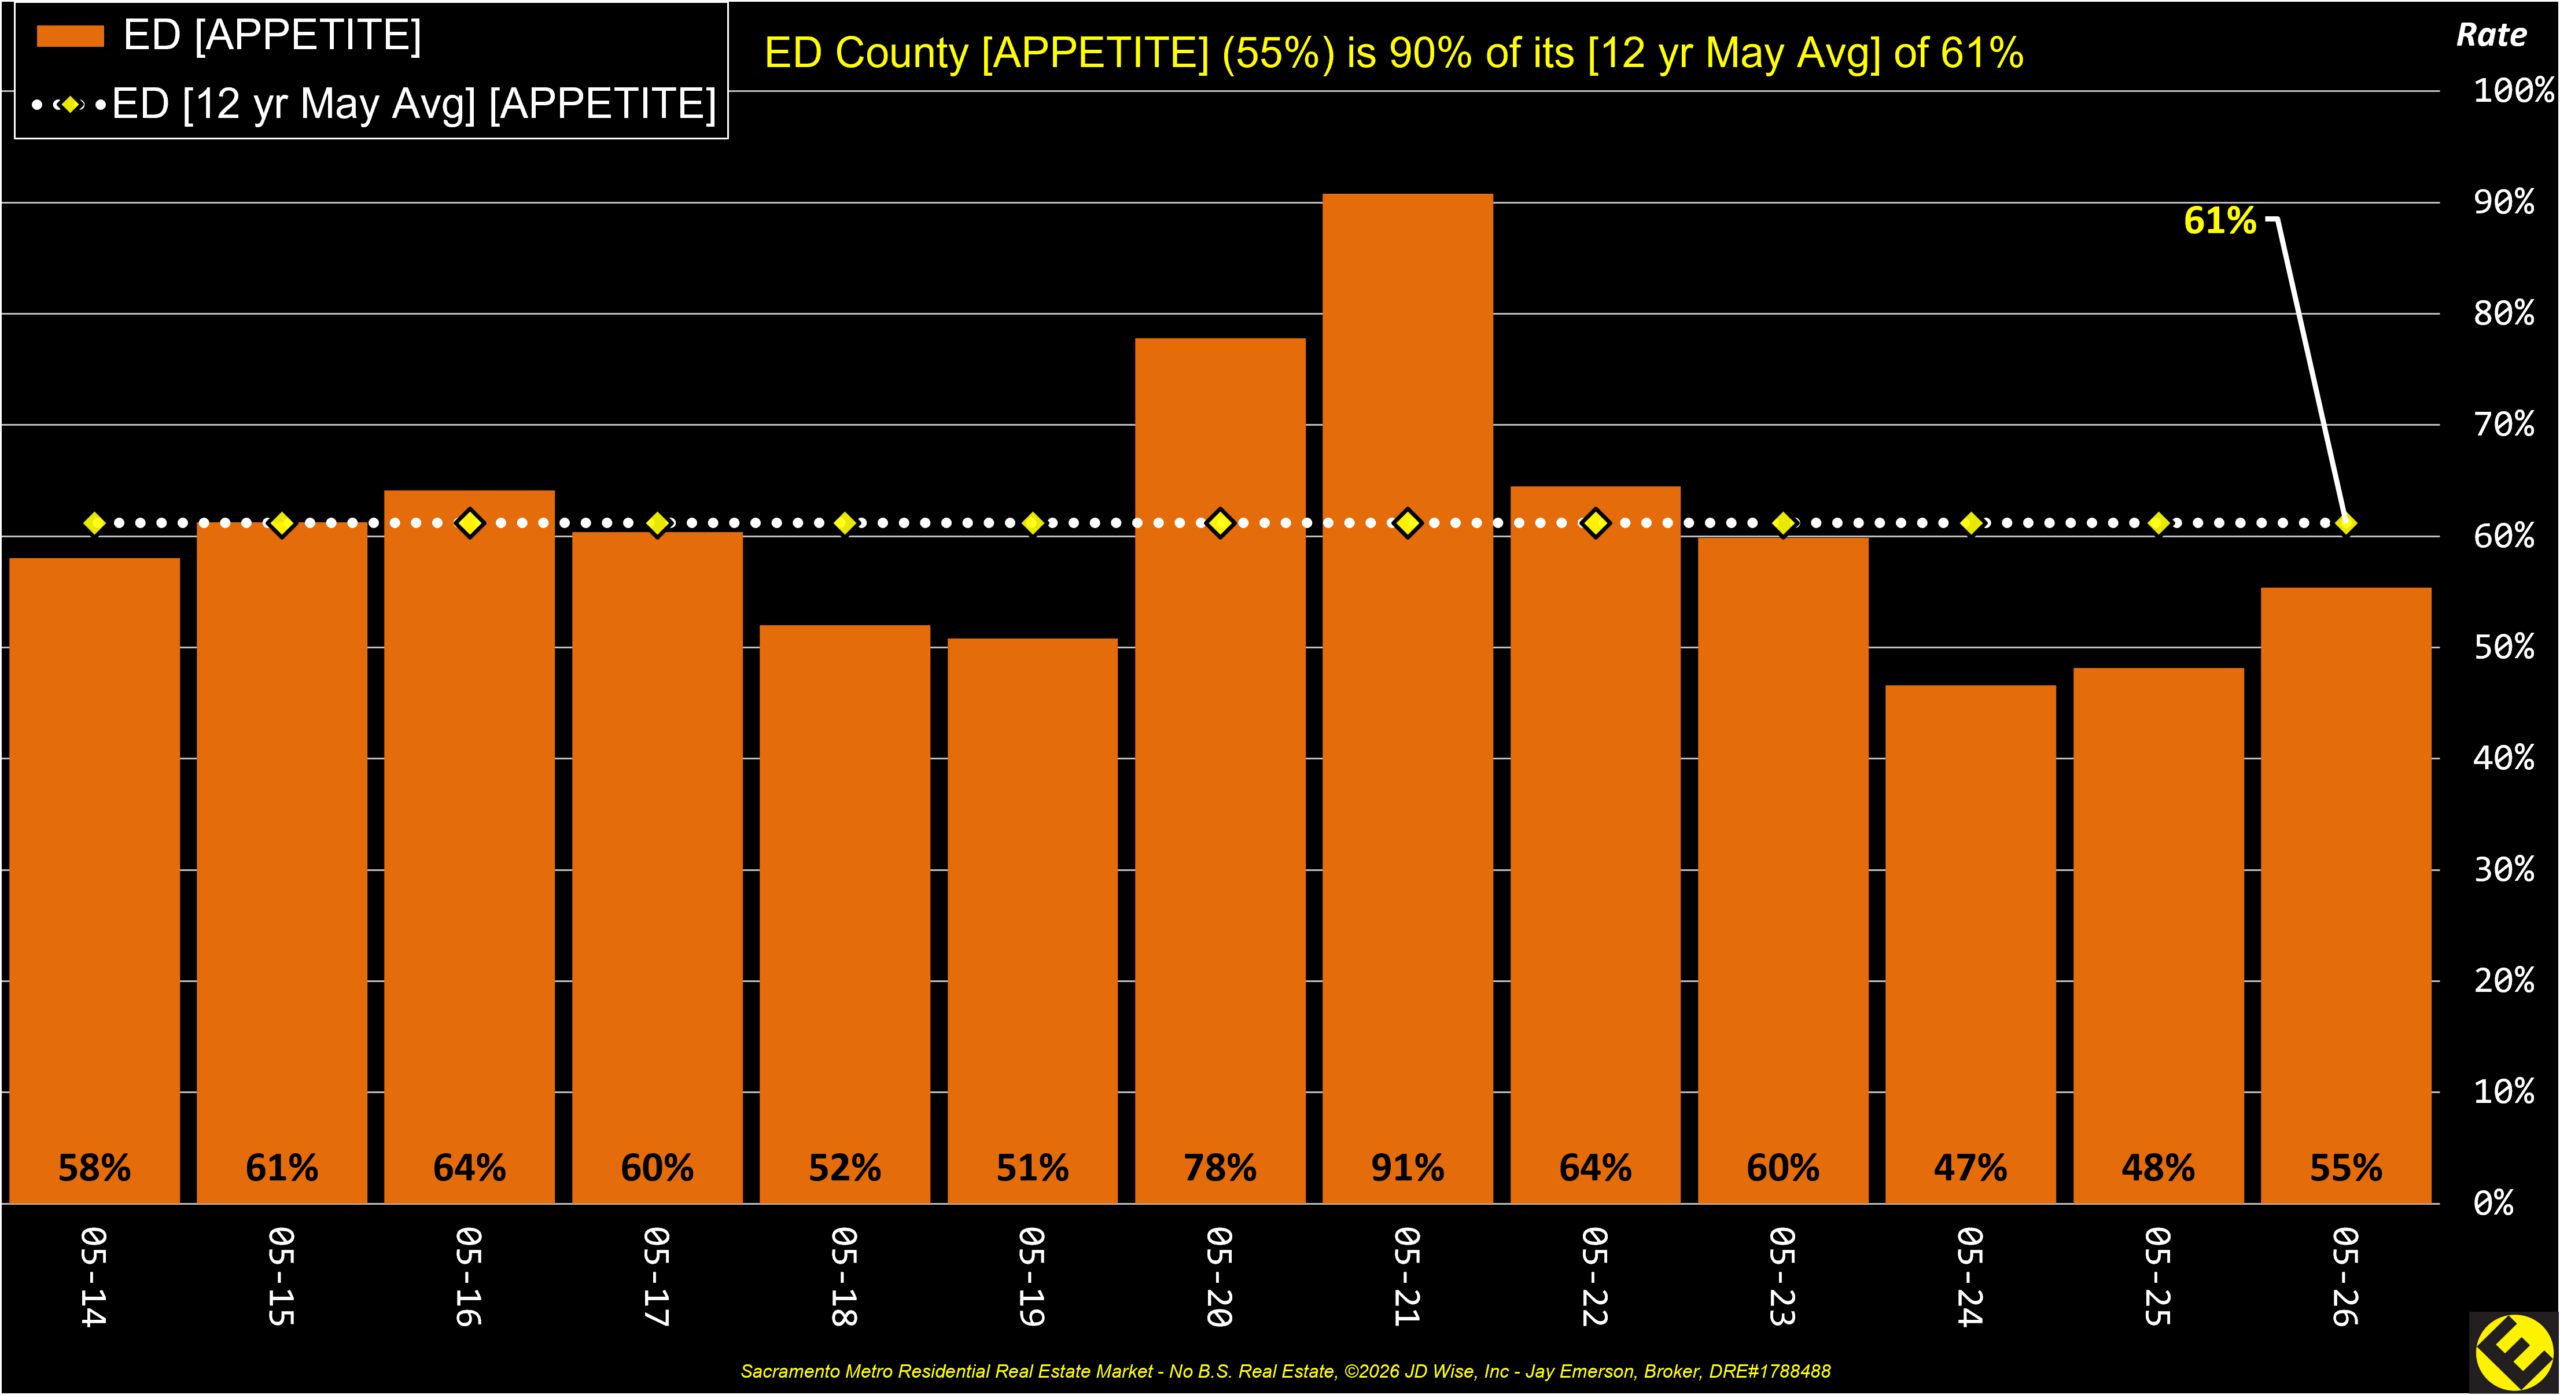
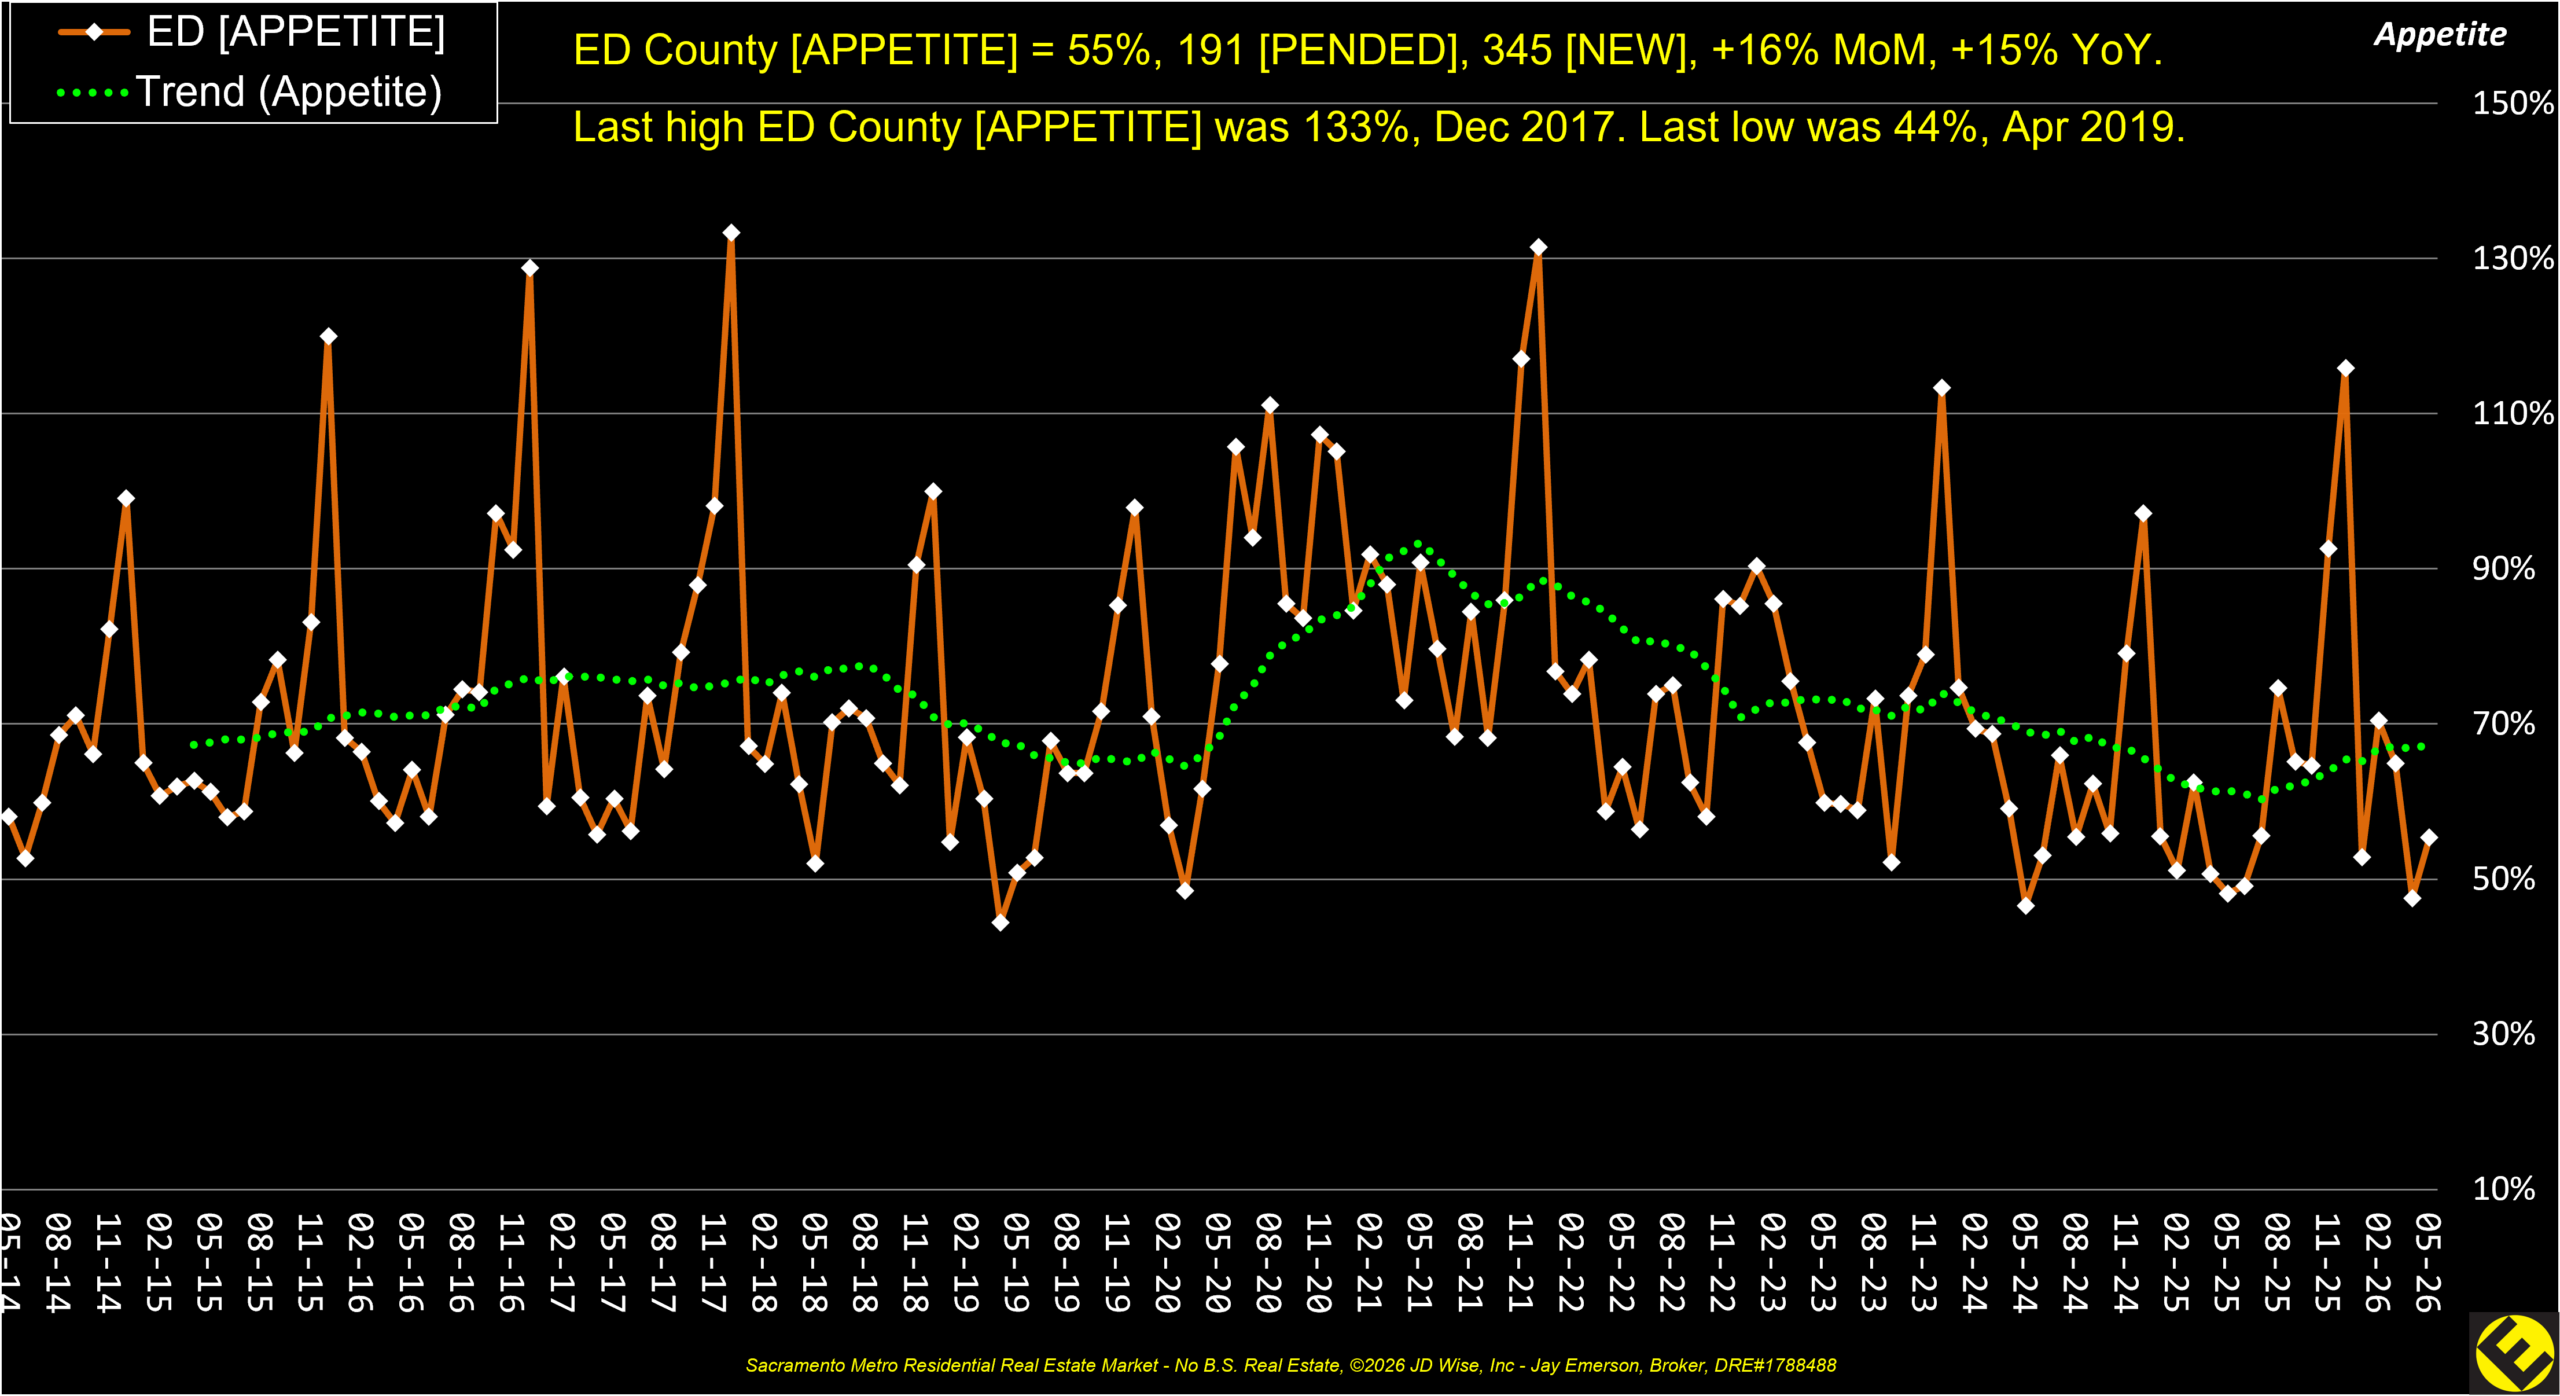
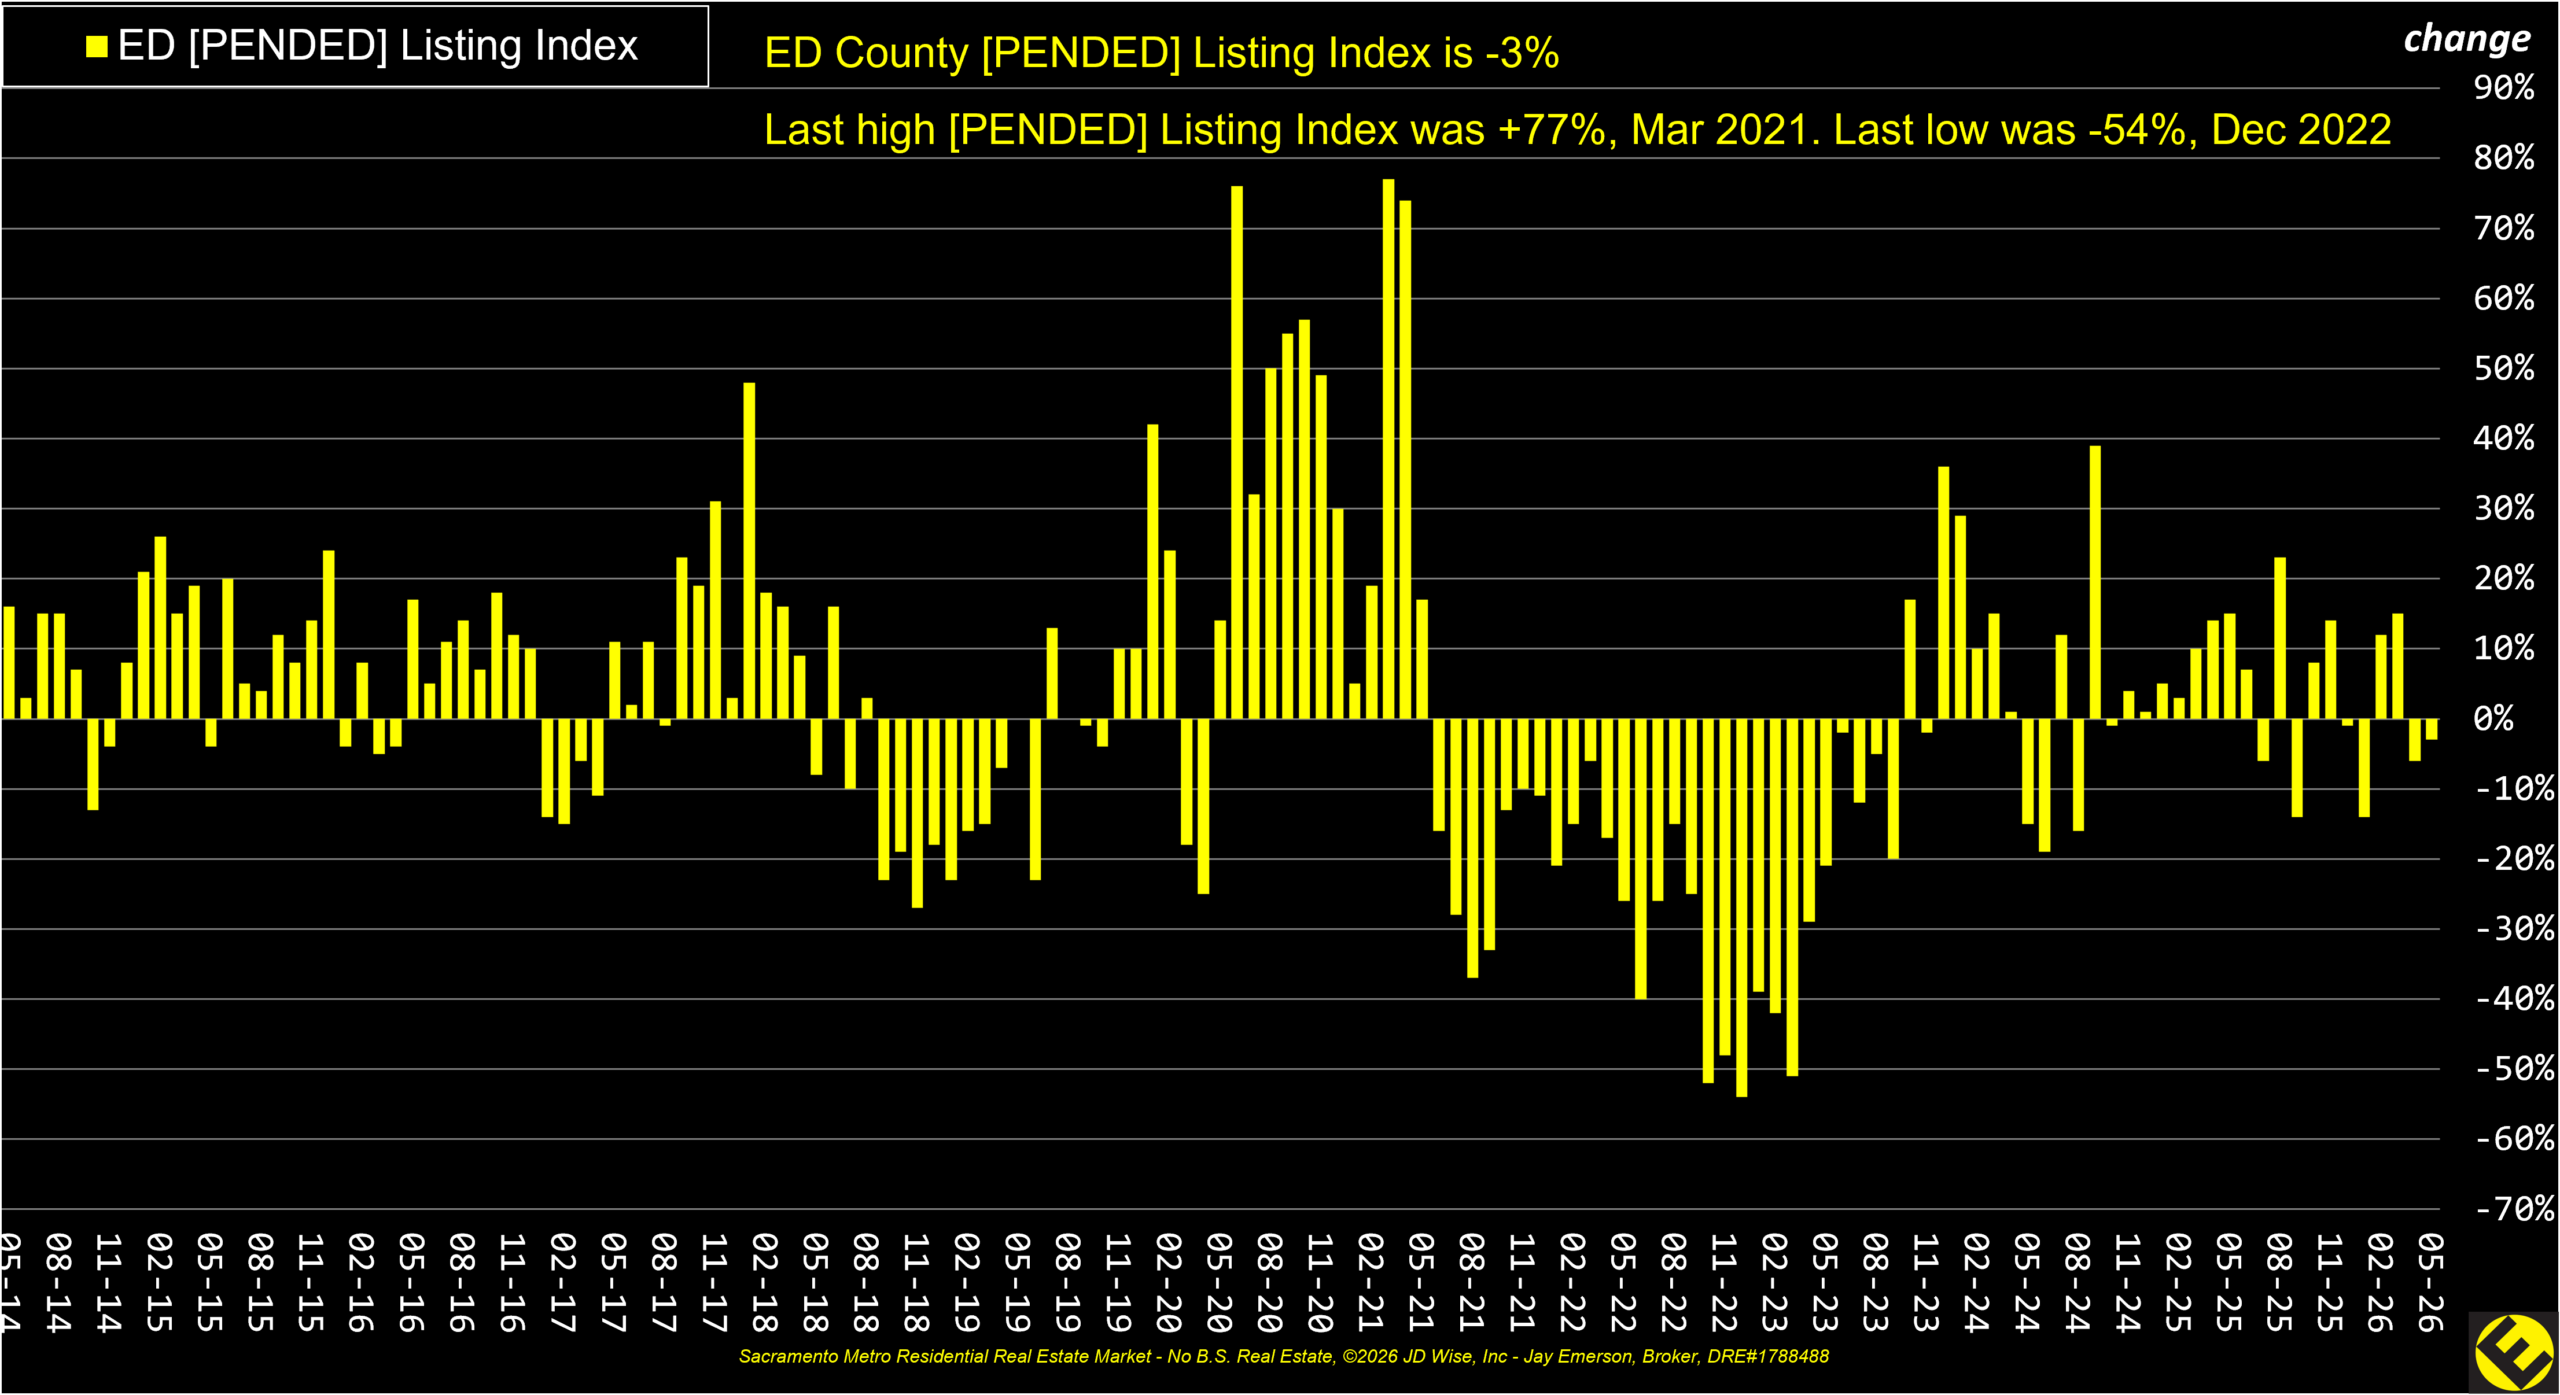
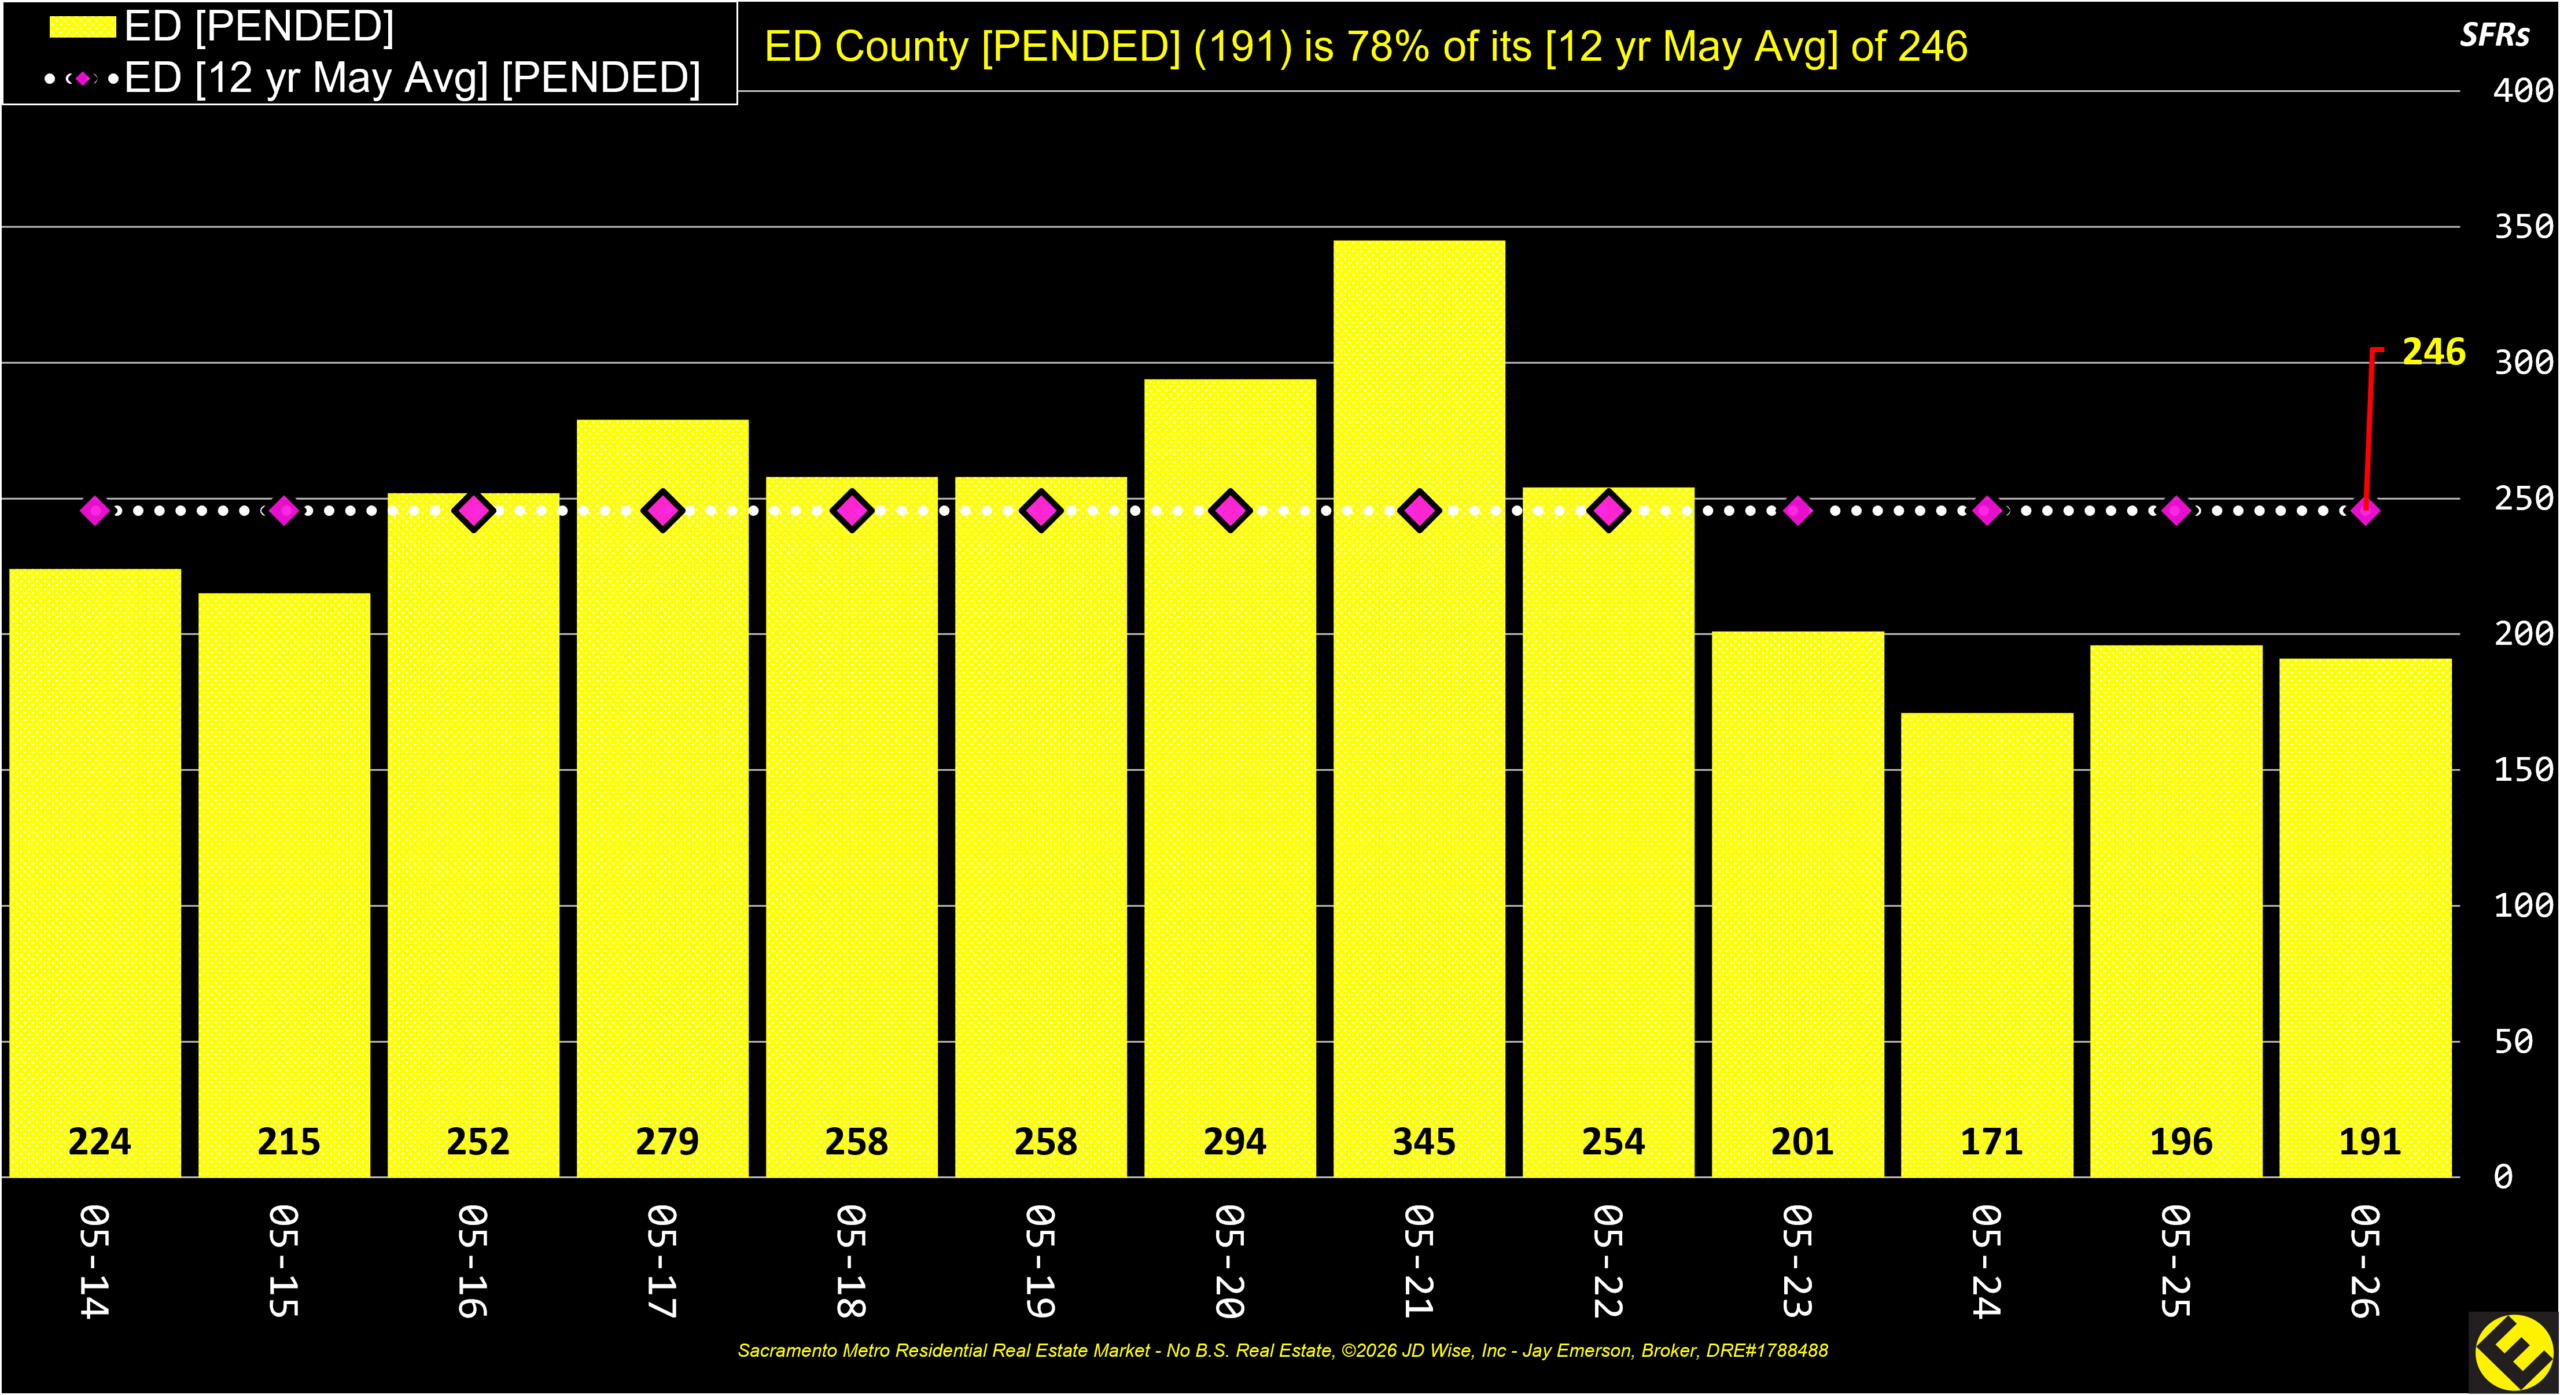
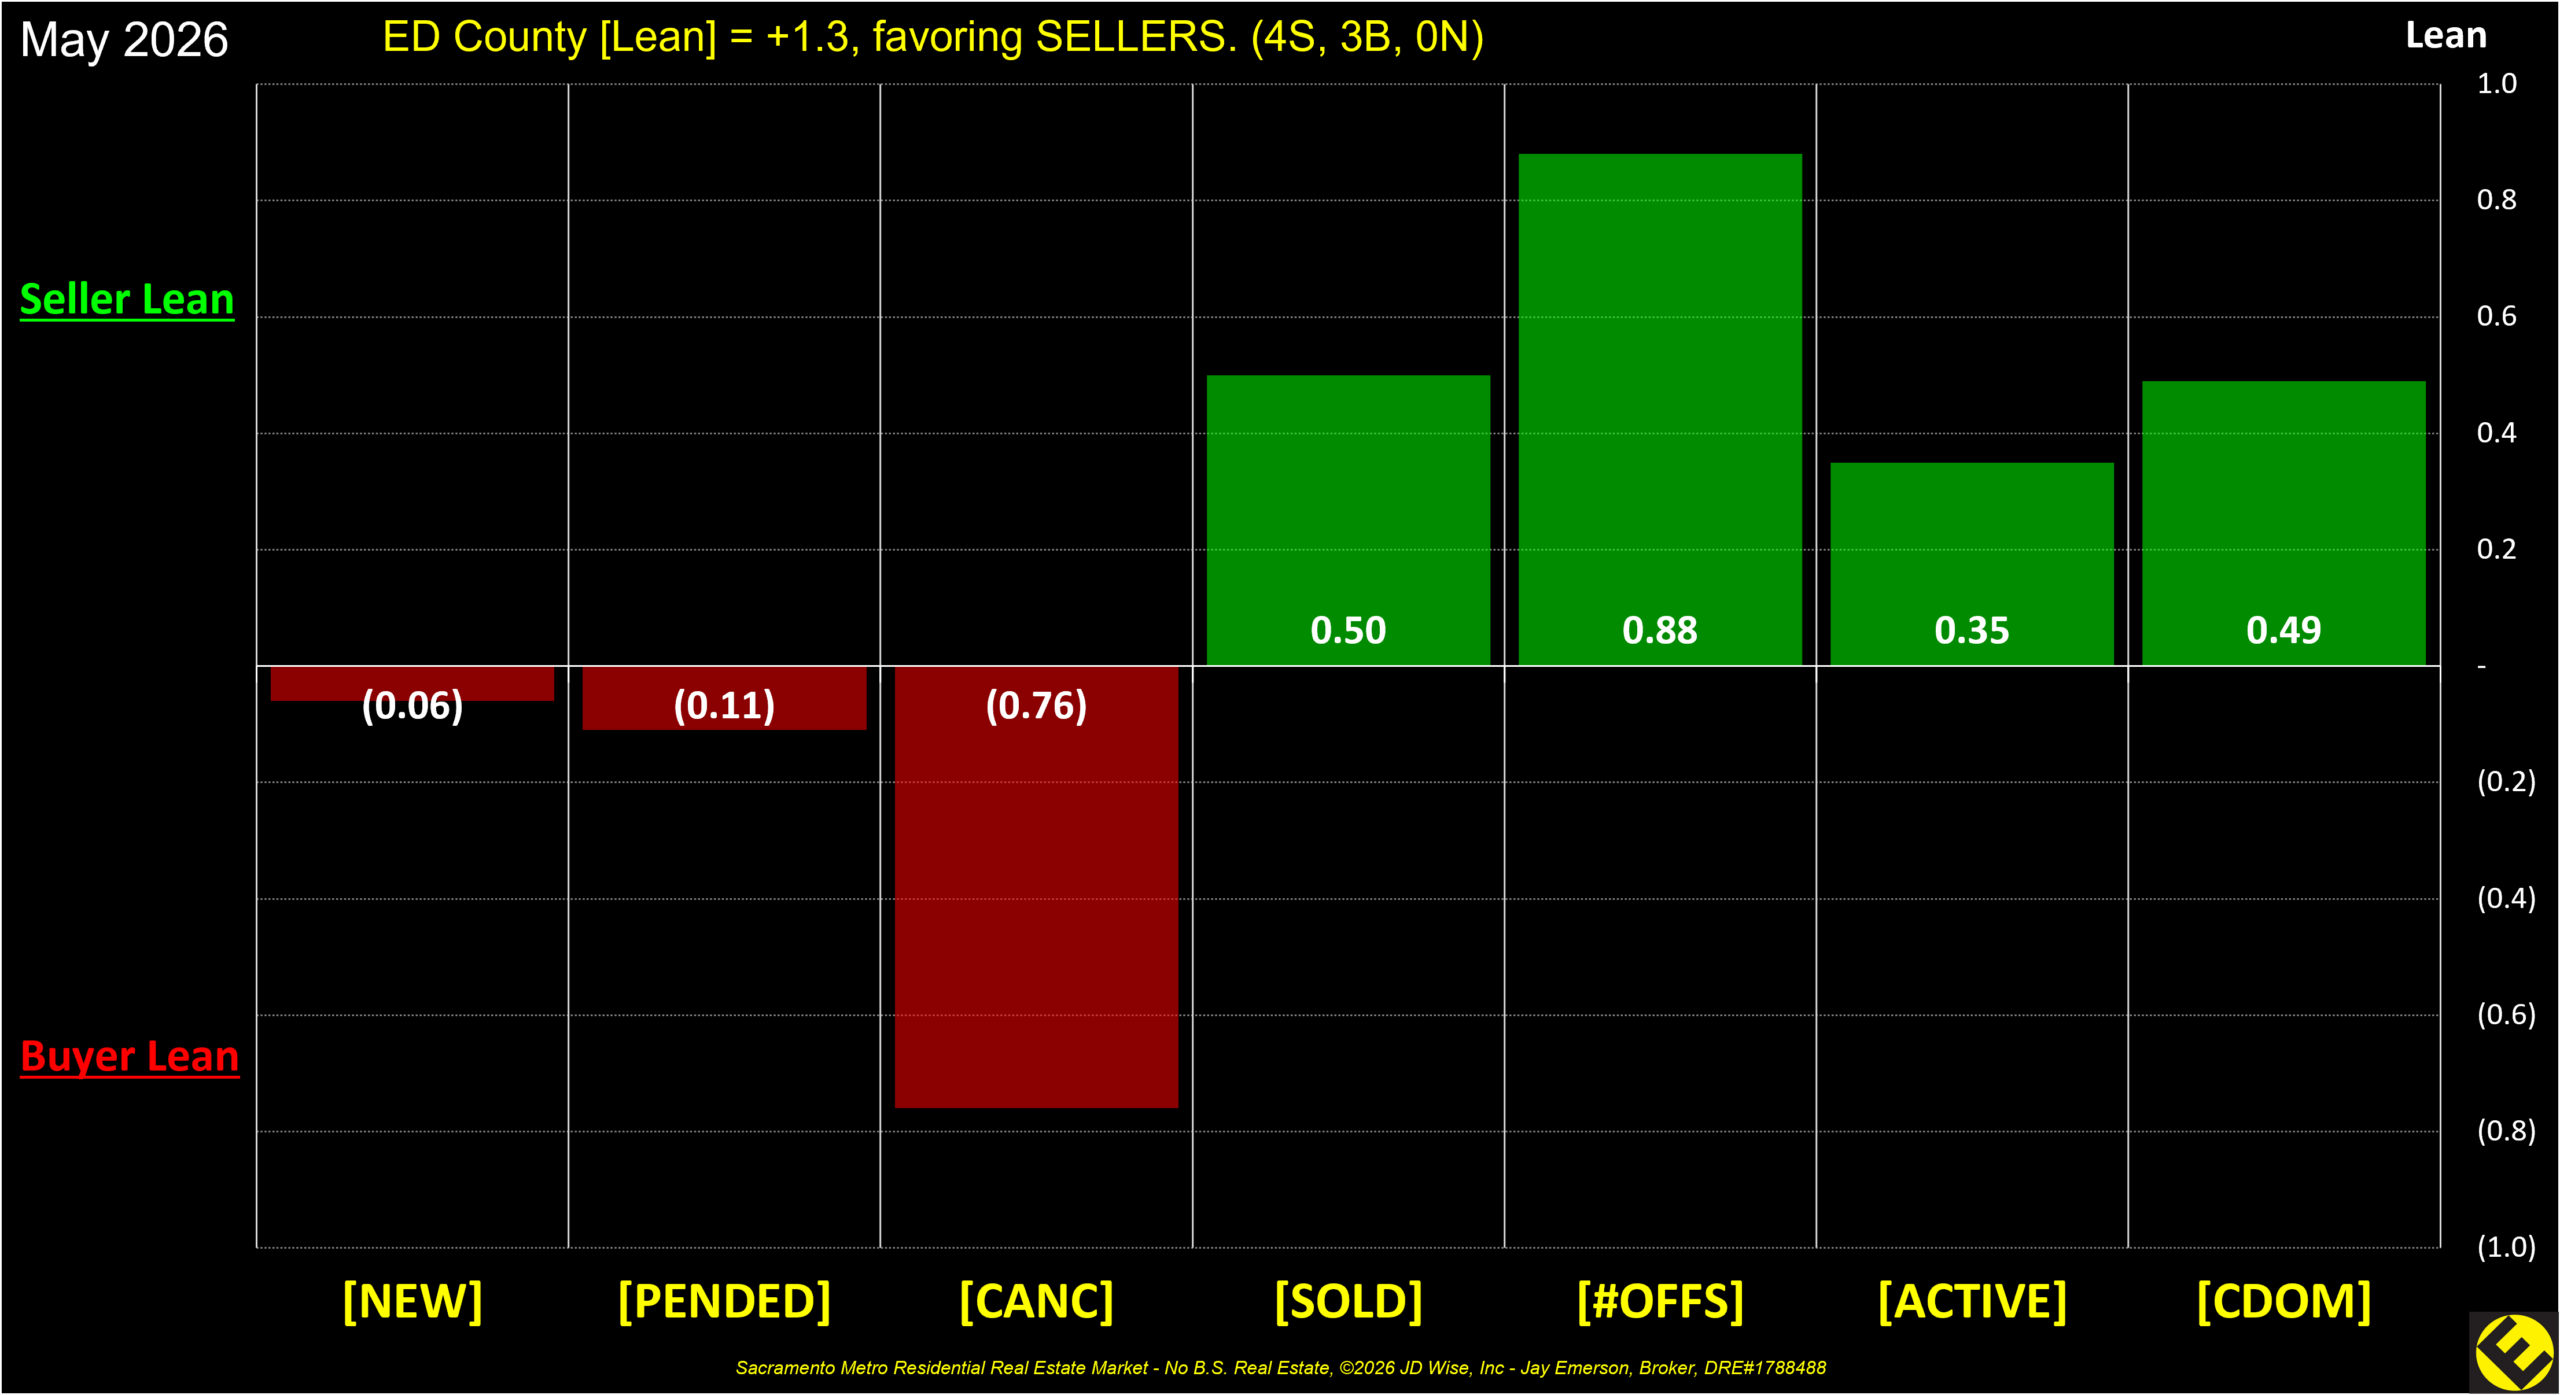
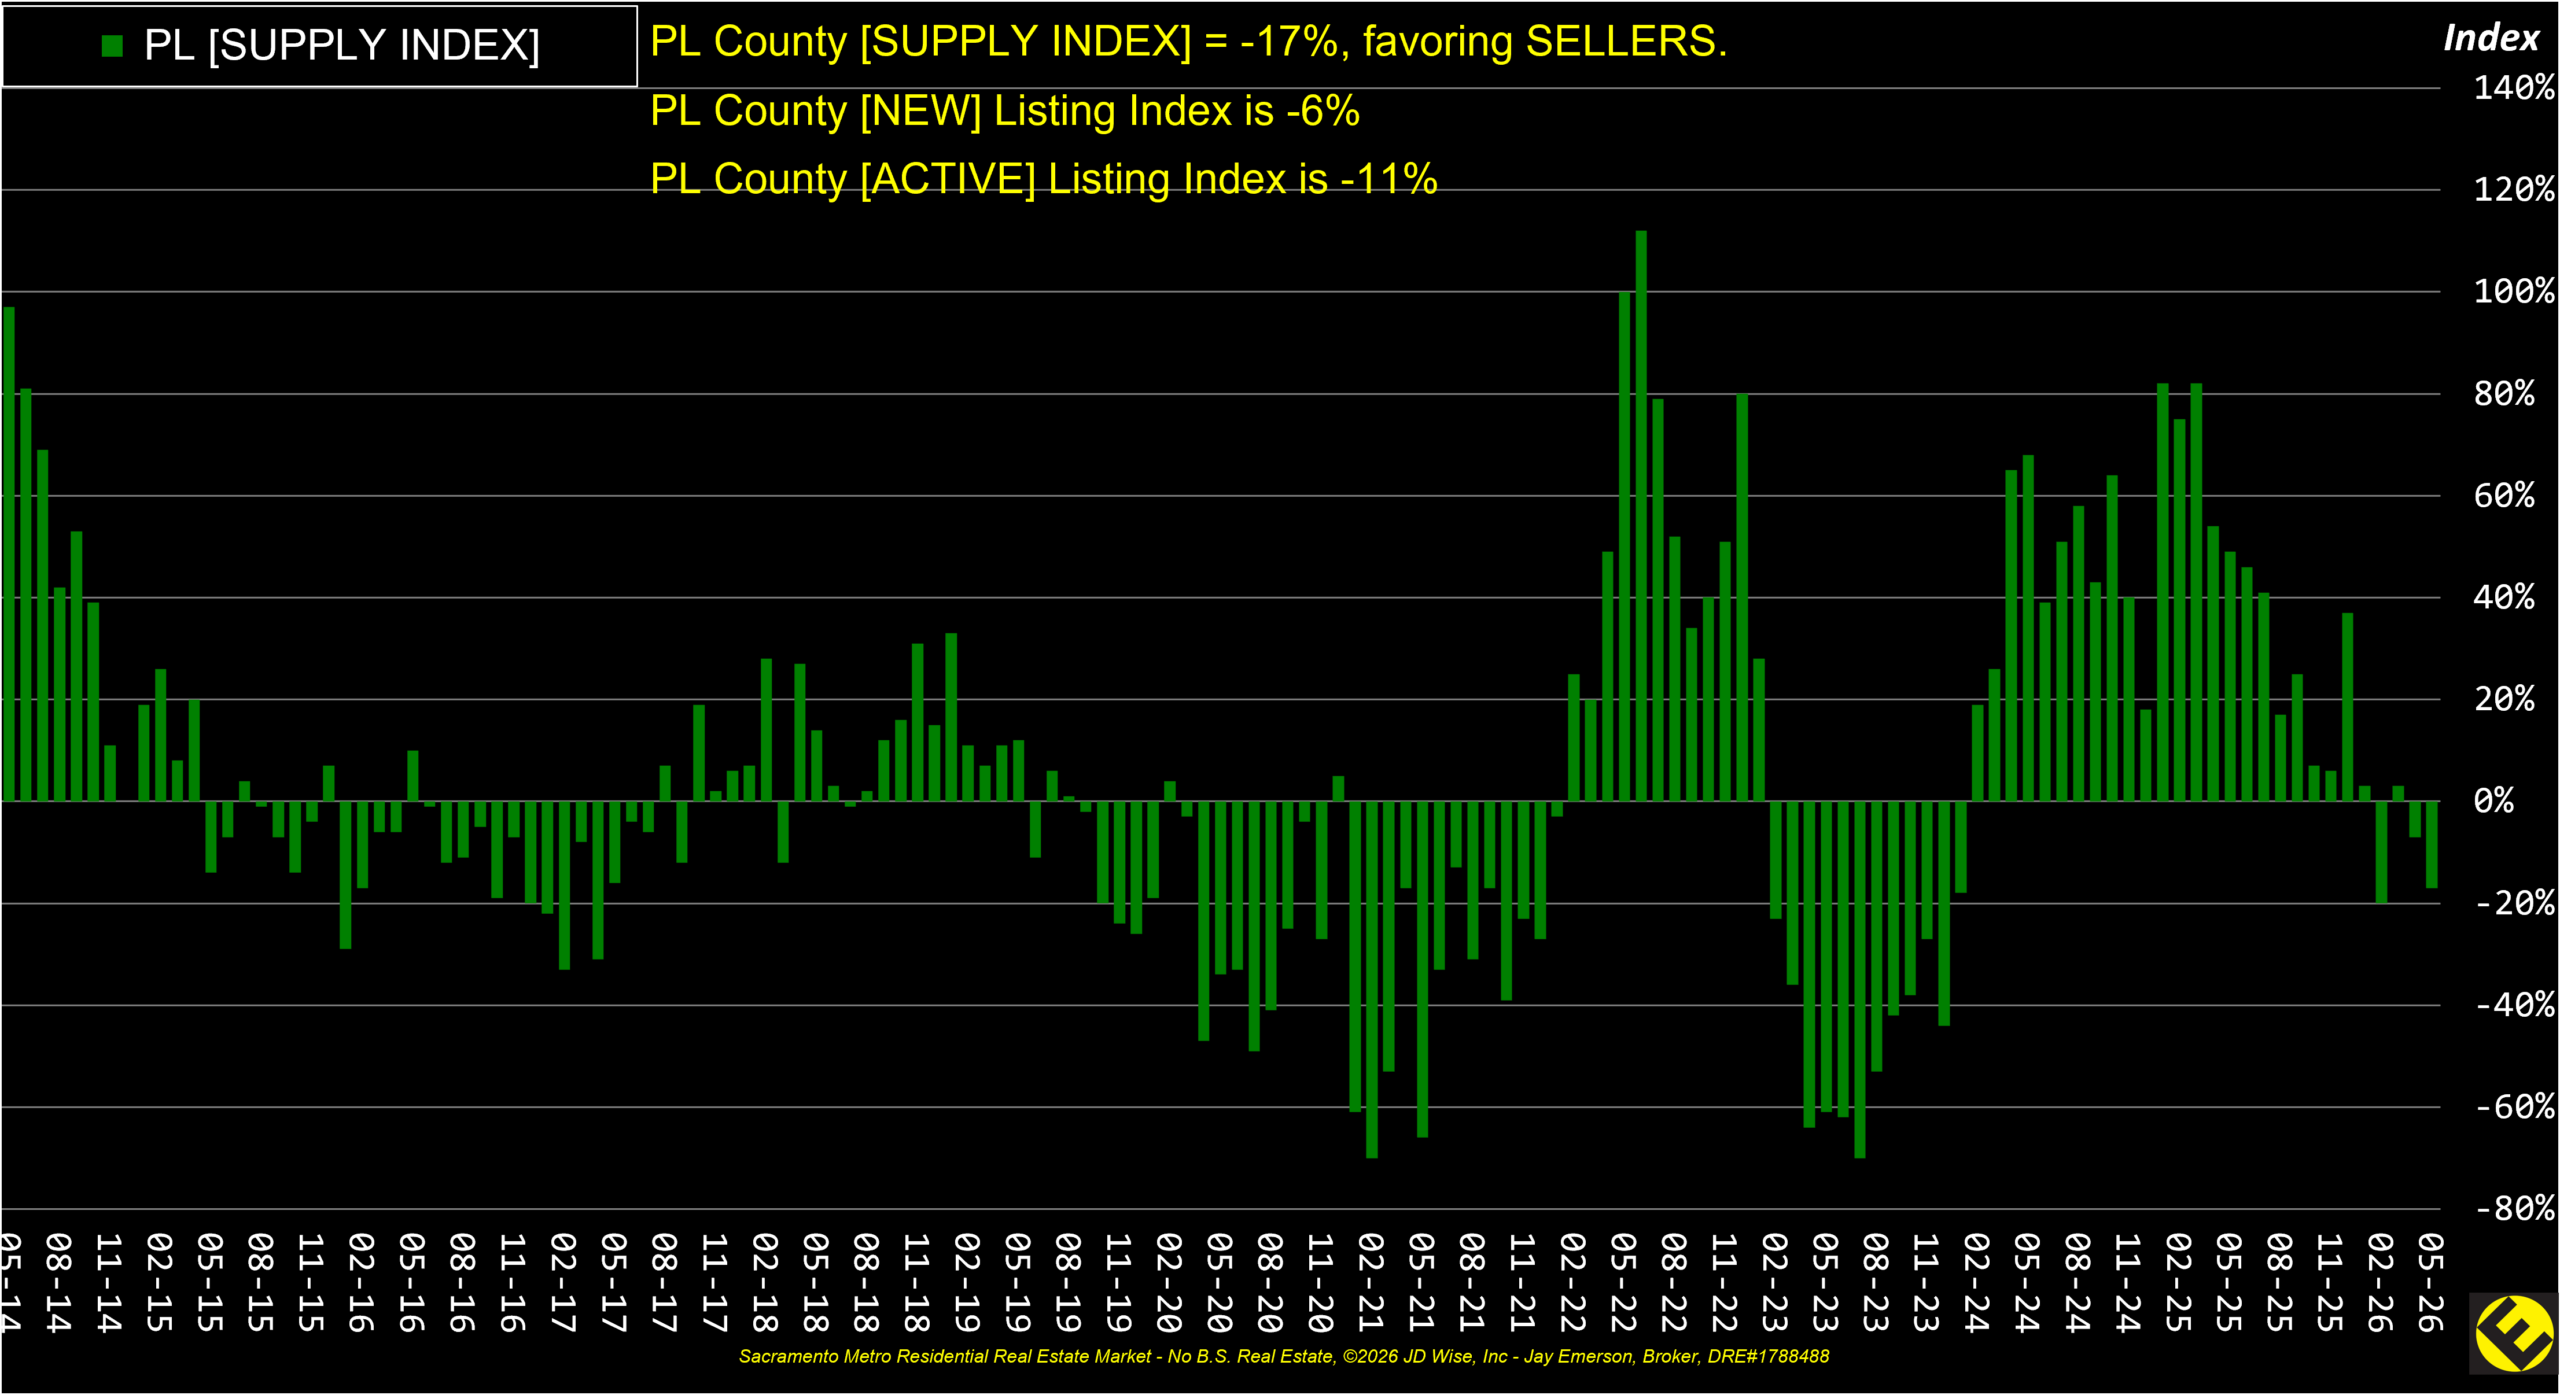
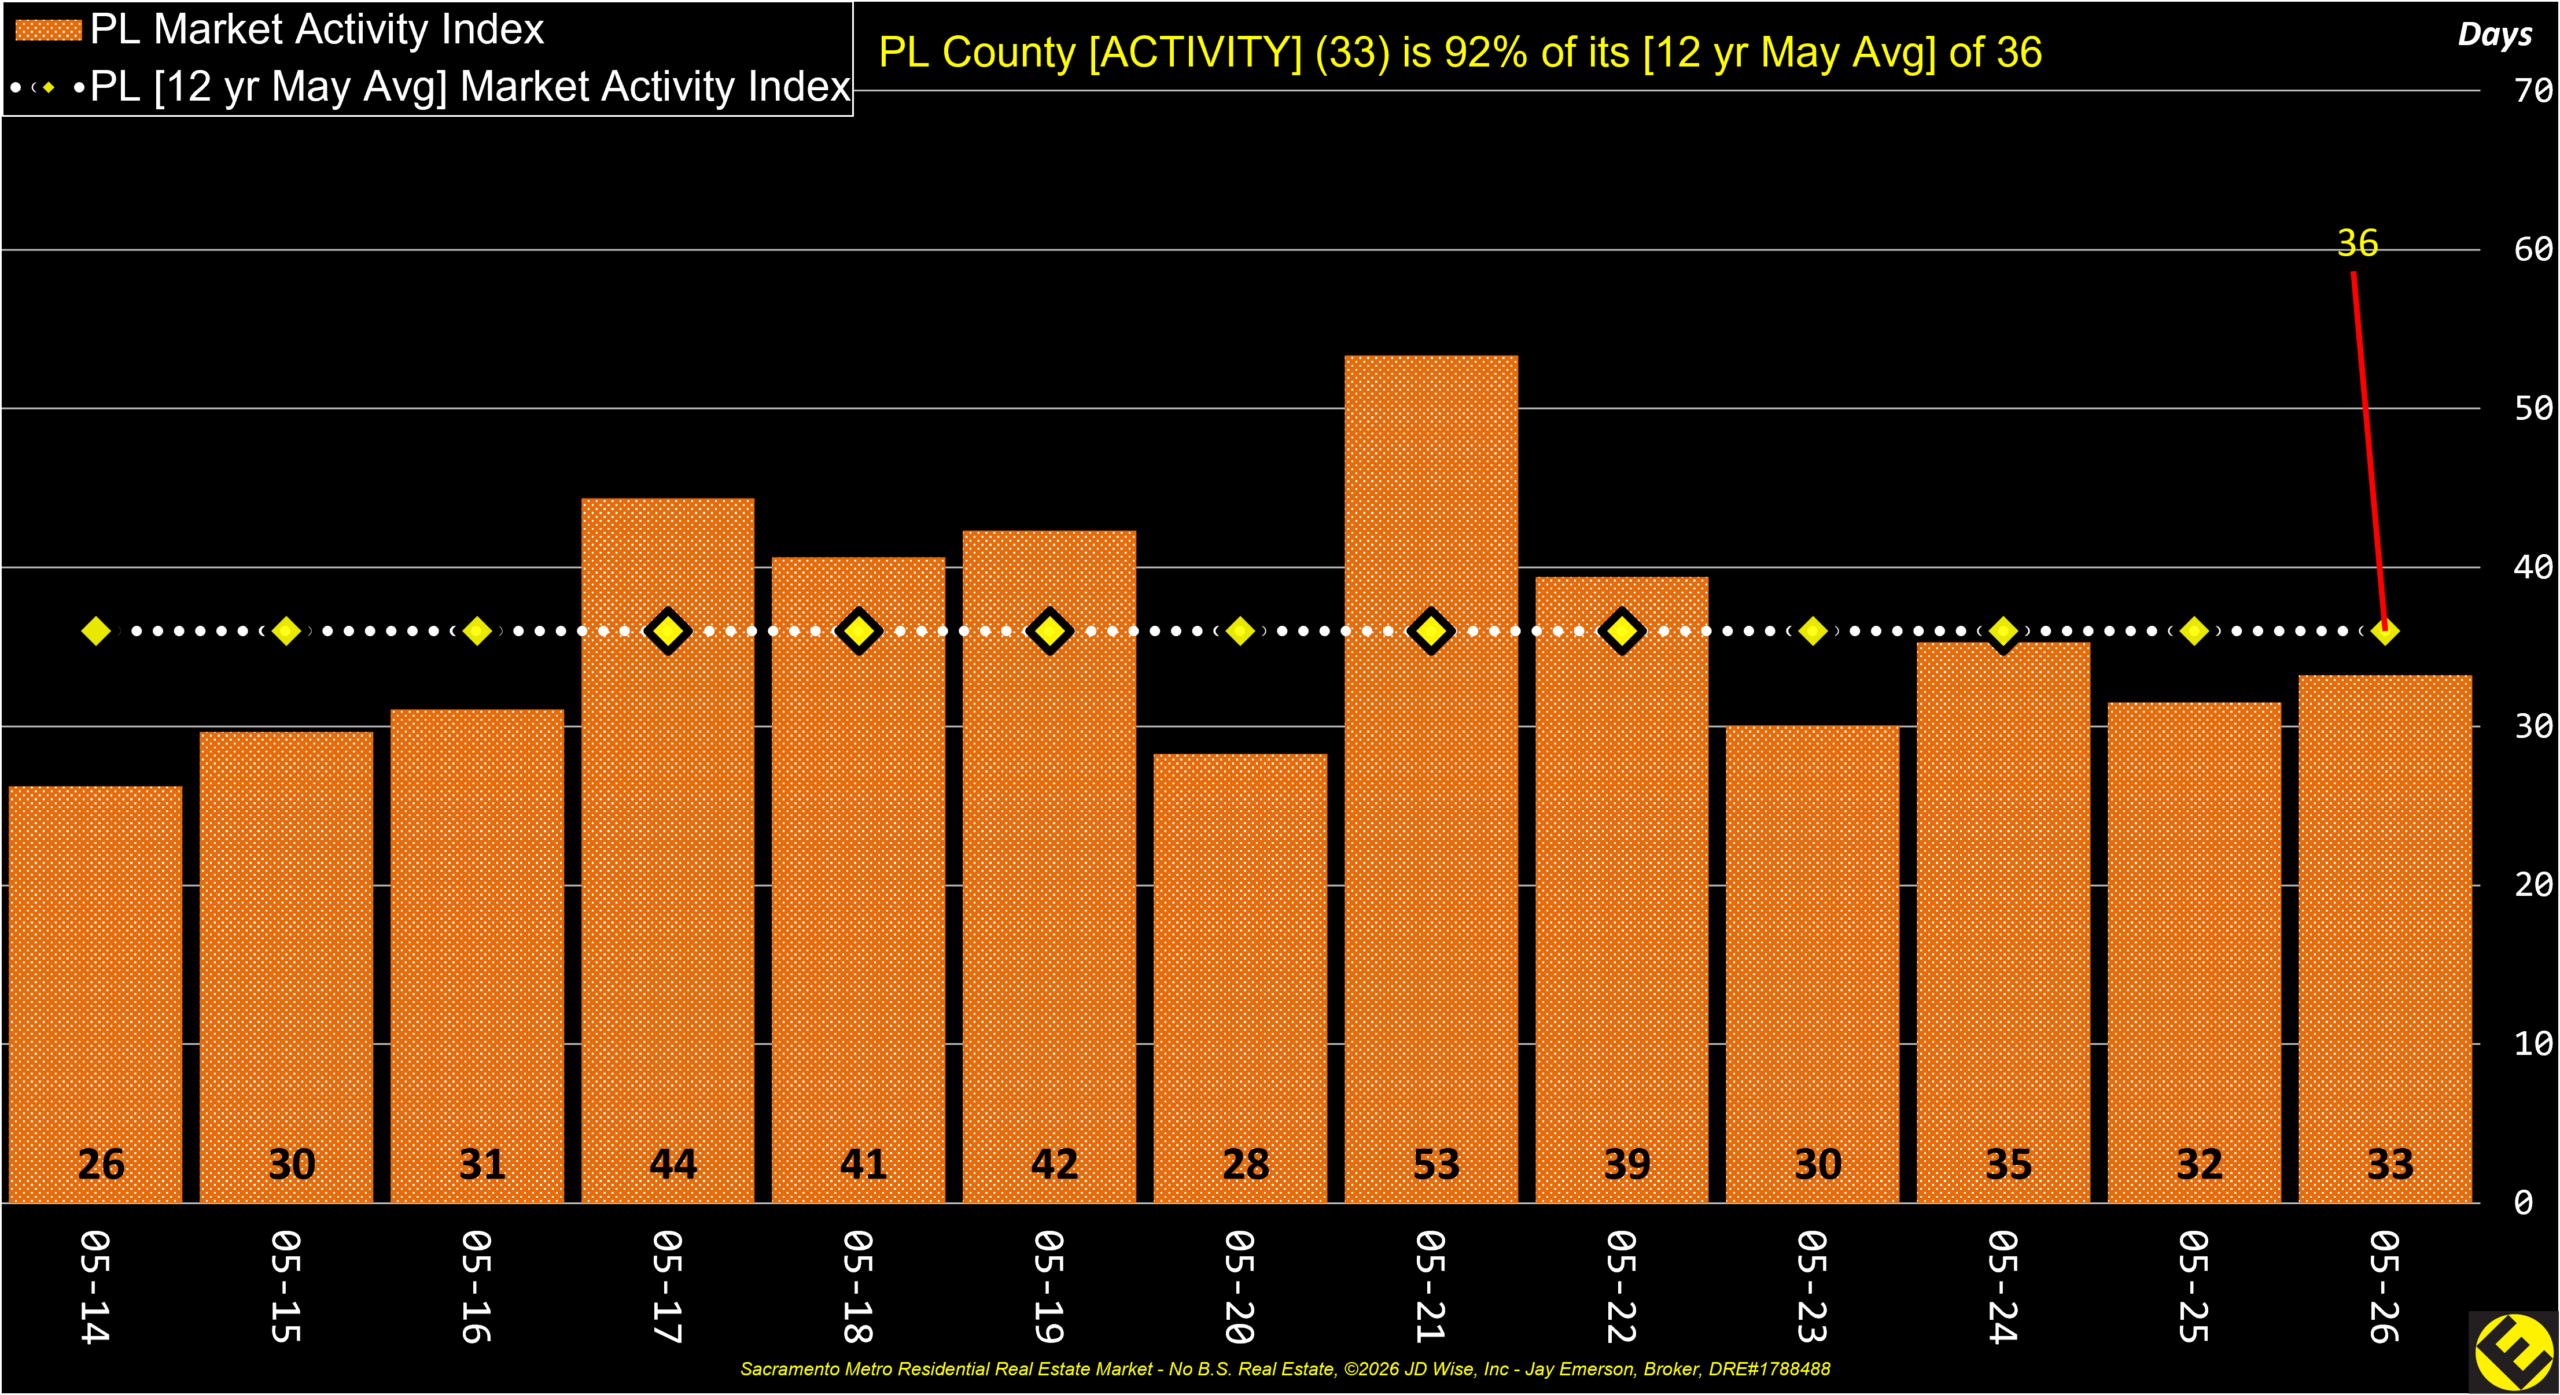
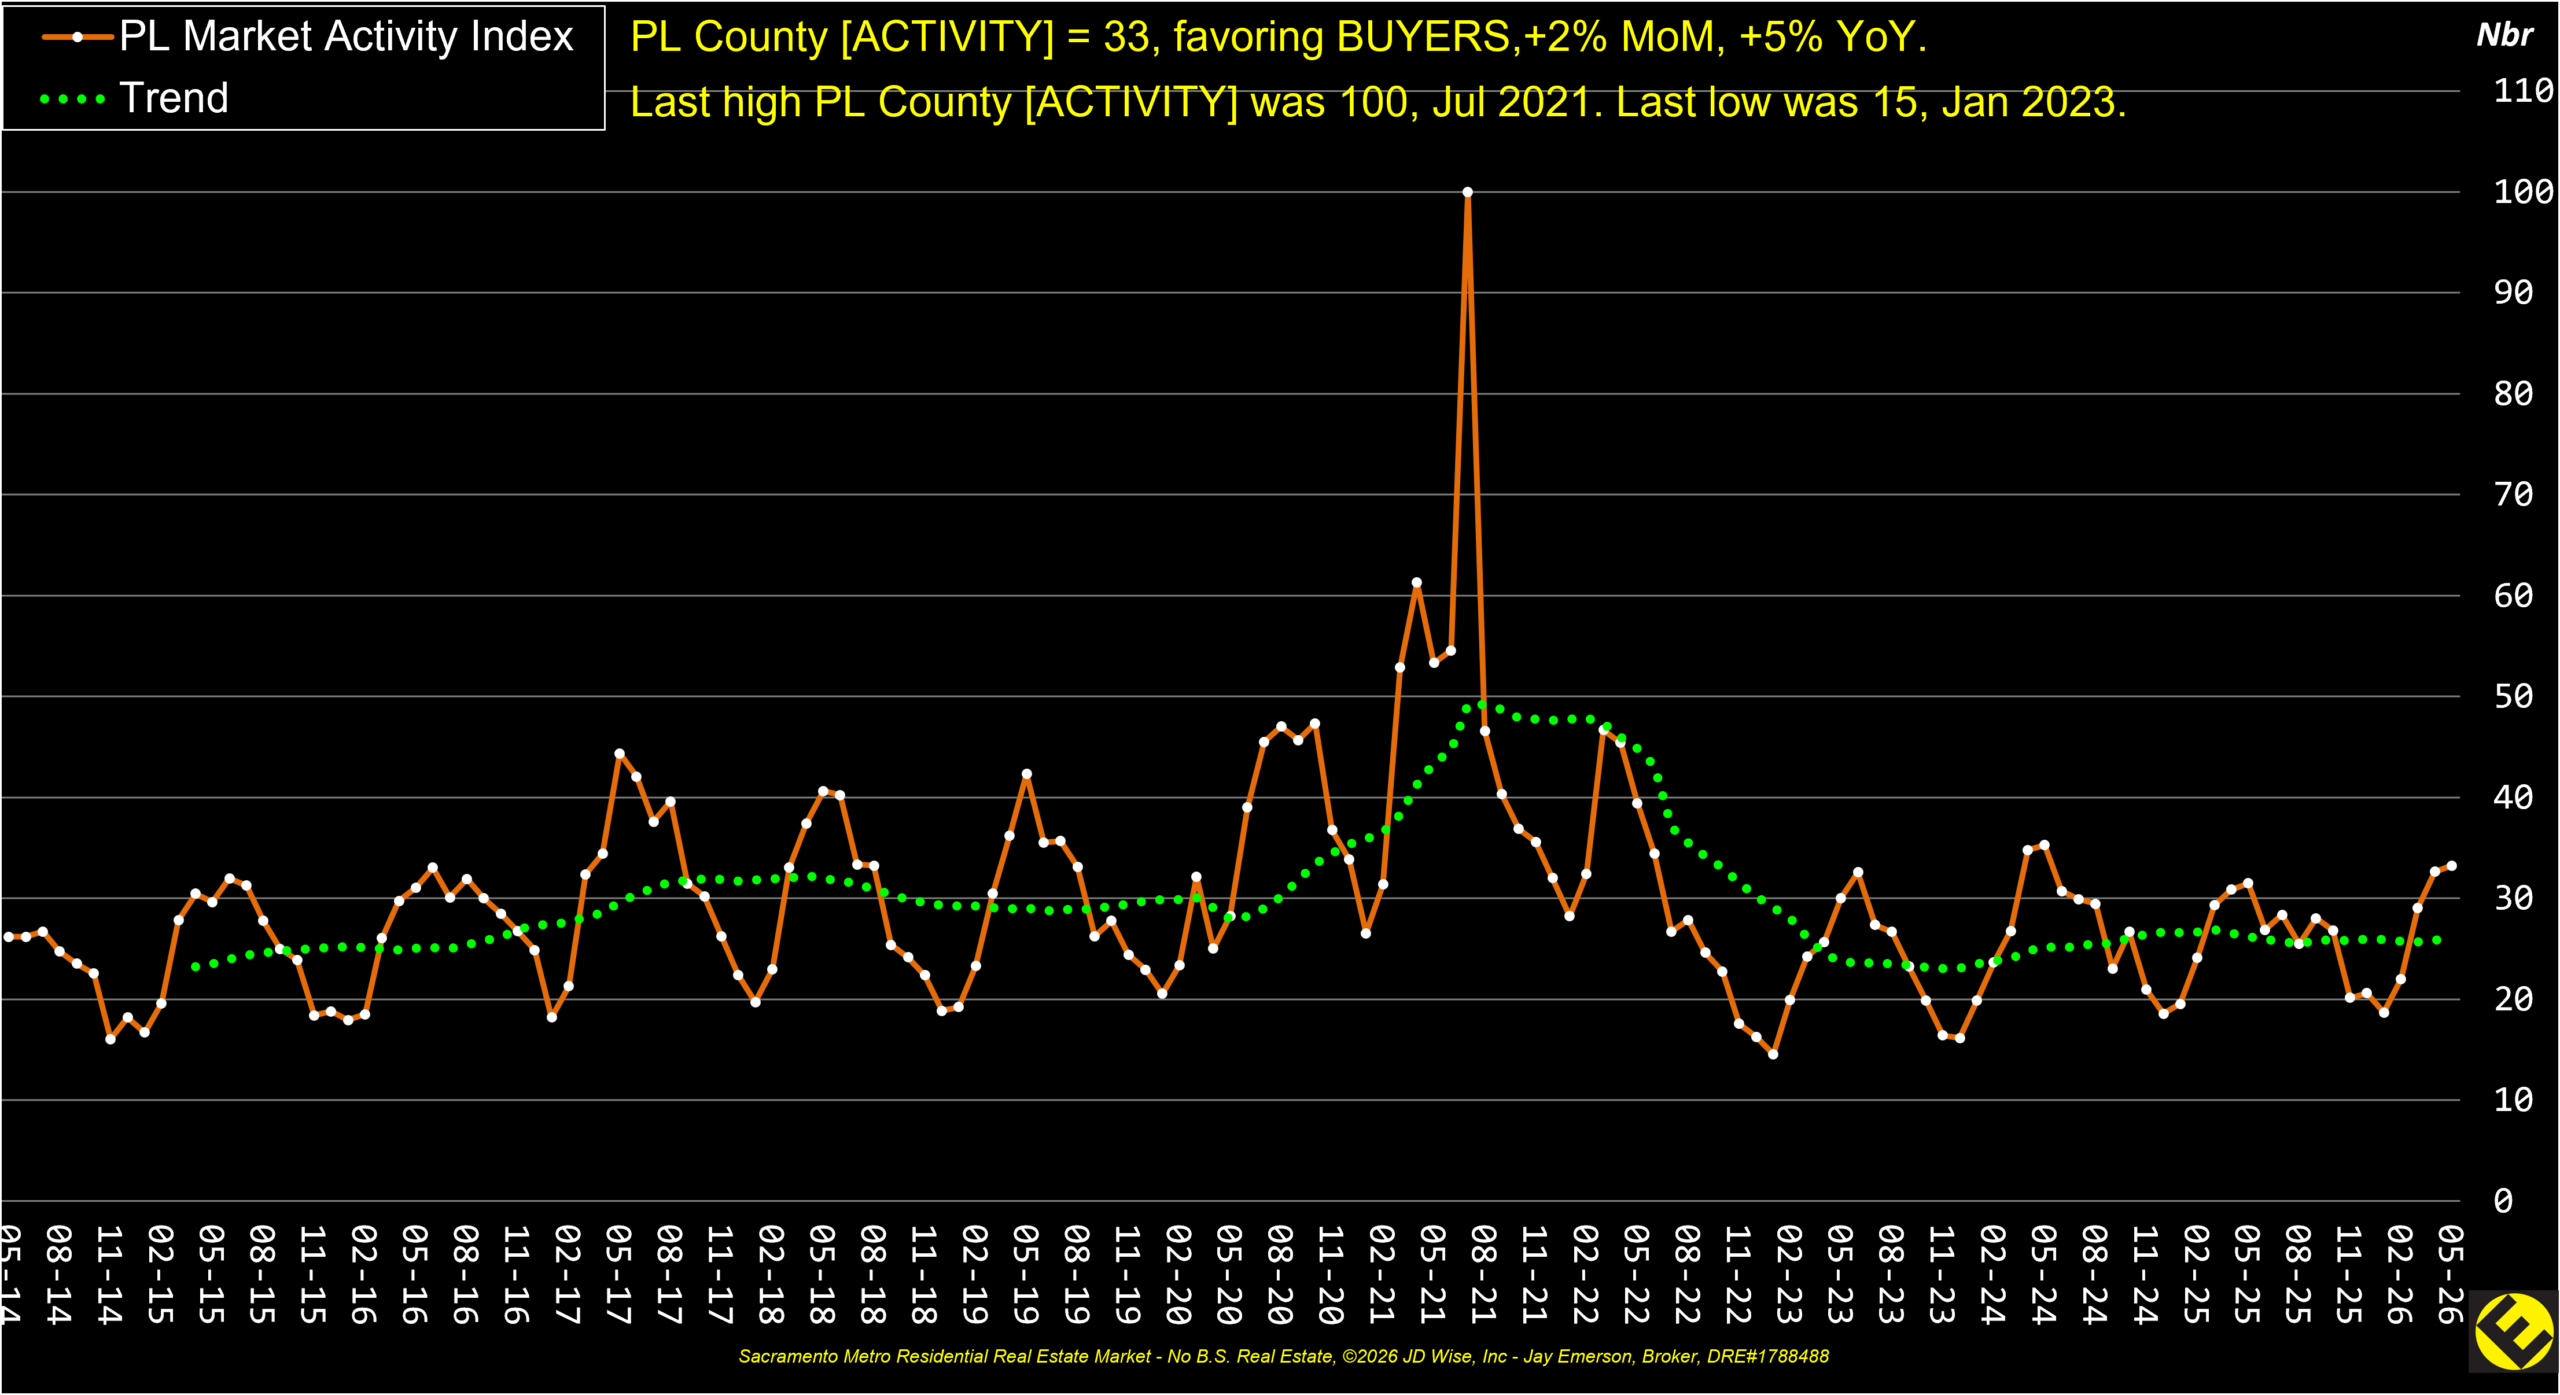
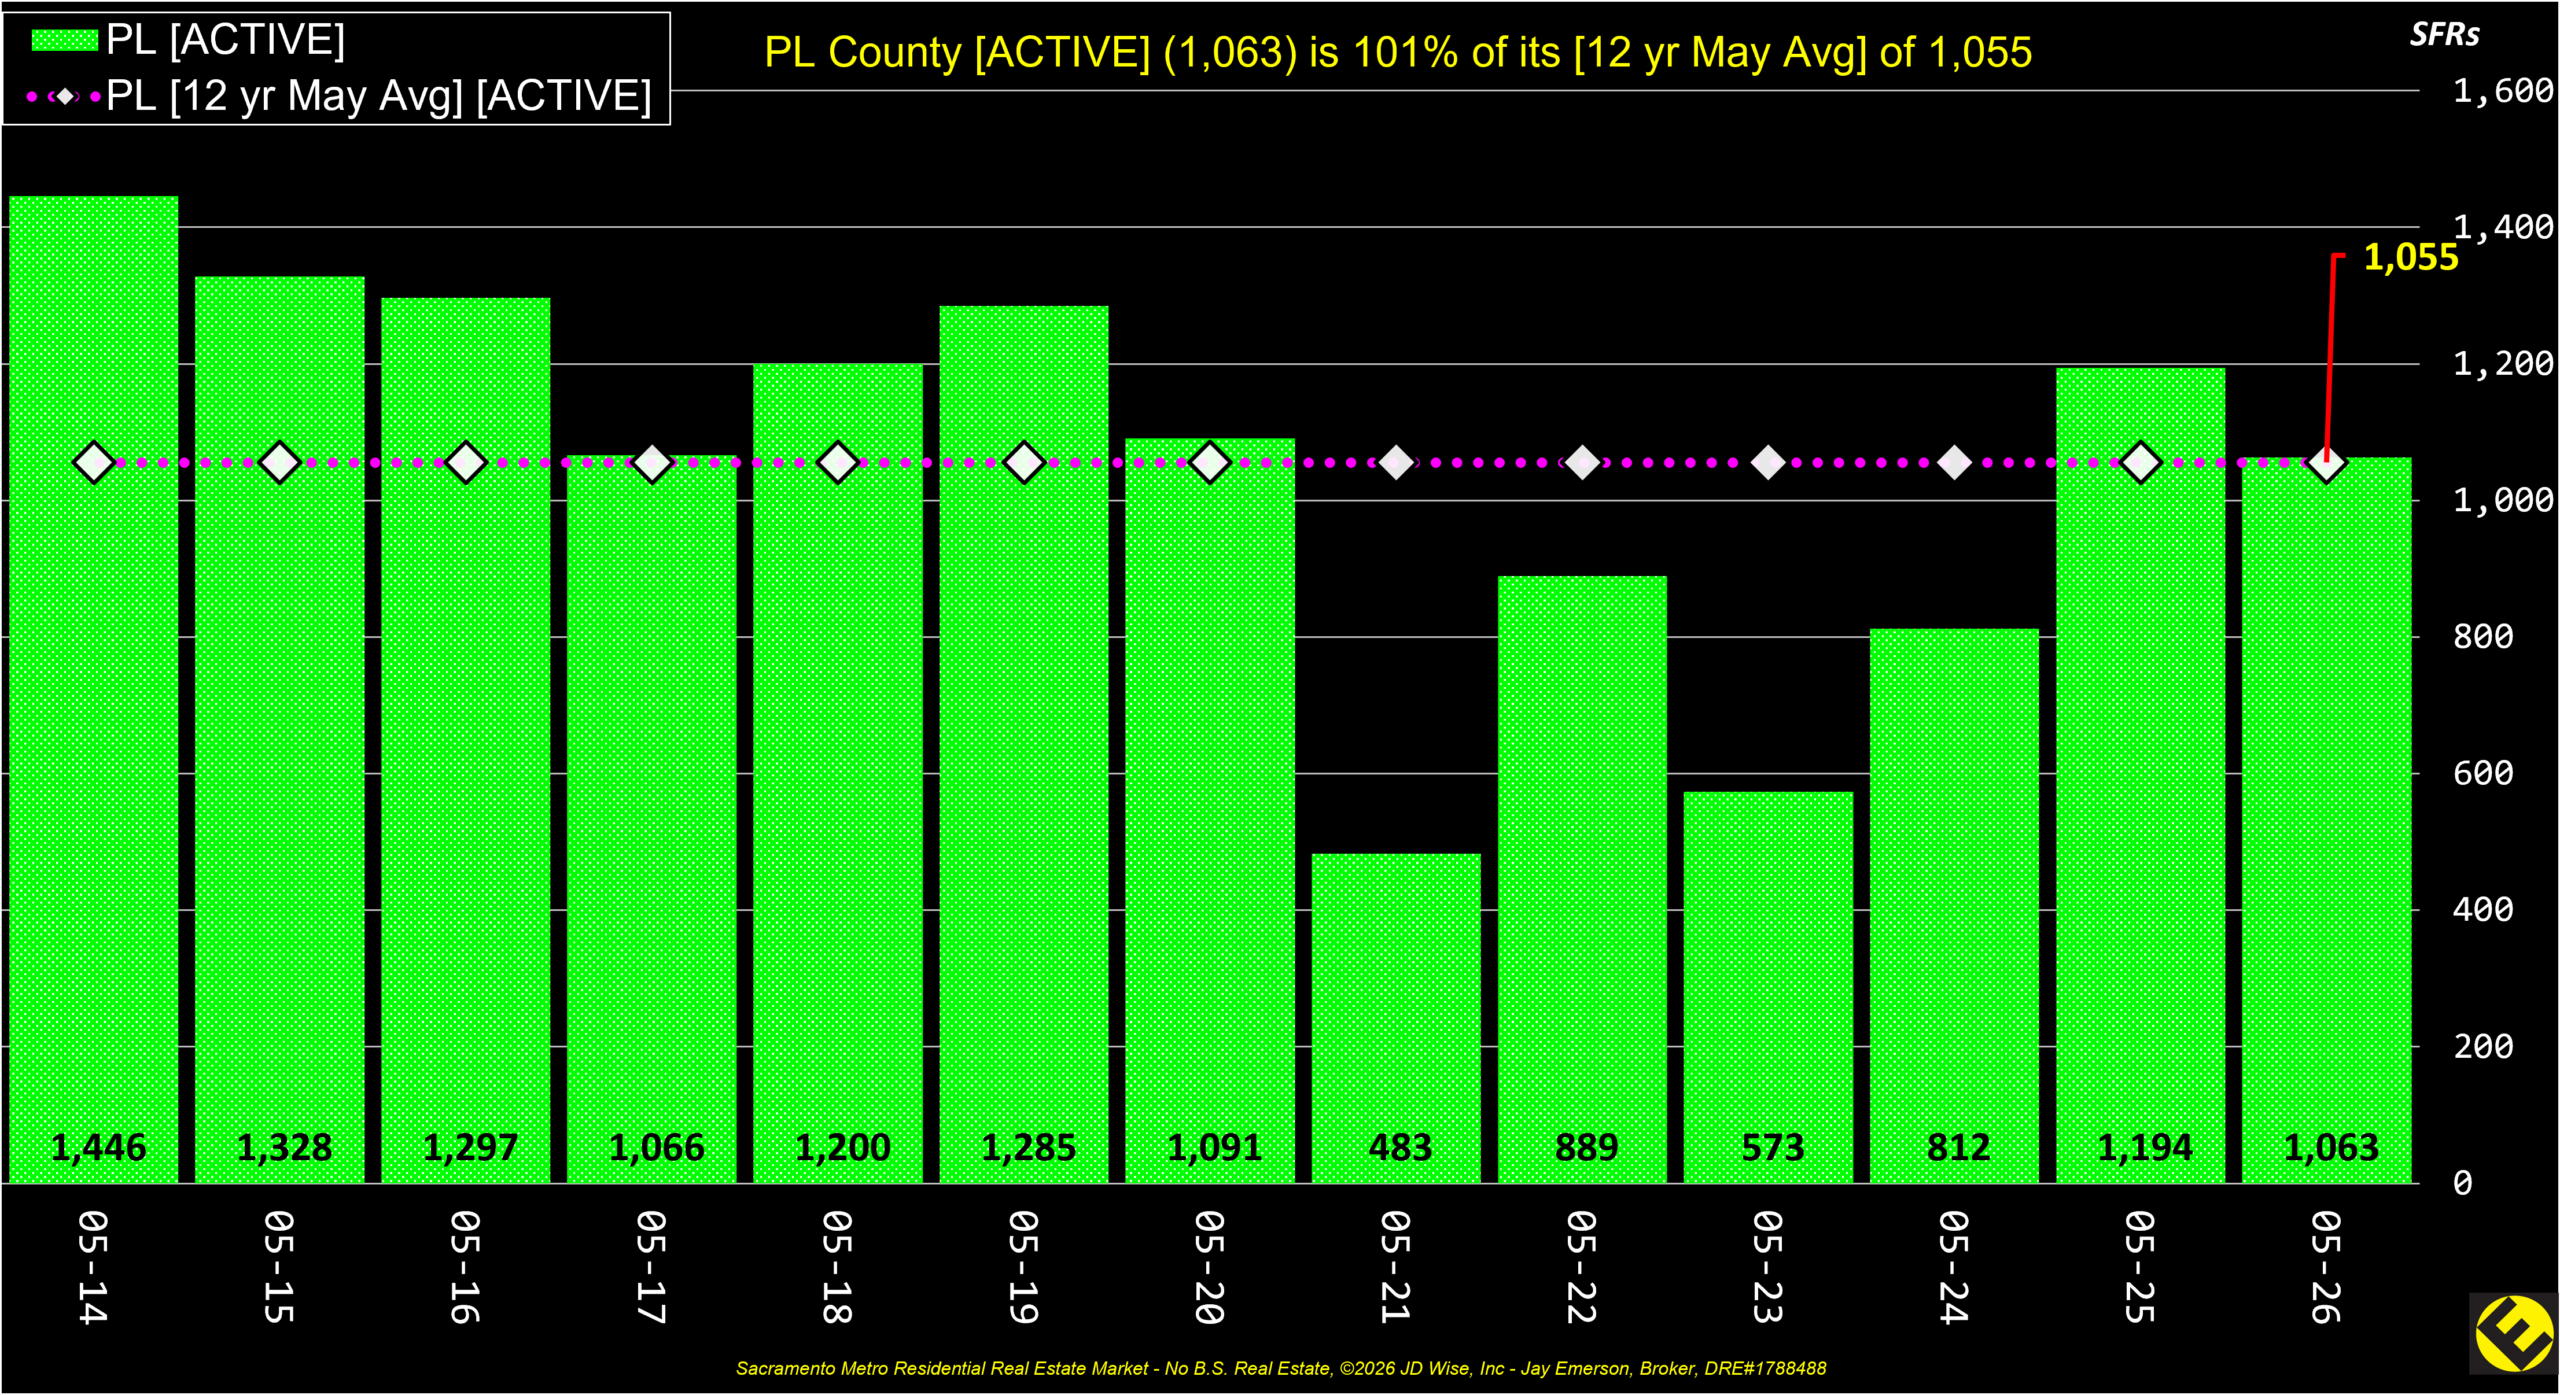
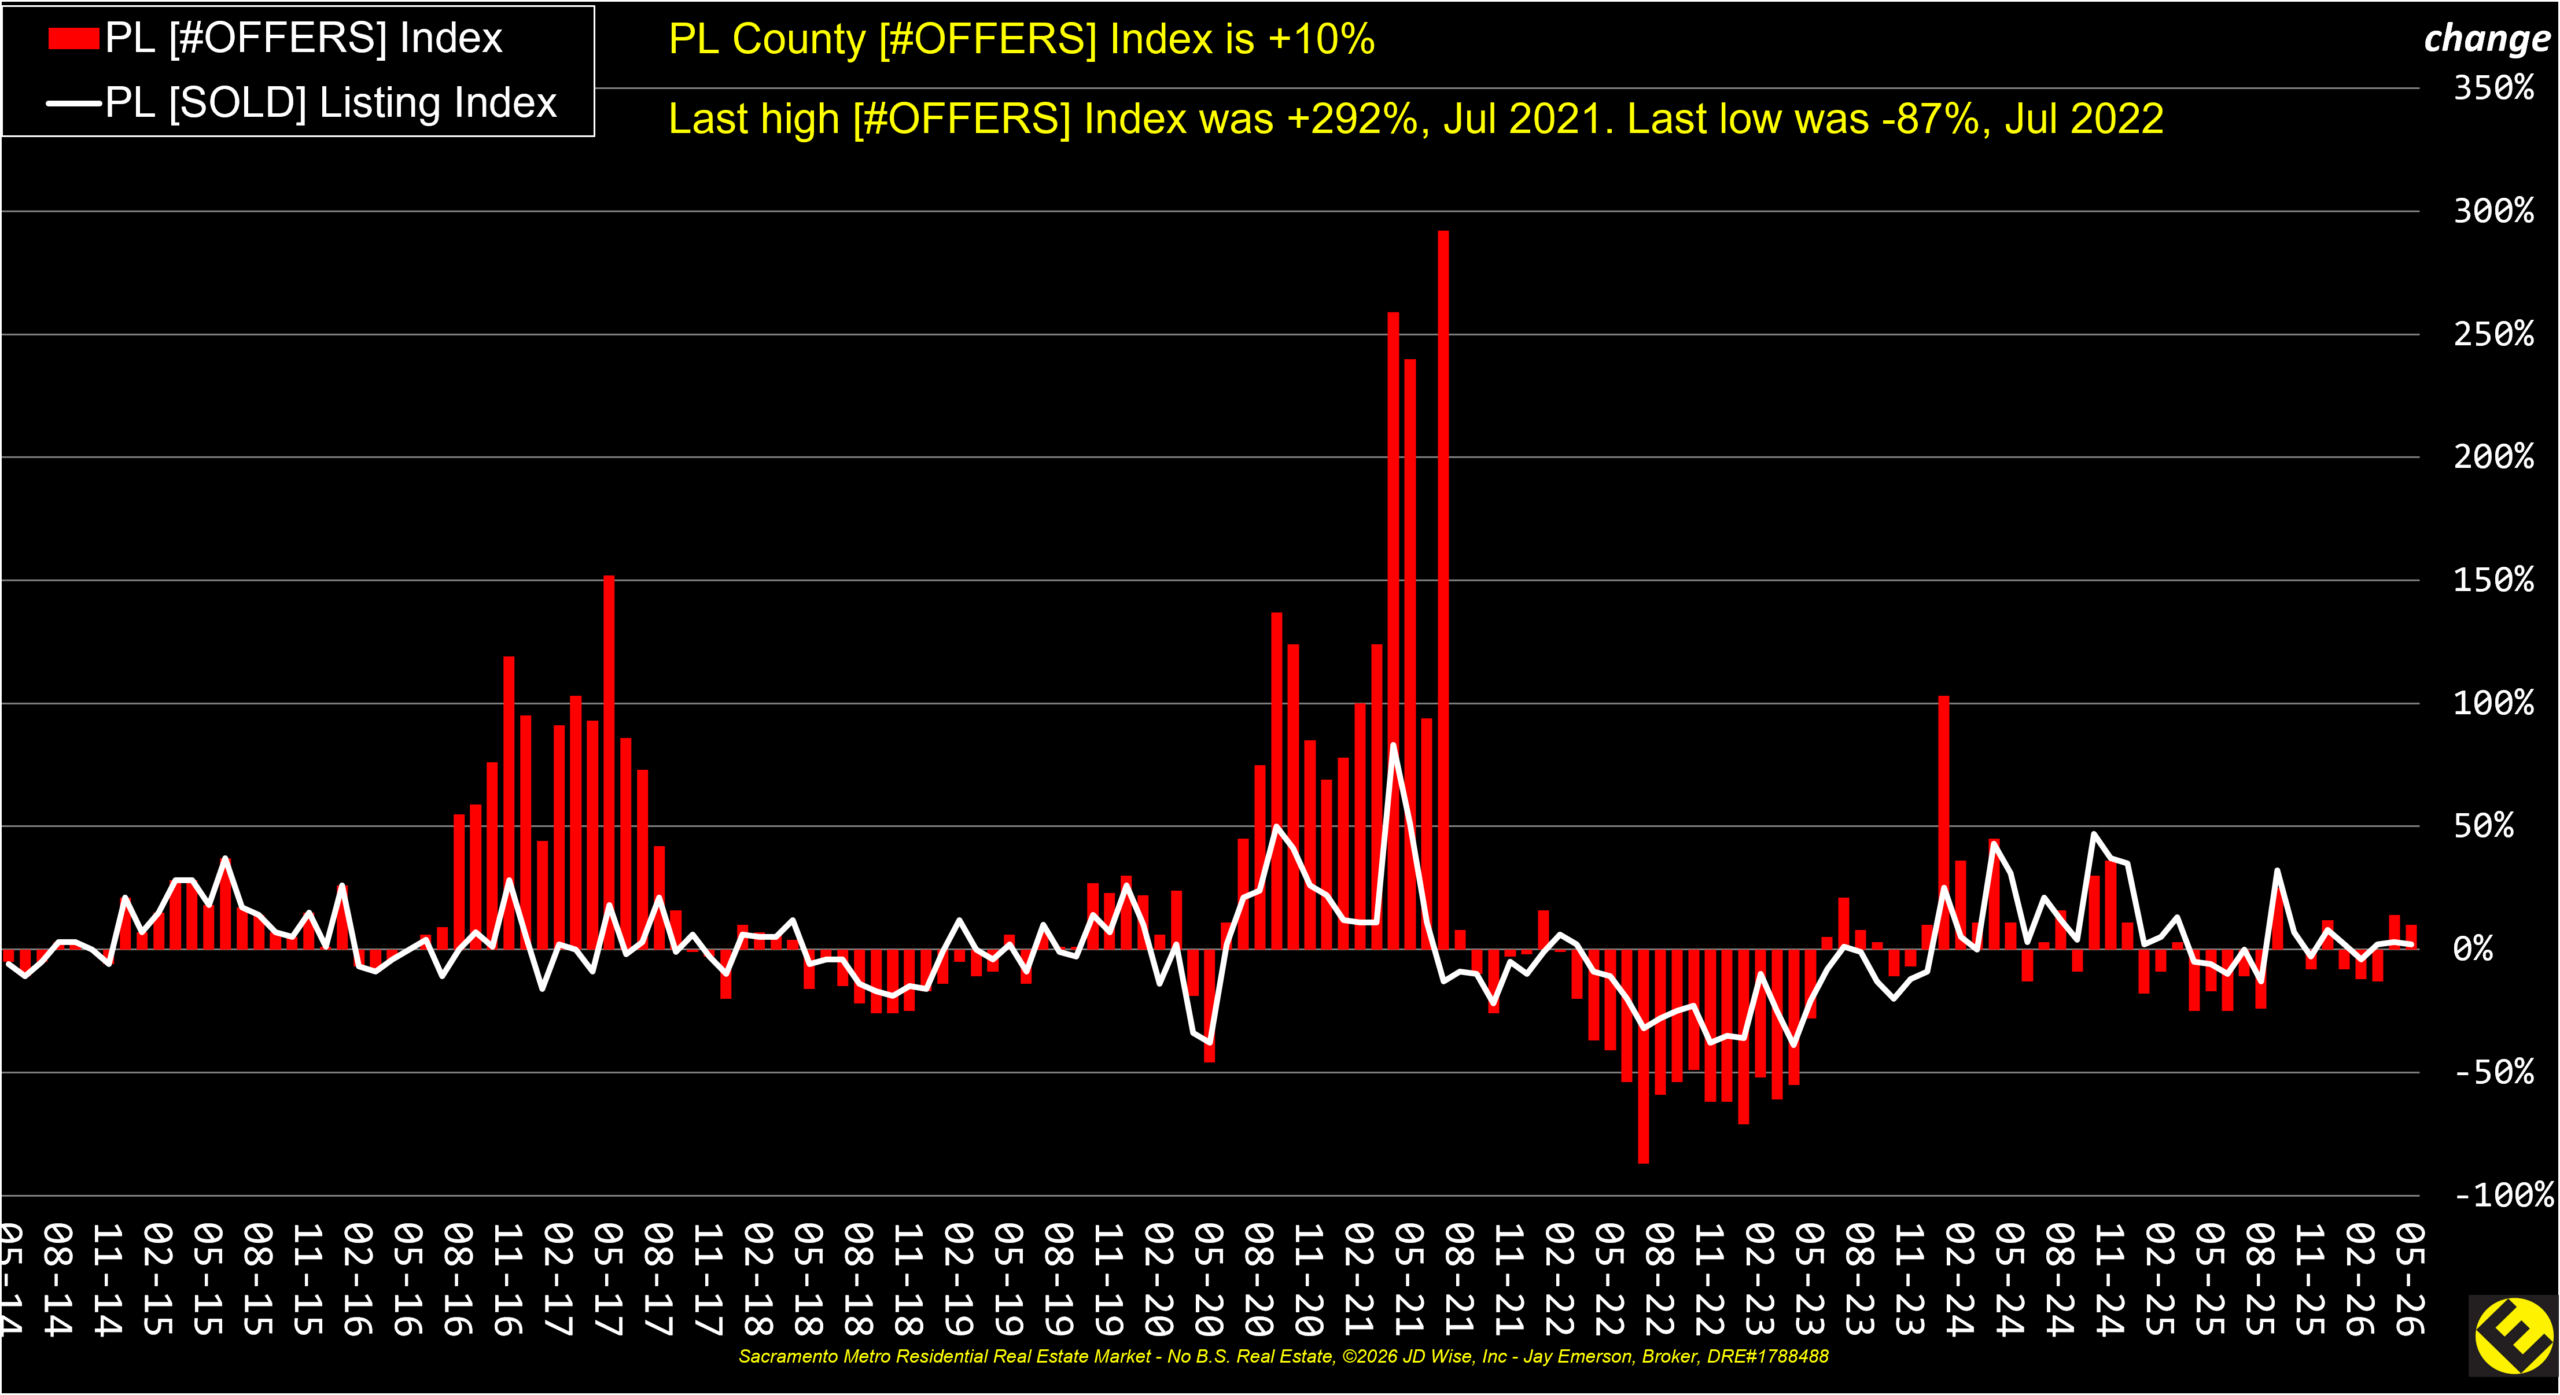
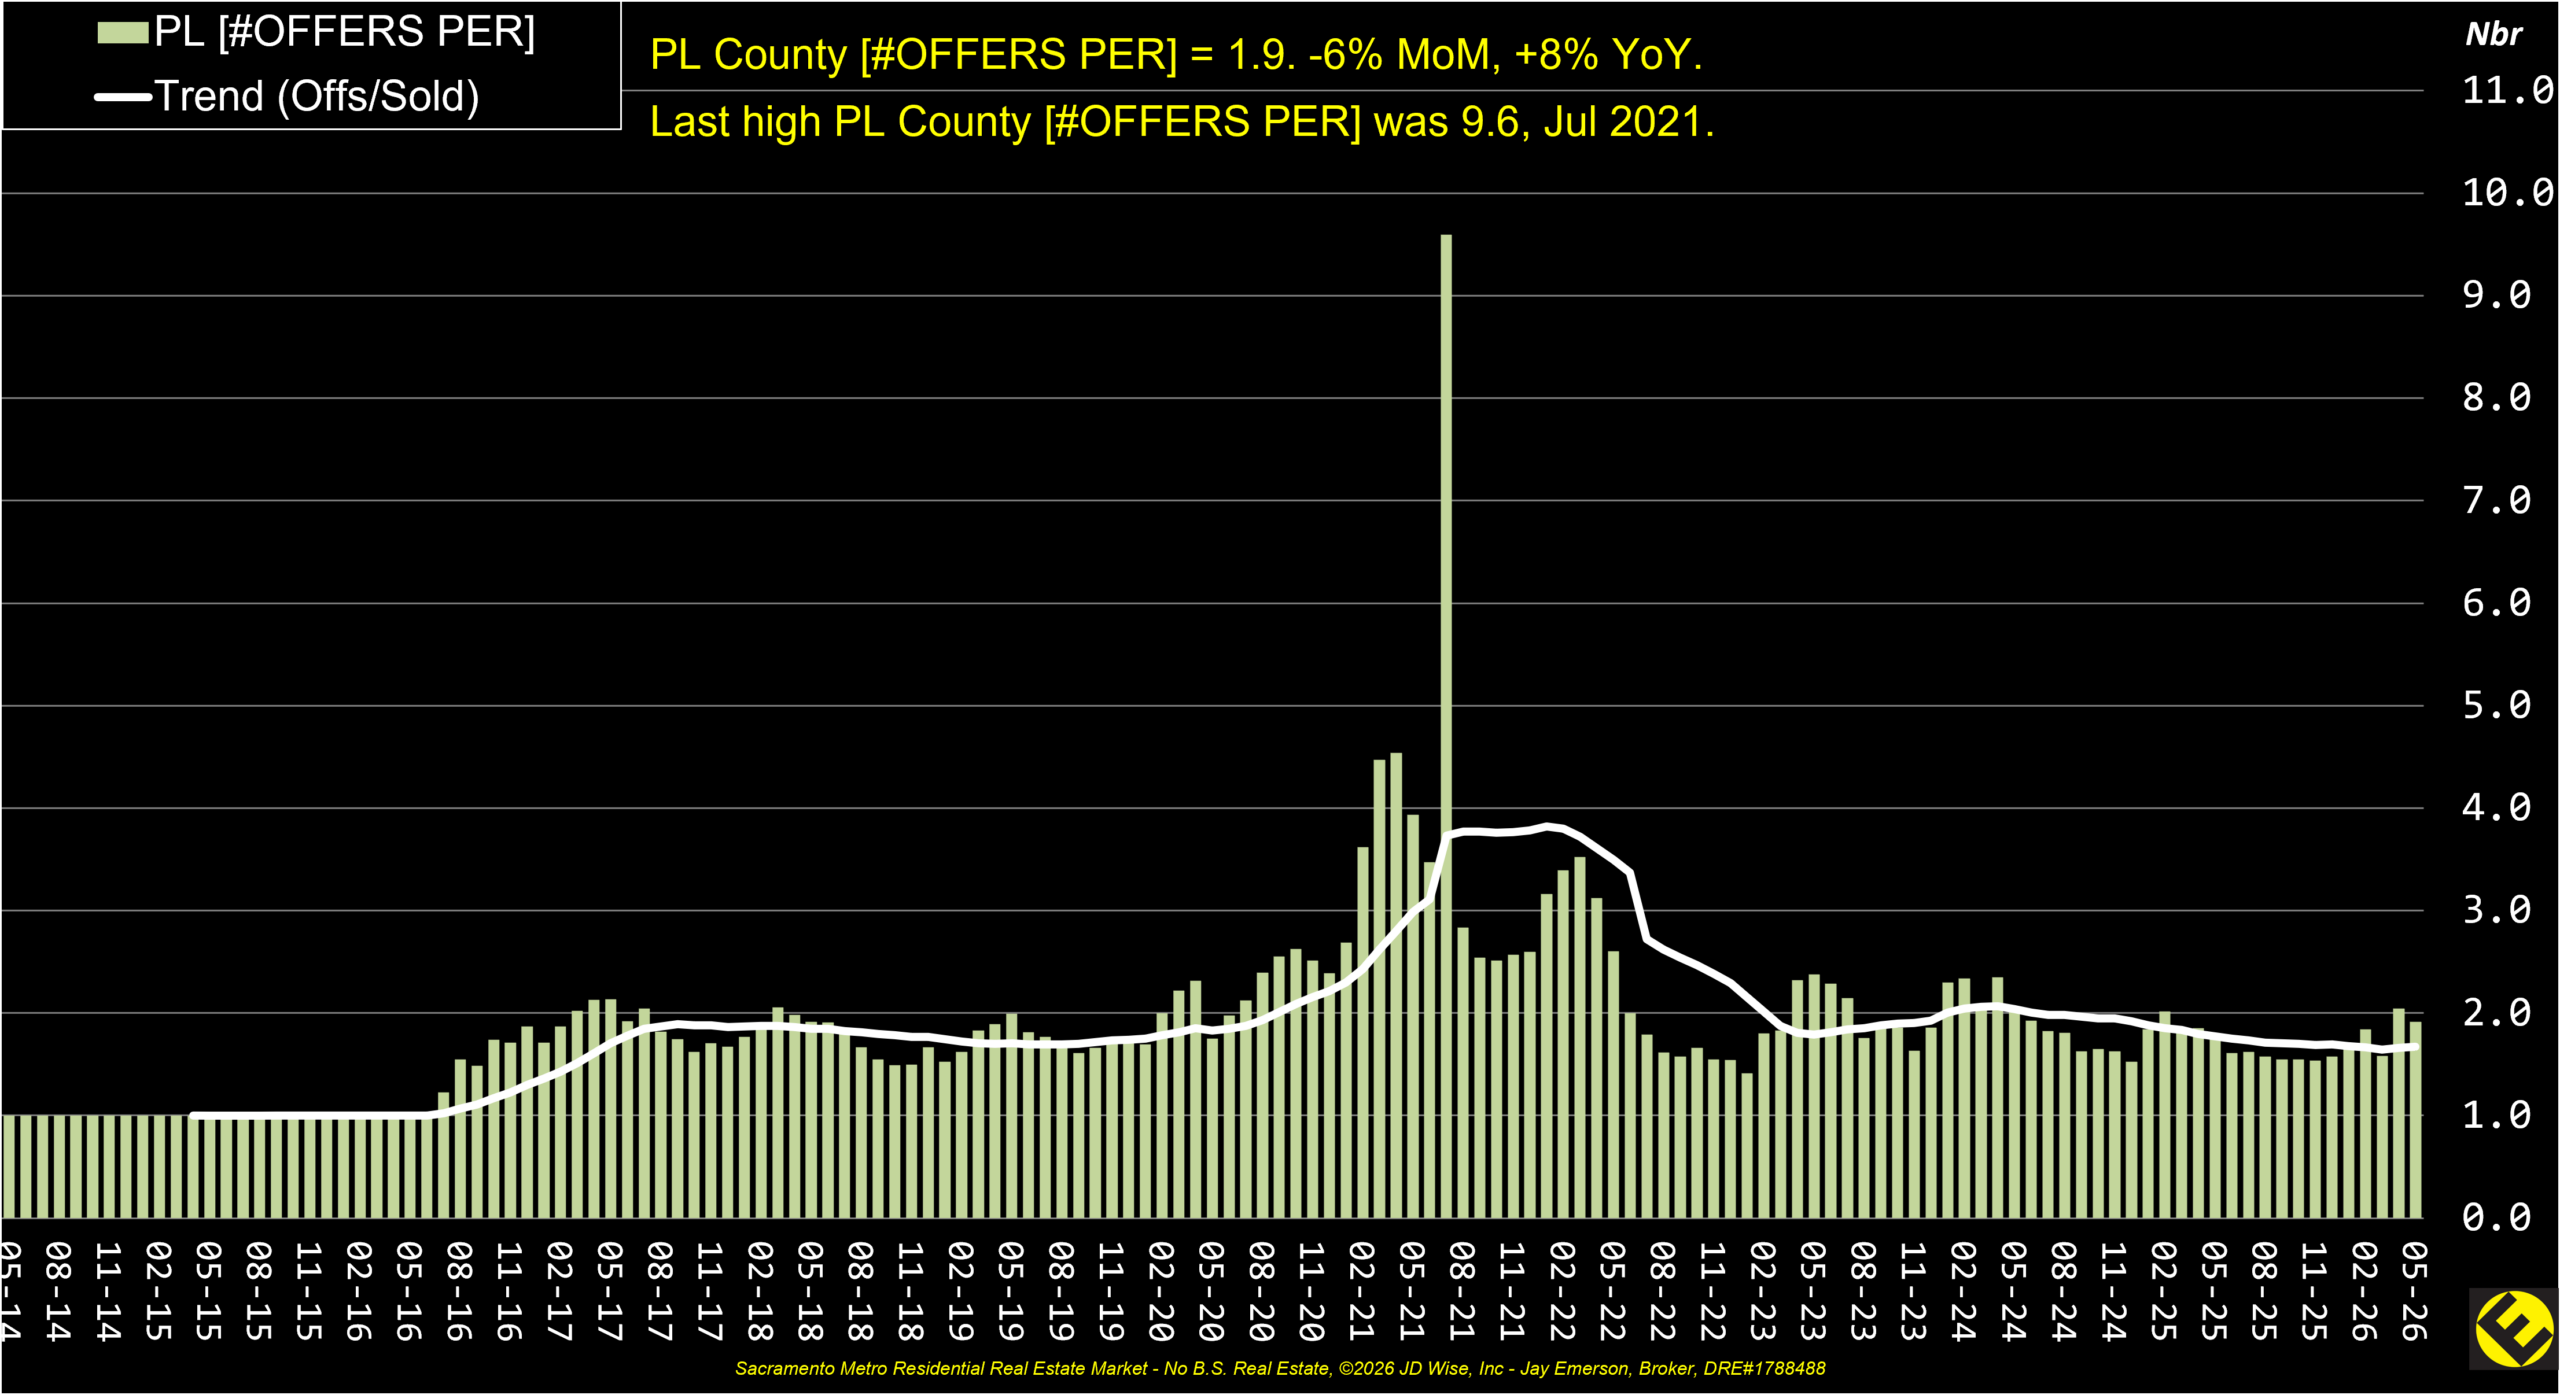
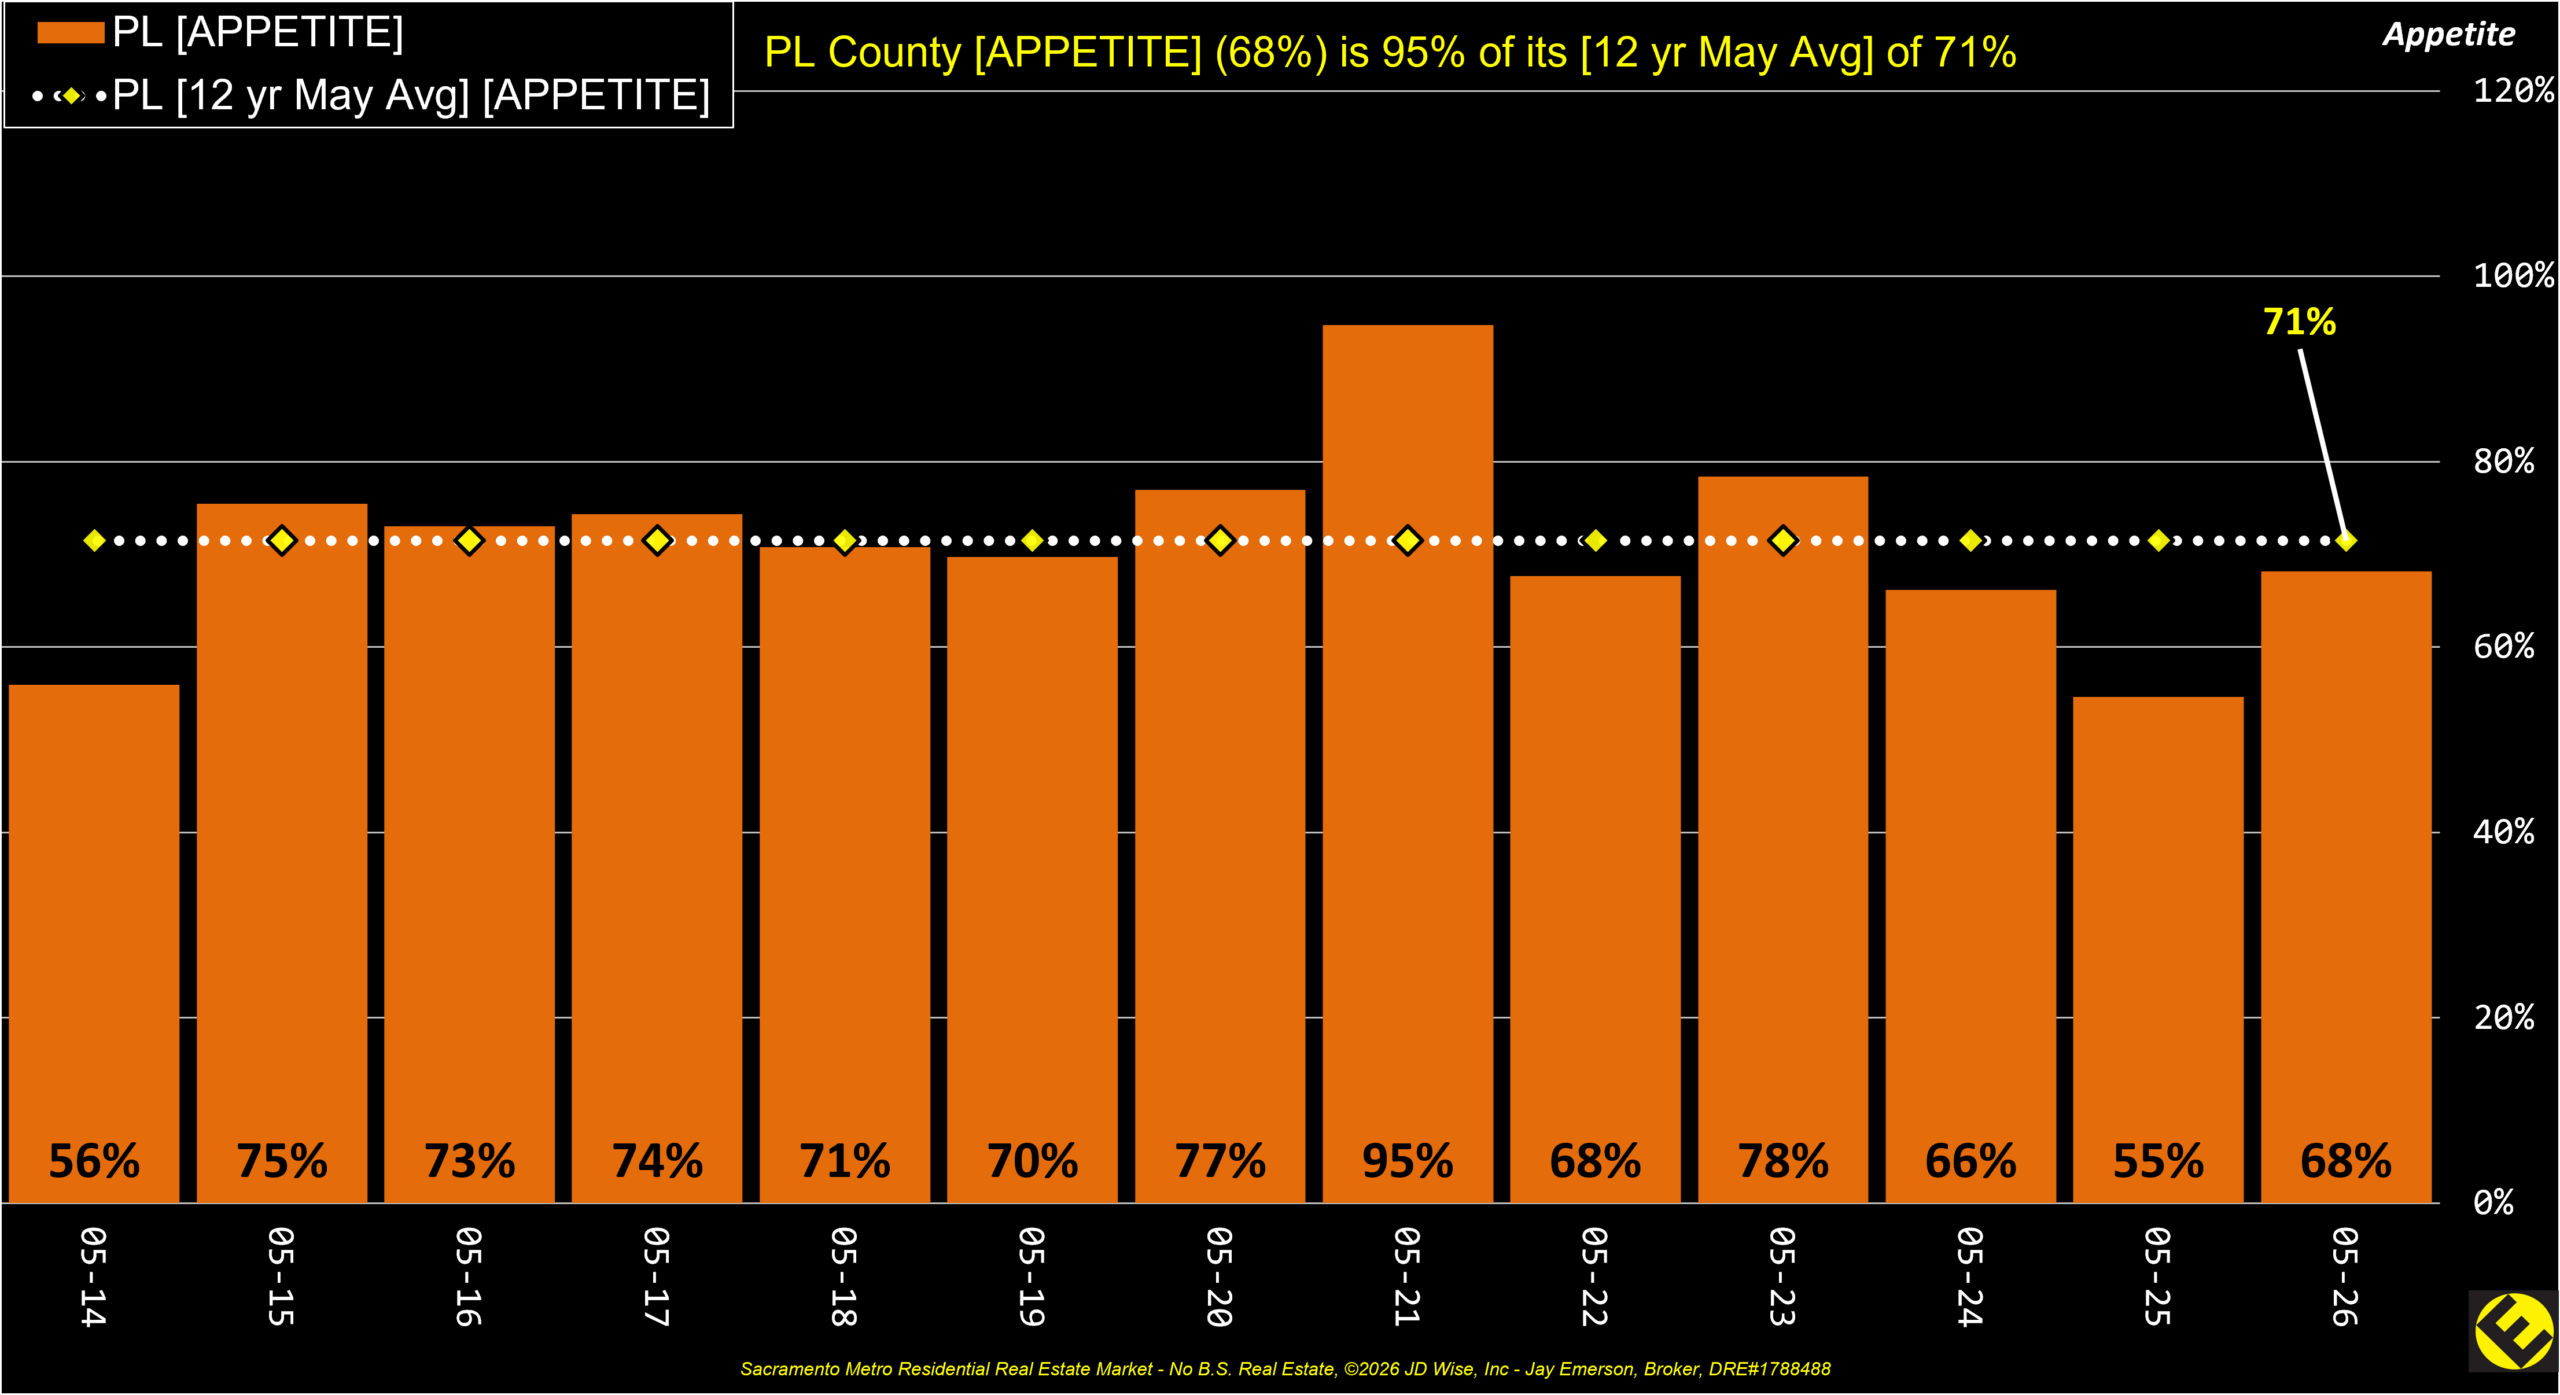
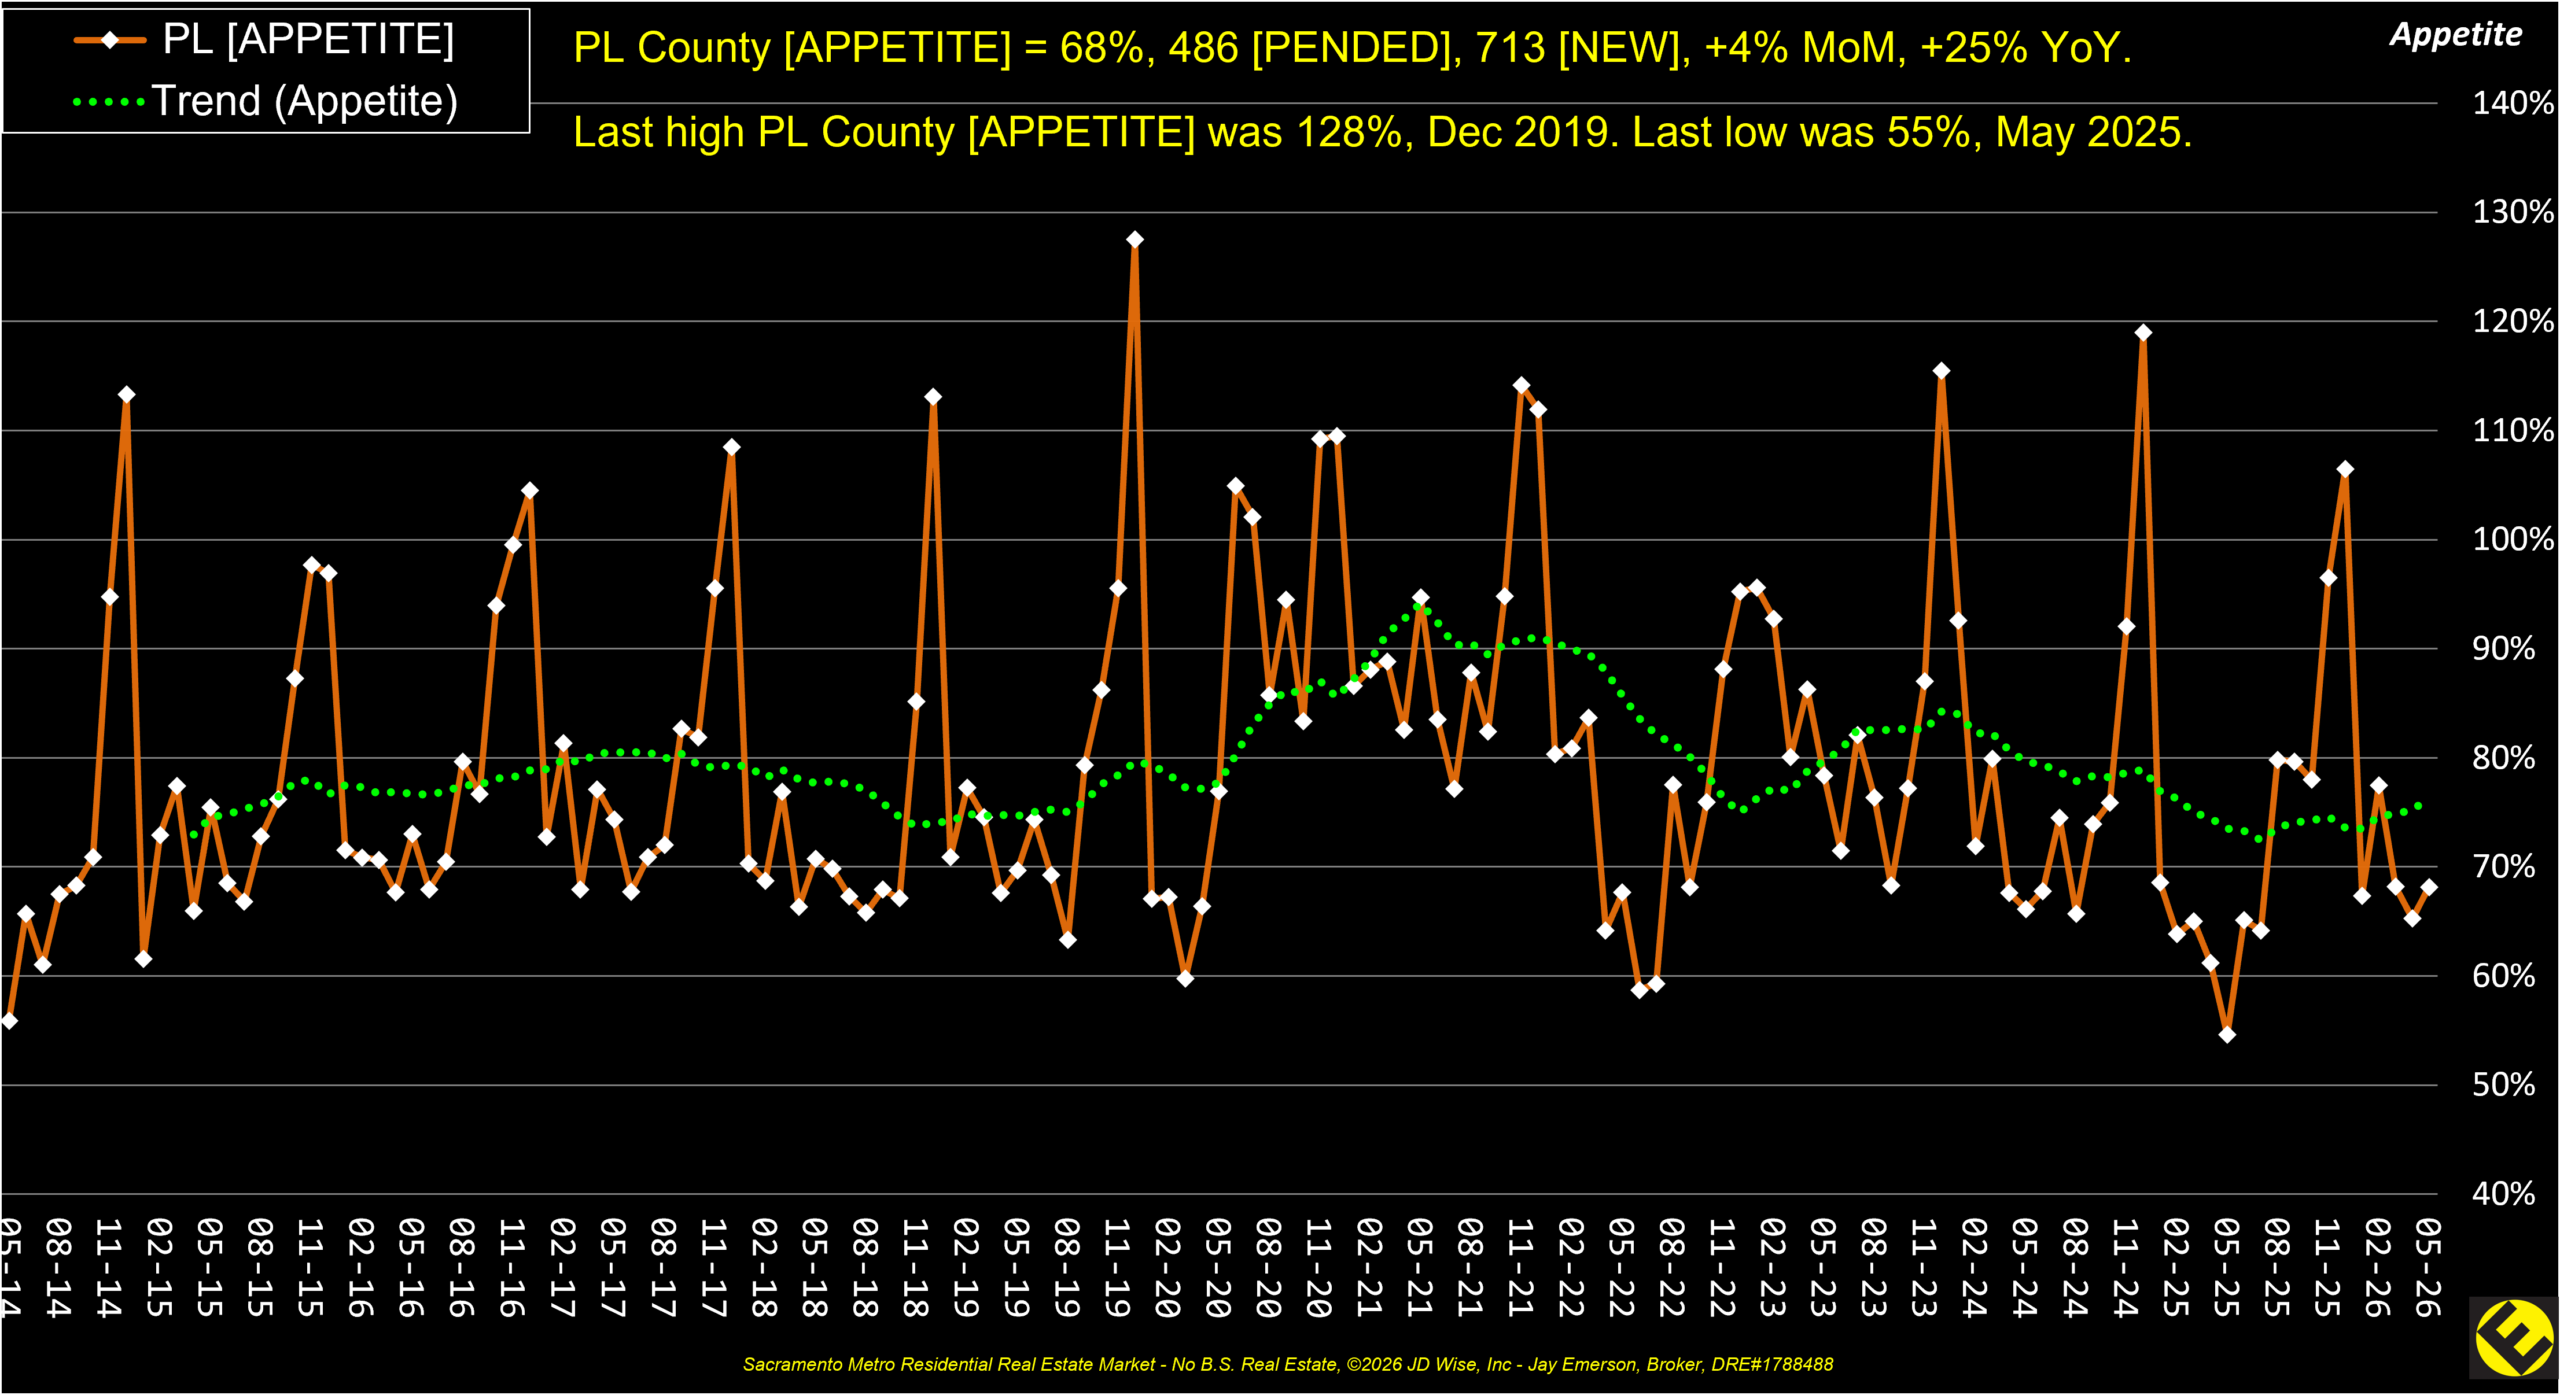
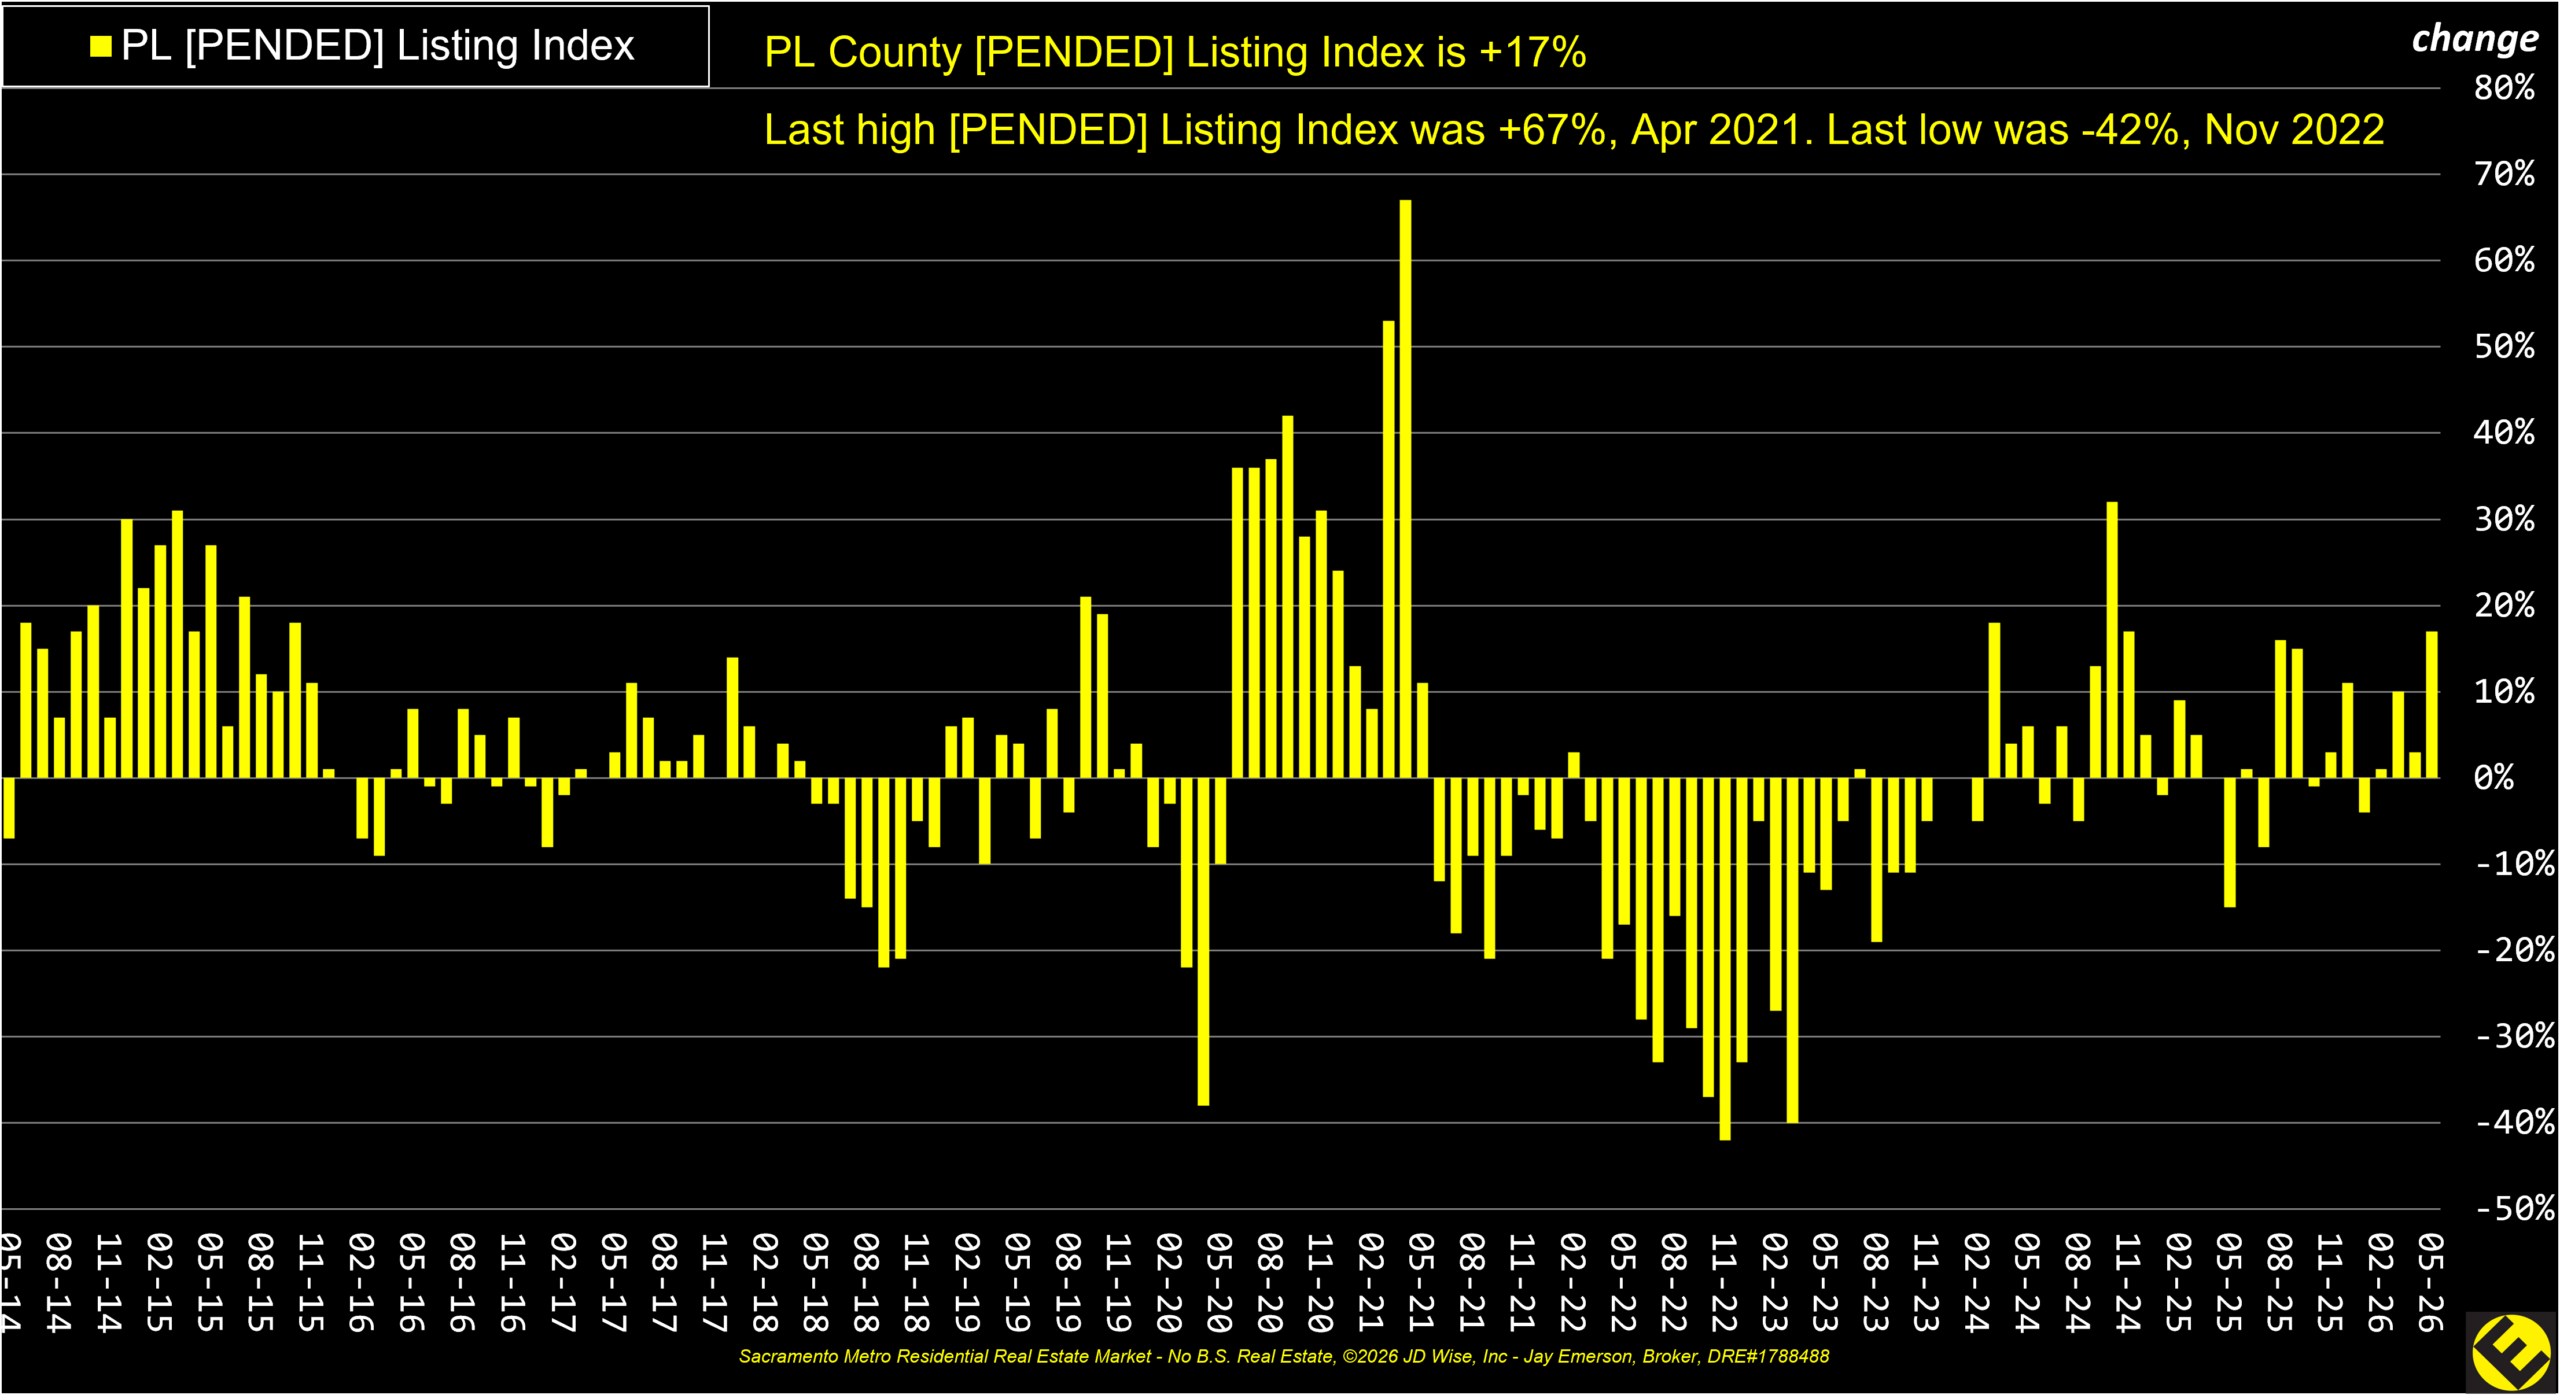
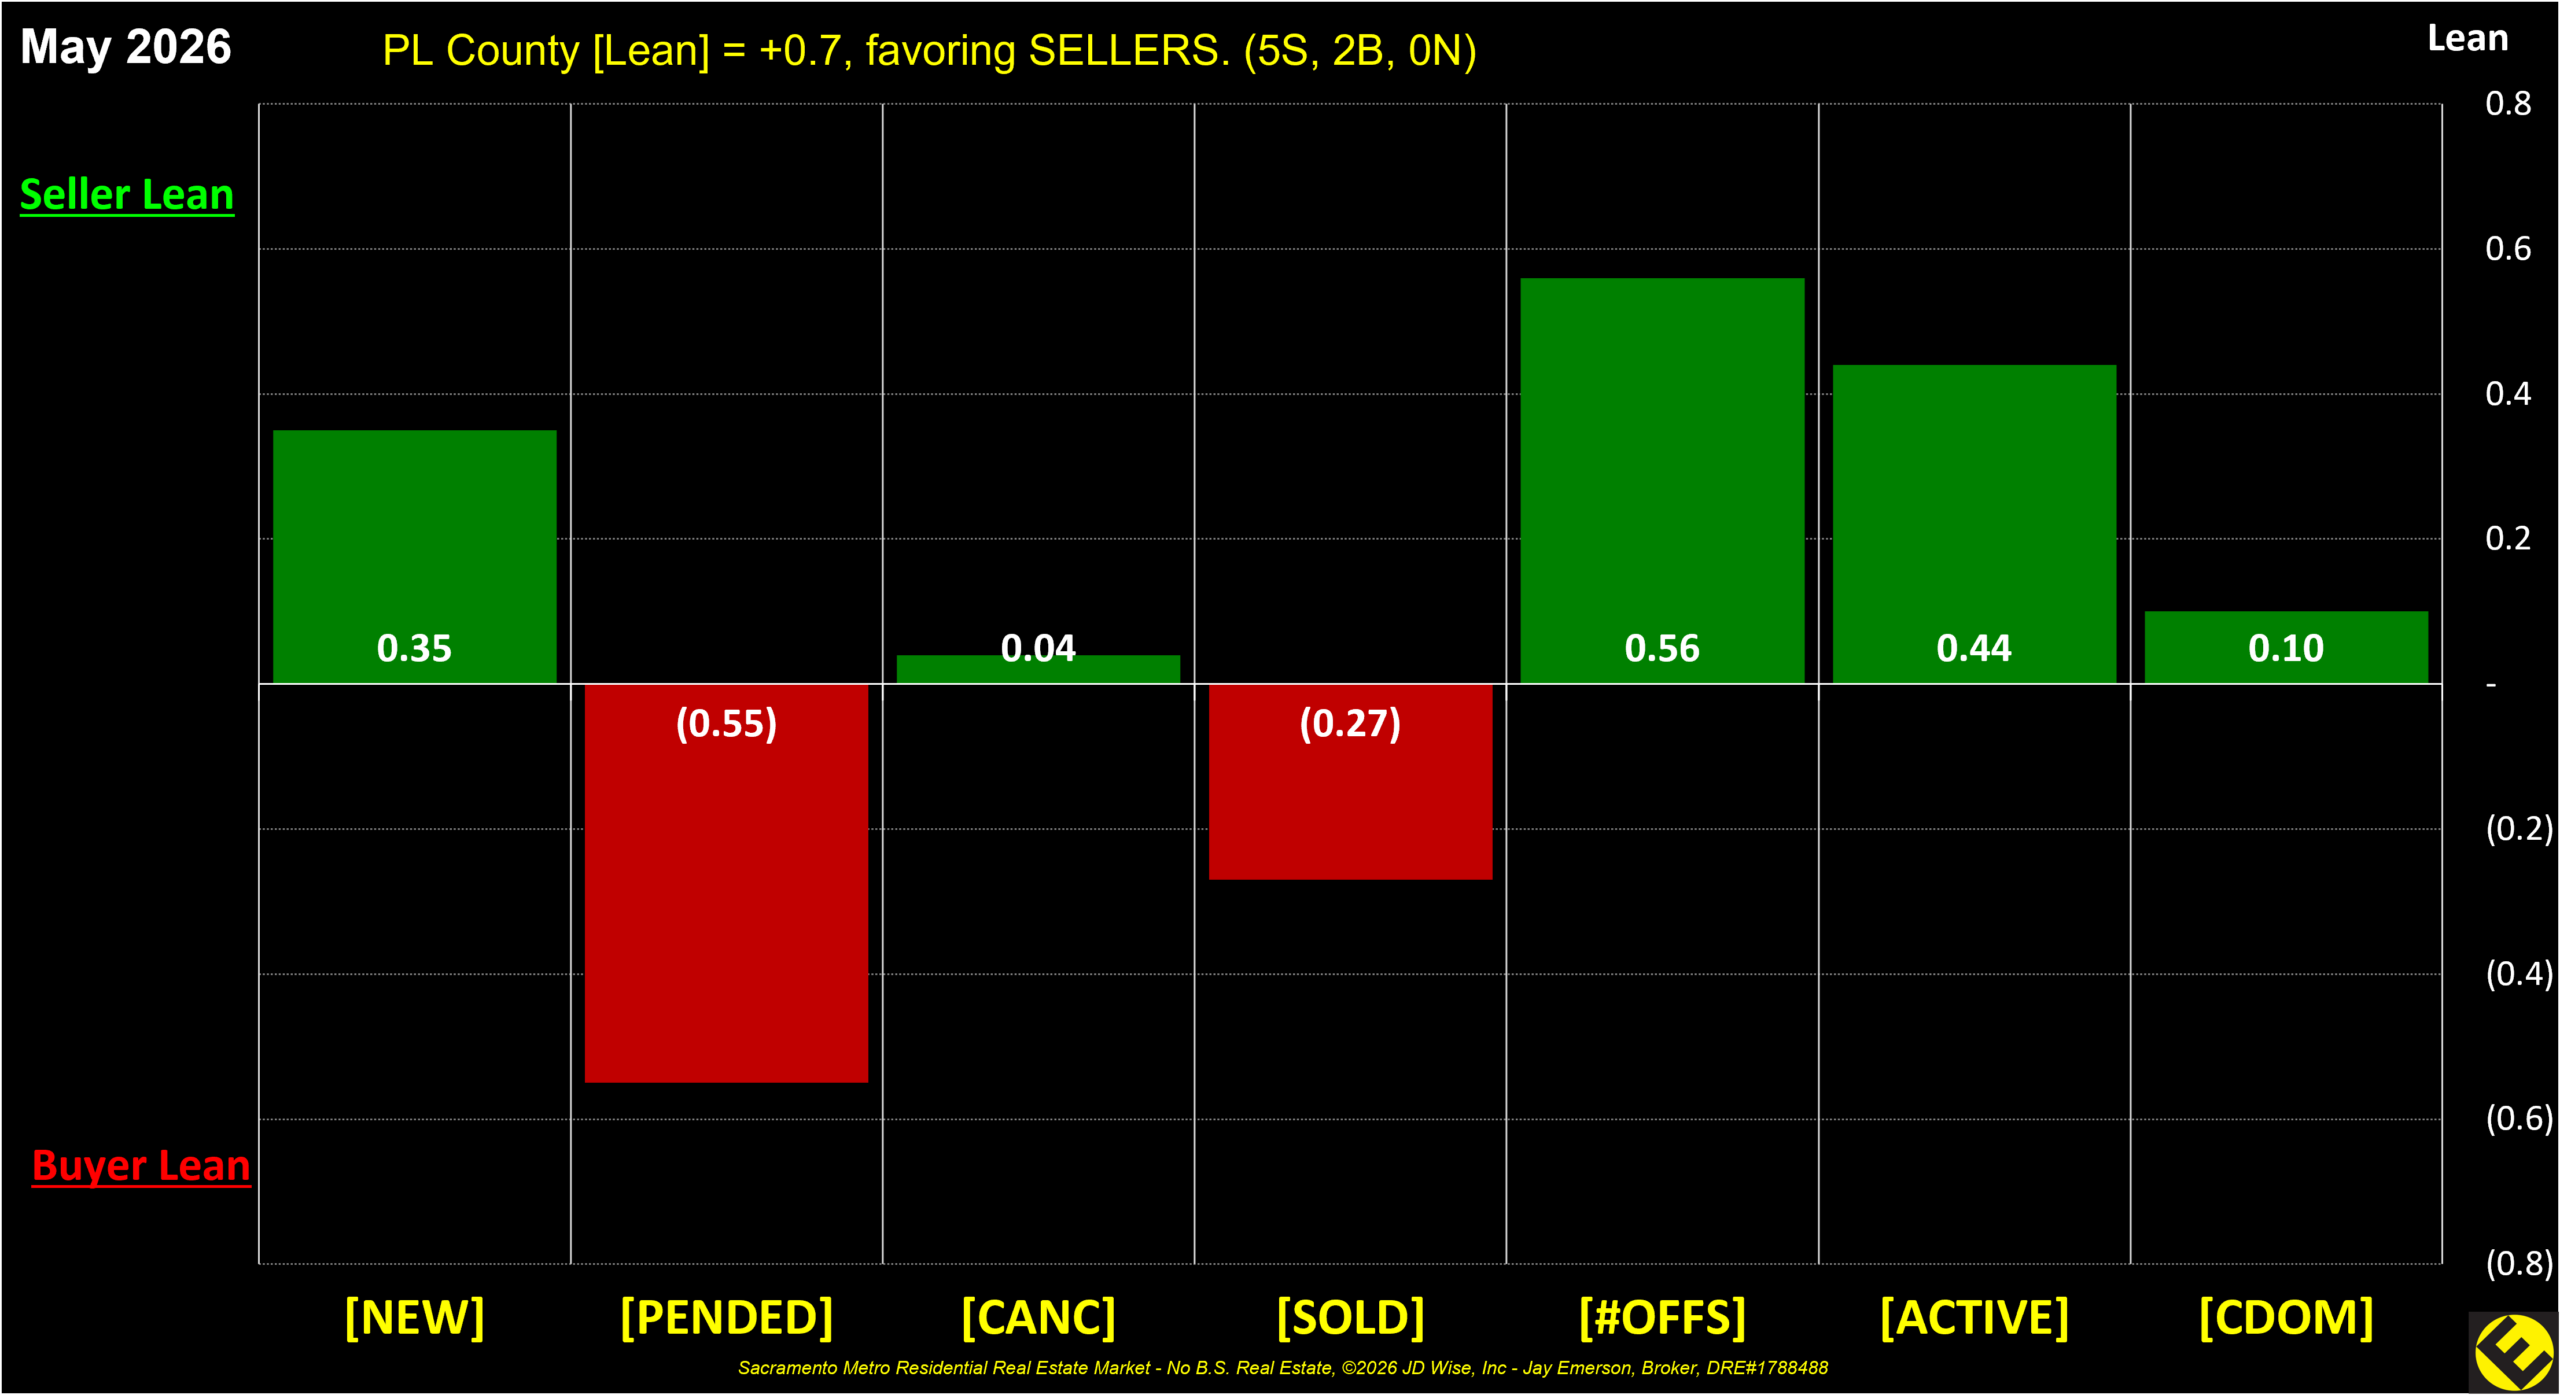
From this “raw data”, my calculations result in the momentum of each Median Price, the ’10 Yr Mmm Average’ for each data item, ‘Supply’ (New+Active), ‘Demand’ (Pend+Sold), ‘Lean Score’ (long and short-term averages indexed for each data item), ‘Consumption’ (Demand/Supply), ‘Appetite’ (Pend/New), and ‘Turnover’ (Sold/Active).

The 3 Sac Metro Counties are tangent to each other and represent different demand and supply levels.
Rumble
County Updates
Sacramento County
Sac County
El Dorado County
Placer County

Using monthly data, activity is calculated to show how supply and demand are interacting.

Sacramento County Market Activity Index (monthly)
Sacramento County Market Activity Index (annual)
El Dorado County Market Activity Index (monthly)
El Dorado County Market Activity Index (annual)
Placer County Market Activity Index (monthly)
Placer County Market Activity Index (annual)

By calculating the deviations between the current data value and its own short- and long-term averages, the LEAN attempts to portray who is favored in the current market.

Sacramento County Lean Score
El Dorado County Lean Score
Placer County Lean Score

The ‘Median’ Price means half of Sold prices were lower and half were higher. The other popular measurement is the ‘Average’ Price. Using the ‘Median’ eliminates the effect of outliers on a meaningful measurement.

The Momentum and the 12-month moving average (12MM), both based on the Median Price, help predict future changes and indicates possible investment actions.

Momentum detects changes in the rate of change from month to month and therefore moves before the Price change is evident. The monthly Price change pulls and pushes on the Moving Average of the Price. For highly variable prices (e.g., Loomis 95650), Momentum and the MA of the Price is more difficult to translate.

The 12 Month Moving Average is a ‘trailing indicator’ of the Price that places a greater weight and significance on the most recent data points. Like all moving averages, this technical indicator is used to produce buy and sell signals based on its relation to the Price changes it is measuring. Traders often use several different EMA lengths, such as 10-day, 50-day, and 200-day moving averages. Investment analysis usually uses data with a 1-day occurrence. Real estate data, although happening daily, is reported monthly. Therefore, these calculations use the frequency of source data – monthly, therefore 12 month MA.
https://www.investopedia.com/terms/e/ema.asp

Showing the Median Price and its Momentum (Þ) together makes it easier to explain how crossing the X axis “warns” the investor that the momentum is triggering a possible action. Because Momentum is not perfect, there is a time lag and, therefore, lost opportunity to either gain more or lose less from the actual peak/trough to the crossing of the X axis.

Commodity brokers put a heavy reliance on momentum for the underlying price change of the commodity they’re trading. It’s a year-over-year calculation depicting the direction and force of the price change.  Maximizing your profits as a home seller requires the exclusive use of TIME to trigger your selling decision. Combining the Median Price momenta from each County and the Average Median Price momentum (zip codes comprise Averages), aggregate market changes are more apparent.

https://www.investopedia.com/trading/introduction-to-momentum-trading/

Sacramento County Median Price
El Dorado County Median Price
Placer County Median Price

The real estate market was created to exchange “products”: money and houses. When a house is made available to prospective buyers, there is a response to that “Product”. That response can be shown by the current and historic data and the trends and shapes of those lines. An ACTIVE listing is briefly also NEW. When a seller and buyer enter escrow, the “Product” becomes PENDING. If that buyer and seller execute the contract, the “Product” becomes SOLD. If the seller actively removes their listing, it is CANCELED. If the listing period comes to an end, it is EXPIRED.

The life of all “Products” (MLS only) can be seen in these charts and blurbs.

The data for New and Pending listings render this calculation called “appetite” for new residential listings for the month.

The data for Active and Sold listings render this calculation called “turnover” of residential listings for the month.

Sacramento County Inventory Summary
El Dorado County Inventory Summary
Placer County Inventory Summary

Cumulative Days on Market (CDOM) represents the number of days a listing spends ACTIVE until SOLD. The number of days PENDING are excluded from the CDOM number.

Sacramento County Cumulative Days on Market
El Dorado County Cumulative Days on Market
Placer County Cumulative Days on Market

Based on the current mortgage rate, the Median Price and the median family income, this indicates the affordability of a home.

Sacramento County Housing Affordability Index
El Dorado County Housing Affordability Index
Placer County Housing Affordability Index
  • Market Menu
  • Counties
  • Zip Menu