Real Estate Market Overview
-
Market Menu
-
Overview
-
MajorMajor
-
CountiesCounties
-
AveragesAverages
-
MomentumMomentum
-
BoundariesBoundaries
-
Zip Menu
-
Fair OaksFair Oaks
-
OrangevaleOrangevale
-
RosevilleRoseville
-
College GreensCollege Greens
-
Pocket
Market Summaries
Introduction
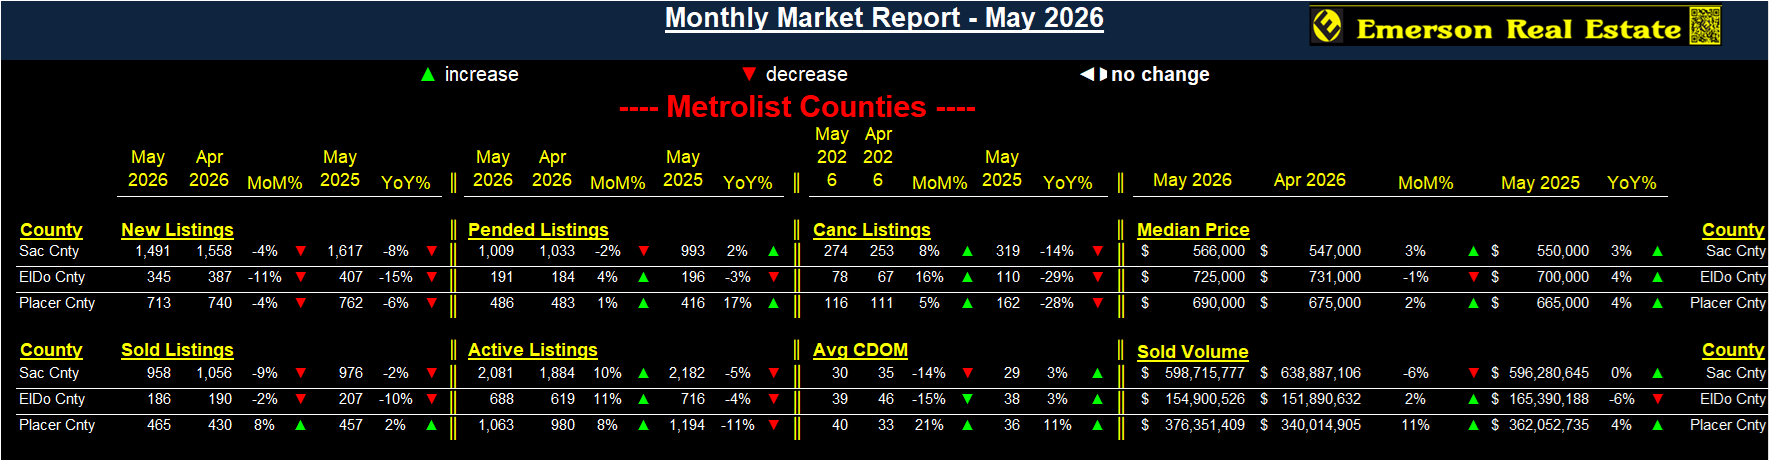
My “No B.S.” system gathers, measures and publishes data, trends, observations and opinions (mine) of results in 52 zip codes and 3 counties in the Sacramento Metropolitan region.
Collection, analysis and reporting on the market data is an attempt to understand where we are going, where we were and what is happening. Markets get disrupted mostly by events, seasons, psychology, and chance. The data I collect is for 3 Counties and 52 Zip Codes in those Counties and Yolo.

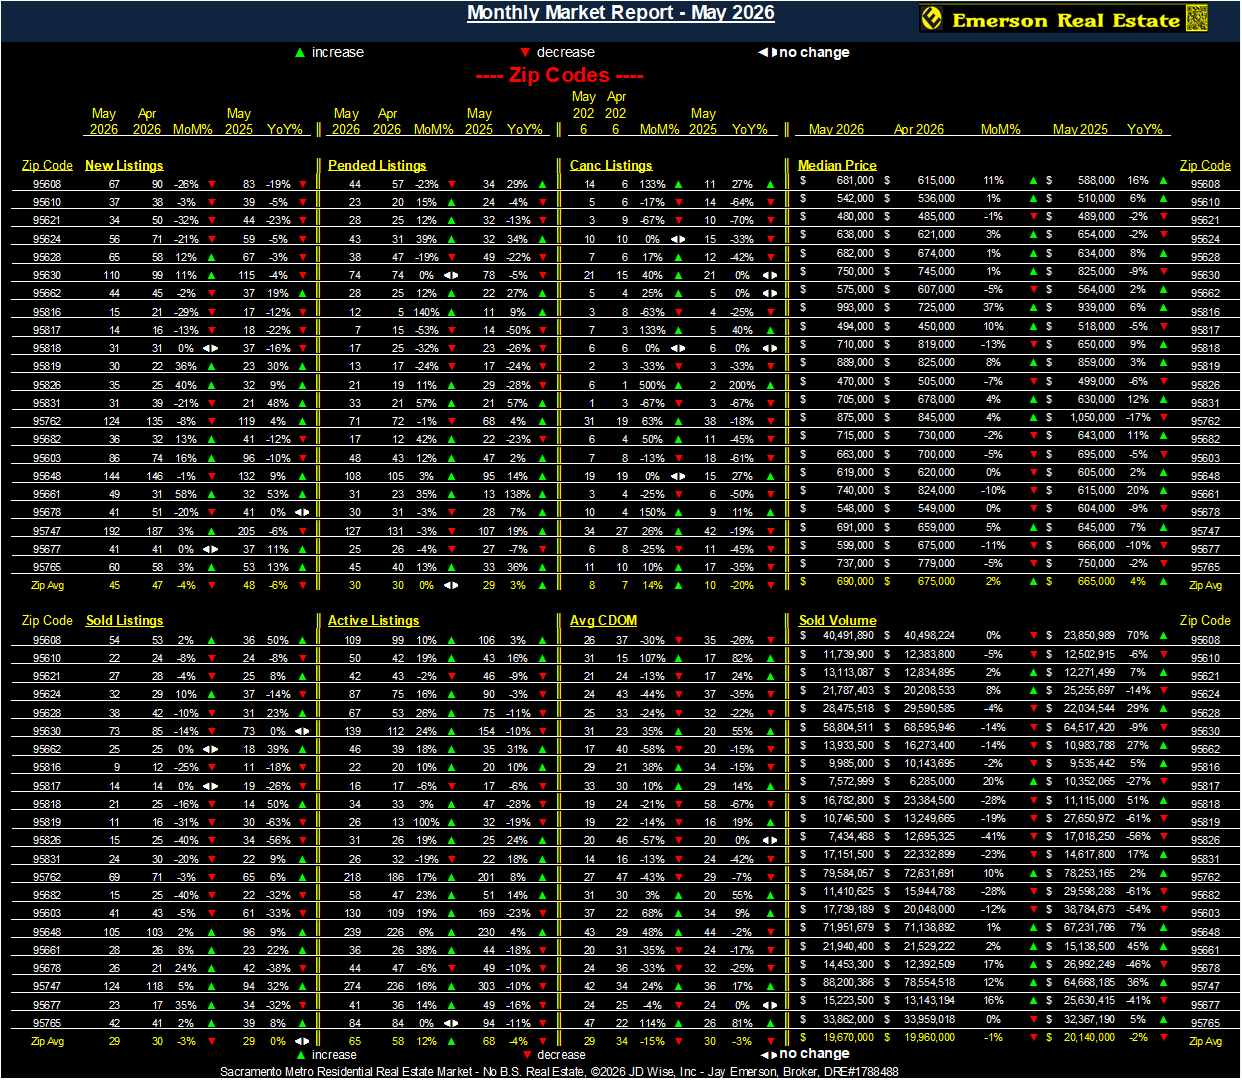
Our market for resale, residential real estate is explained in the pages represented in the Market Menu (above). This analysis incorporates most market data to help understand and explain the Sacramento metropolitan market trends. Data is from Sacramento, El Dorado, and Placer Counties. Within this area are many sub-markets which are affected by market forces in similar ways but result in different prices, supply levels, and housing demand. The Zip Menu (above) dives deeper into selected zip codes.
Where most forces are predecessors TO market behavior (notwithstanding recursive effects), the trends are based on results FROM that behavior. The analysis is documented so client decisions are supported.
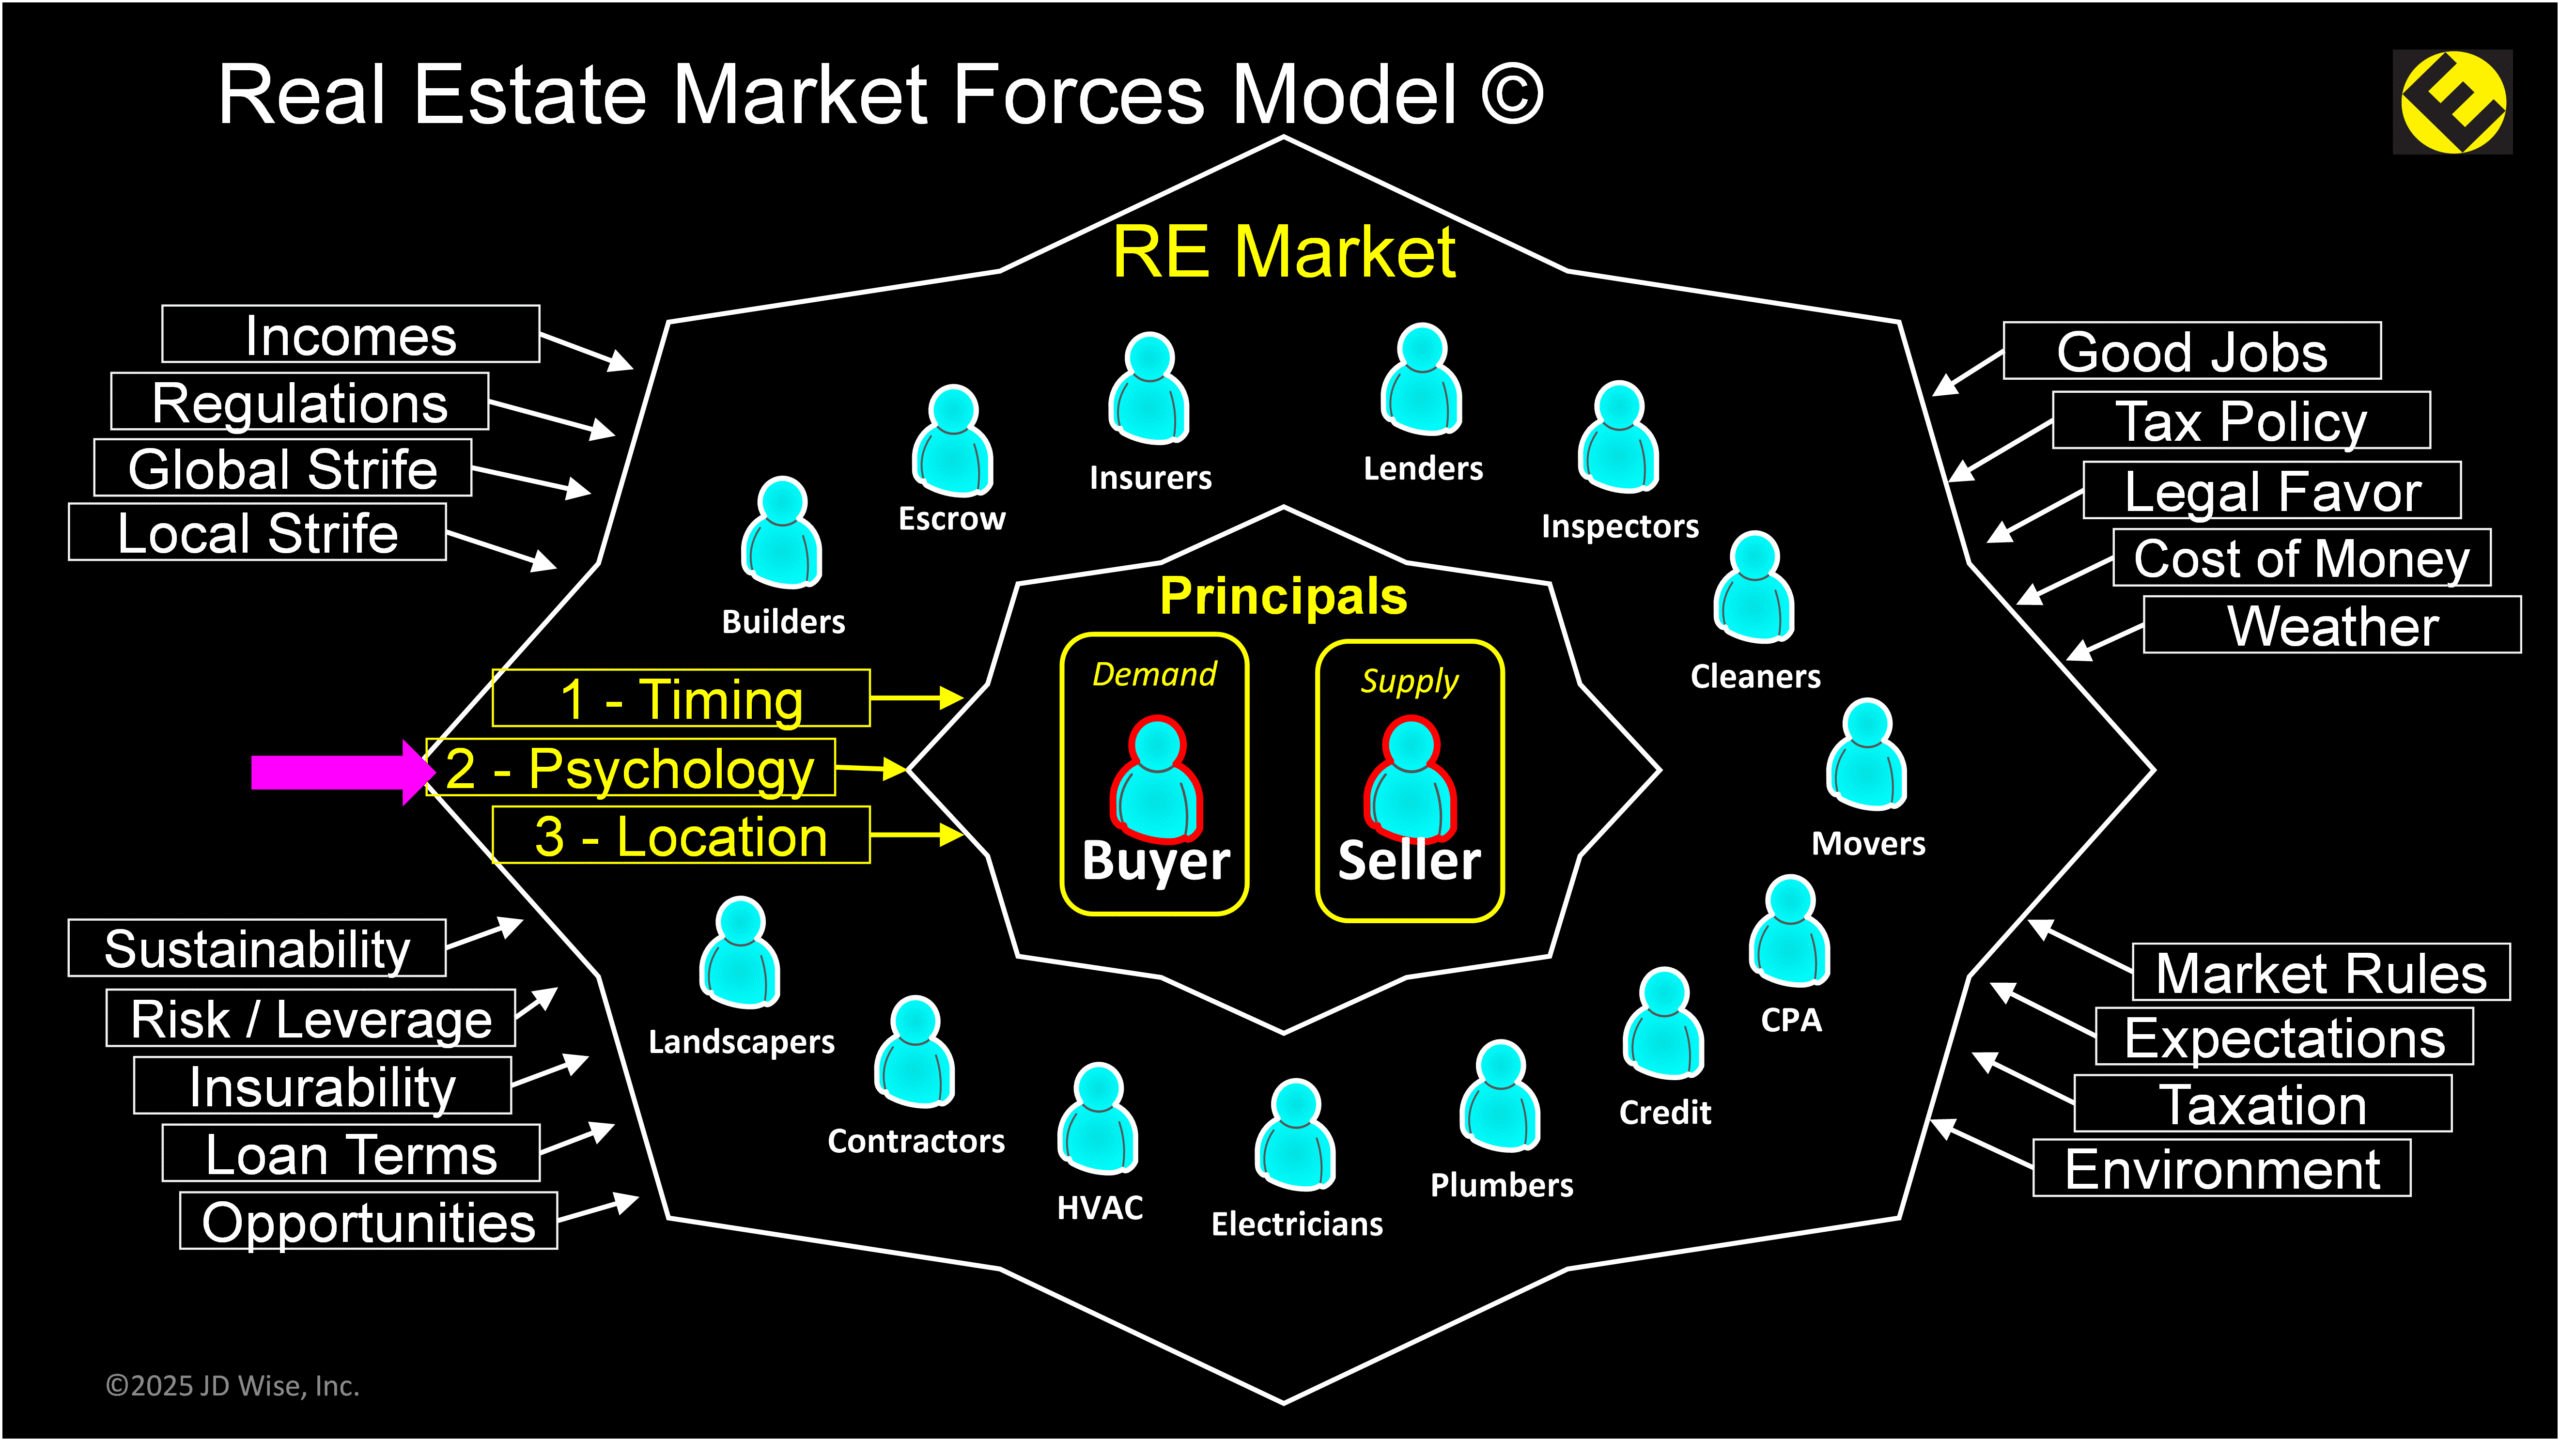
Market Forces
There are many elements (“forces“) that drive the supply (attempt to sell) and the demand (attempt to buy) homes. When a home is newly constructed, there are additional forces. Common to either type of single-family residence (SFR), mortgage rates, buyer and seller confidence, new home permits, and employment exert extreme forces on the supply and demand for homes. The forces affecting supply and demand are rarely tangible. Loan rates and supply are tangible. Psychology and the consequences of bad policy are not.
The Most Important 3 Words in Real Estate
1. Timing
Is the timing right for the buyer to buy and the seller to sell? Without this being true, we have no market.
2. Psychology
The human element is hard to forecast. ‘Meeting of the minds’ is critical to executing a contract. Fear and greed occur here.
3. Location
A property’s proximity to water, food, and amenities will always be important.
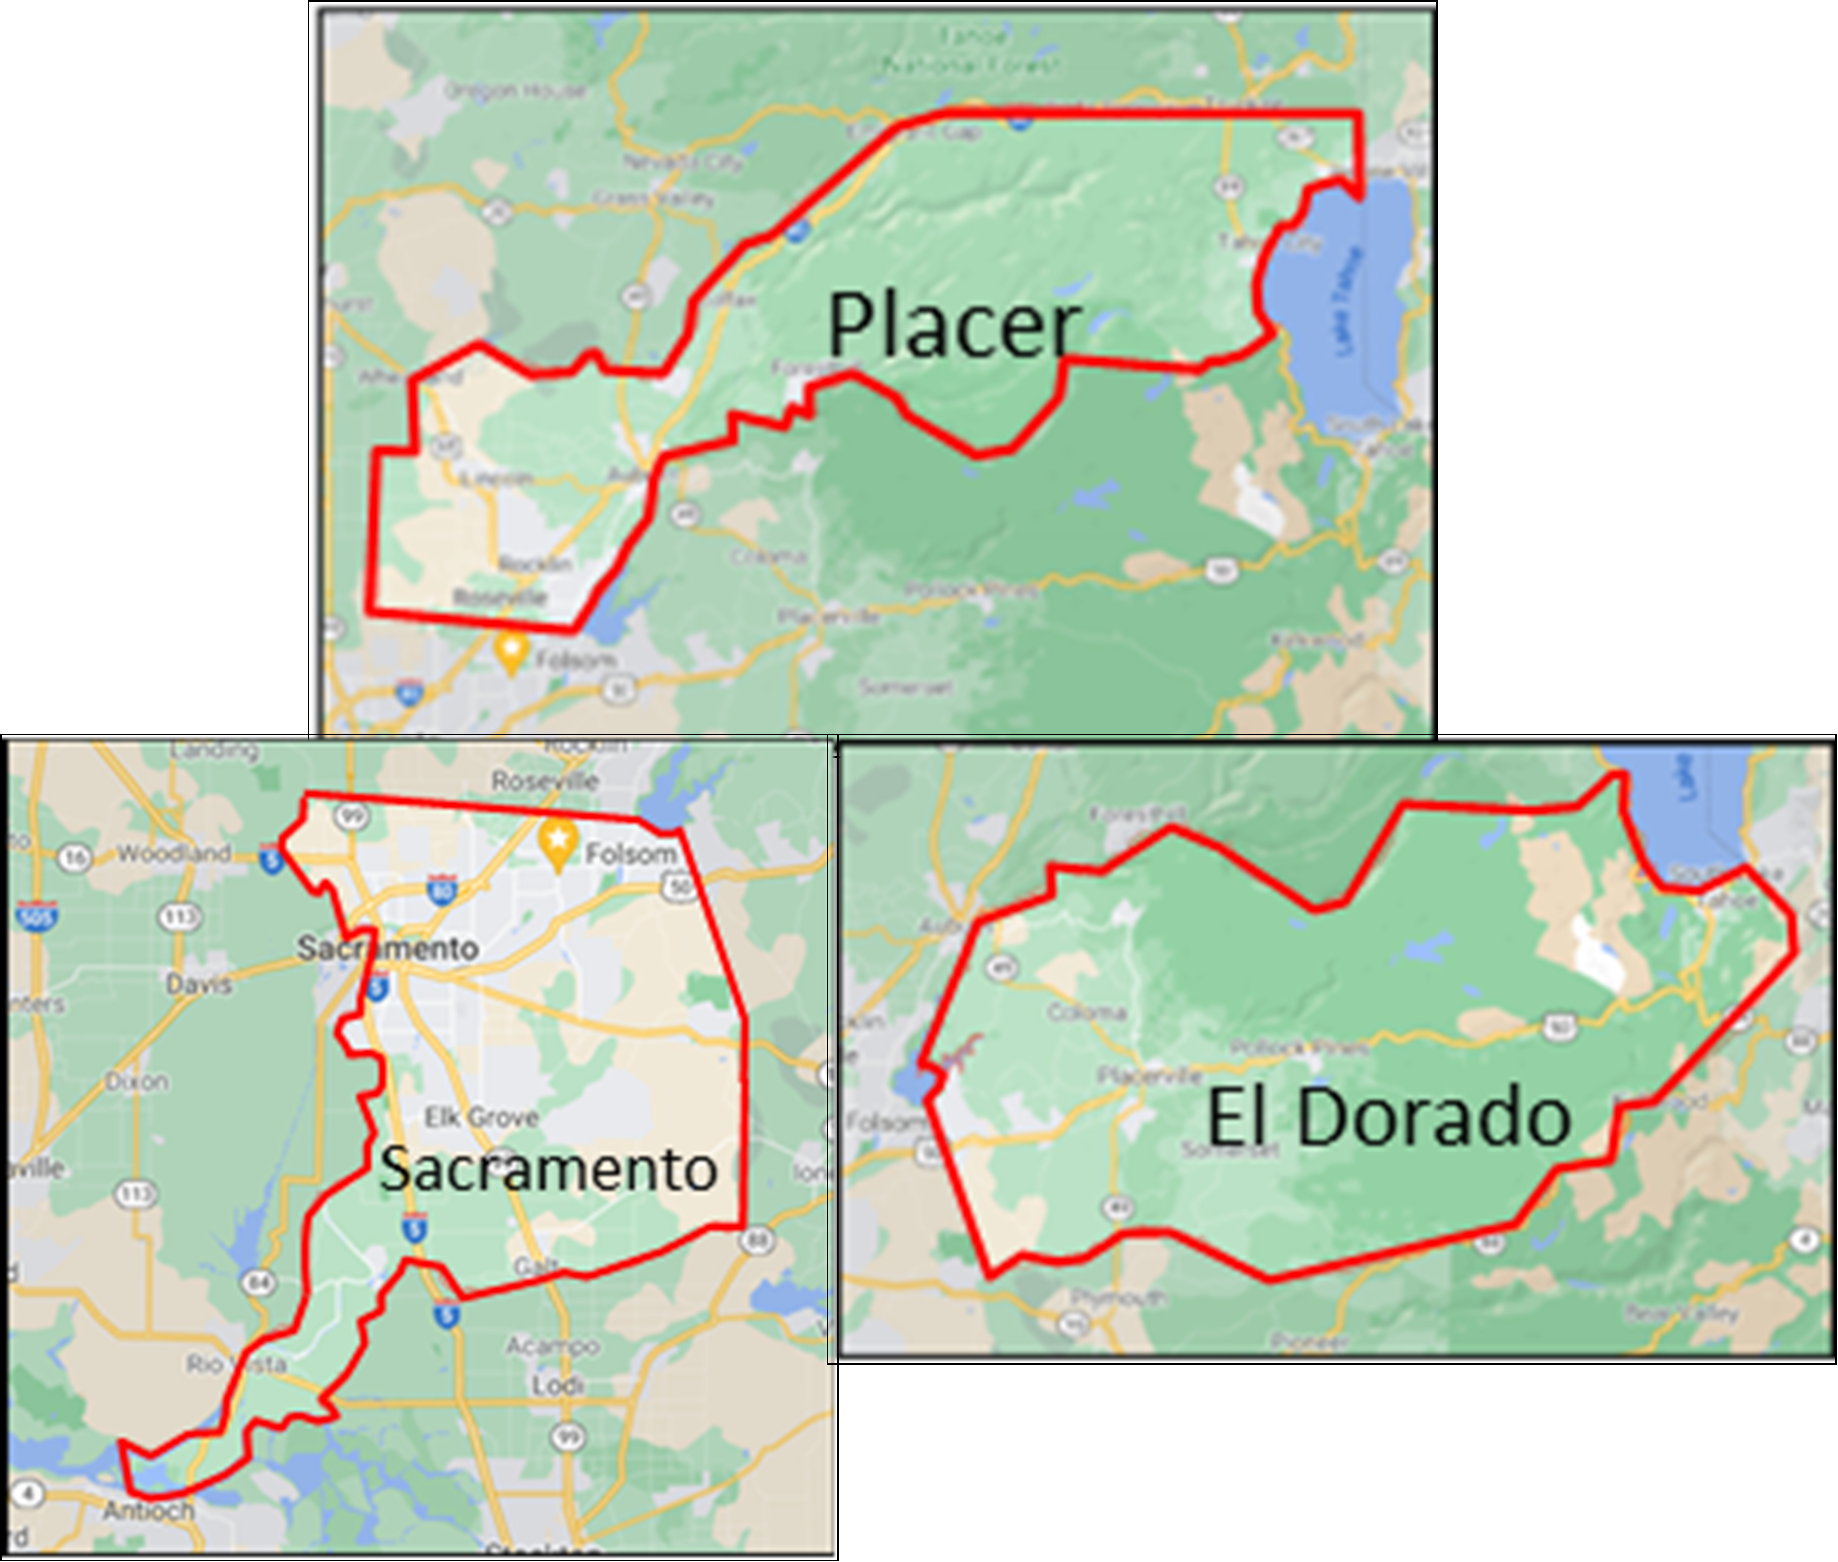
Geography
Under all is the dirt. The Sacramento Metropolitan real estate market covers a lot of dirt. The Metrolist (MLS) system I use to expose and search includes many different parts of California.

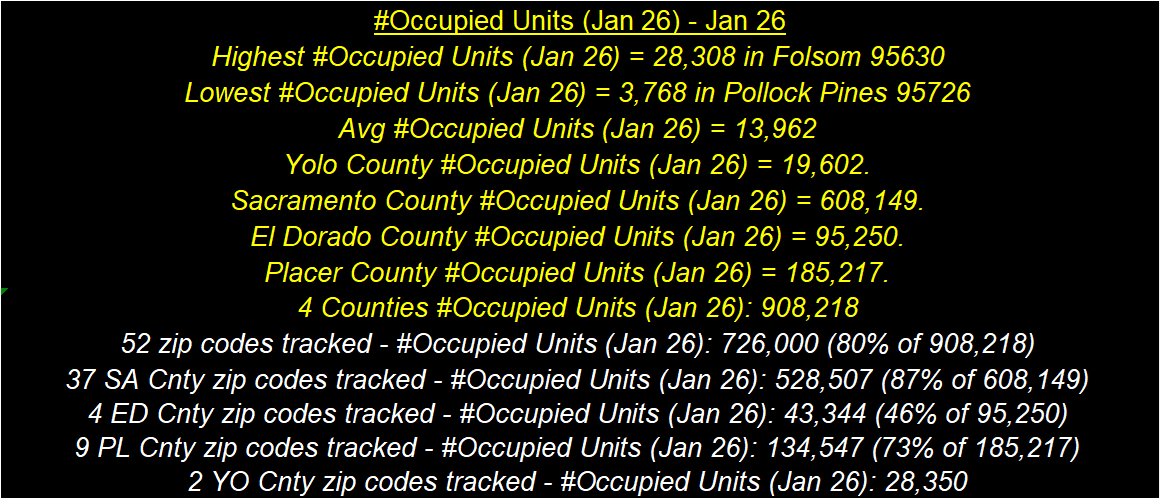
These are the Counties and zip codes tracked: El Dorado County, Placerville 95667, Cameron Pk 95682, Pollock Pines 95726, El Dorado Hills 95762, Placer County, Auburn 95603, Lincoln 95648, Loomis 95650, Composite Averages, Roseville 95661, 95678, 95747, Rocklin 95677, 95765, Granite Bay 95746, Sacramento County, Carmichael 95608, Citrus Heights 95610, 95621, Elk Grove 95624, 95757, 95758, Fair Oaks 95628, Folsom 95630, North Highlnds 95660, Orangevale 95662, Rancho Cordova 95670, 95742, Rio Linda 95673, Arden 95815, 95821, 95825, 95864, Downtown 95816, Oak Park 95817, Land Park 95818, East Sacramento 95819, Elder Creek 95820, Greenhaven 95822, Franklin 95823, Fruitridge 95824, College Greens 95826, Rosemont 95827, Florin 95828, Vineyard 95829, Pocket 95831, Natomas 95833, 95834, 95835, Del Paso Heights 95838, North Sacramento 95841, Foothill Farms 95842, Antelope 95843, West Sac 95605, 95691


Data
These are the data elements gathered from systems of record: [MEDIAN], [NEW], [ACTIVE], [PENDED], [SOLD], [CANC], [#Offers], [CDOM], Mortgage Rate, Sentiment, Confidence, Permits, Employment, Construction Spending, New Home Sales, Non-Farm Payroll, Median Income, Population, Housing Units, Land Area
These are derived from the gathered data: [MEDIAN Þ], 26 Yr [MEDIAN] High, [MEDIAN 12MMA], [MEDIAN] variability (σ), [NEW] [ACTIVE] [PENDED] [CANC} [SOLD] Listings % of its [12 yr MMM Avg], [NEW] [ACTIVE] [PENDED] [CANC} [SOLD] Listings Index, [#Offers] % of its [12 yr MMM Avg], [#Offers] Index, Appetite, Absorption Rate, Dollar Volume, Months of Inventory, Housing Affordability Index, Market Activity Index, Sweat Index, Supply Index, Demand Index, Þ Swing Indicator, Price Divergence, % off MEDIAN High
-
Market Menu
-
Overview
-
MajorMajor
-
CountiesCounties
-
AveragesAverages
-
MomentumMomentum
-
BoundariesBoundaries
-
Zip Menu
-
Fair OaksFair Oaks
-
OrangevaleOrangevale
-
RosevilleRoseville
-
College GreensCollege Greens
-
Pocket