There are 52 zip codes tracked in my system. Not all of them are charted and posted.
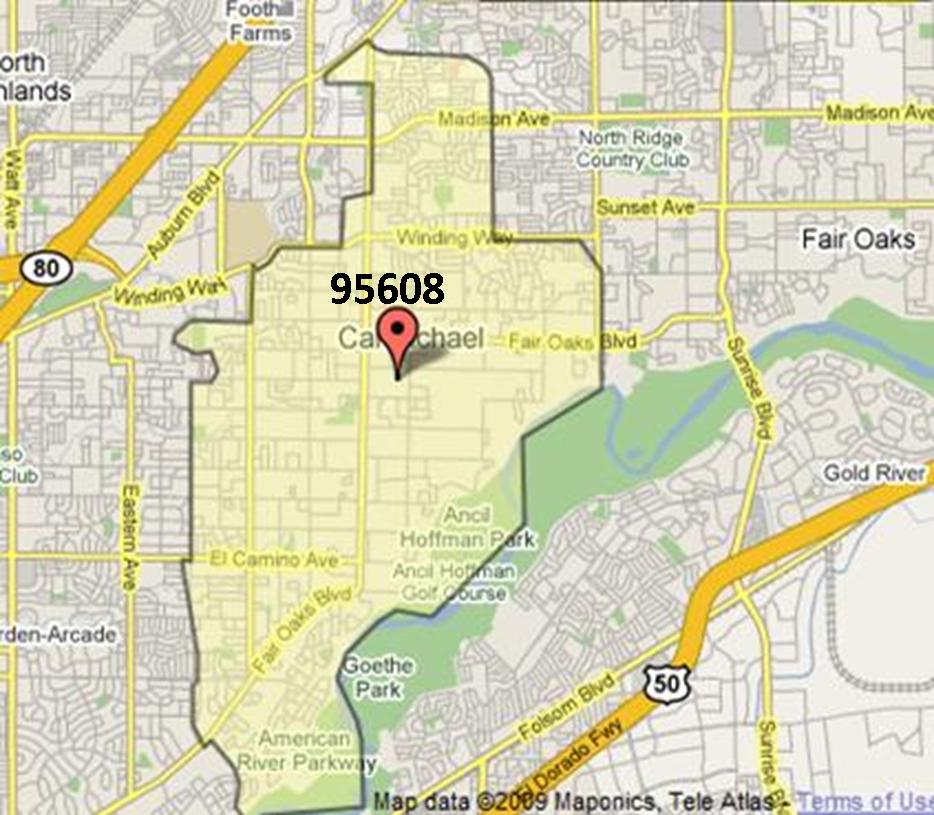
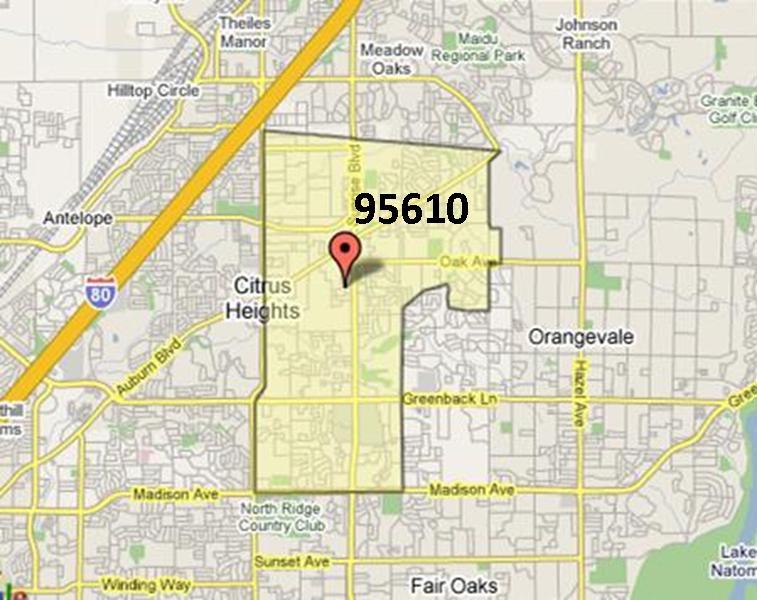
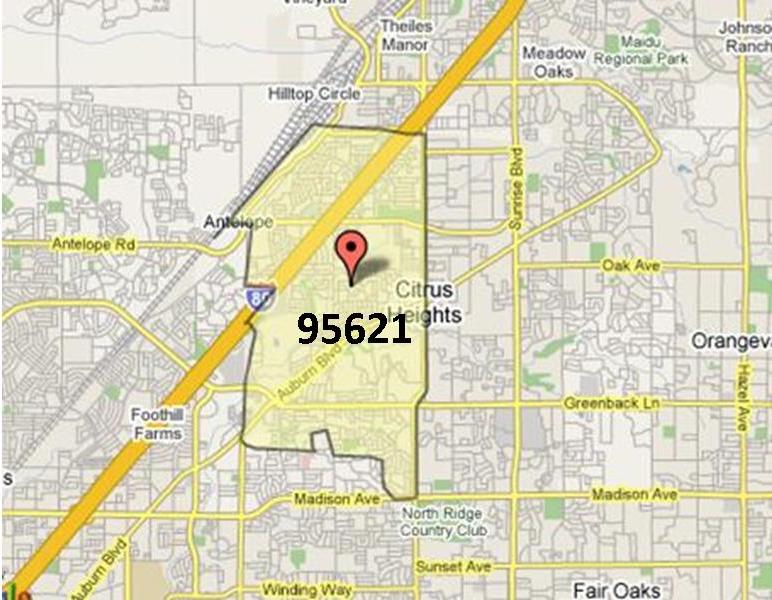
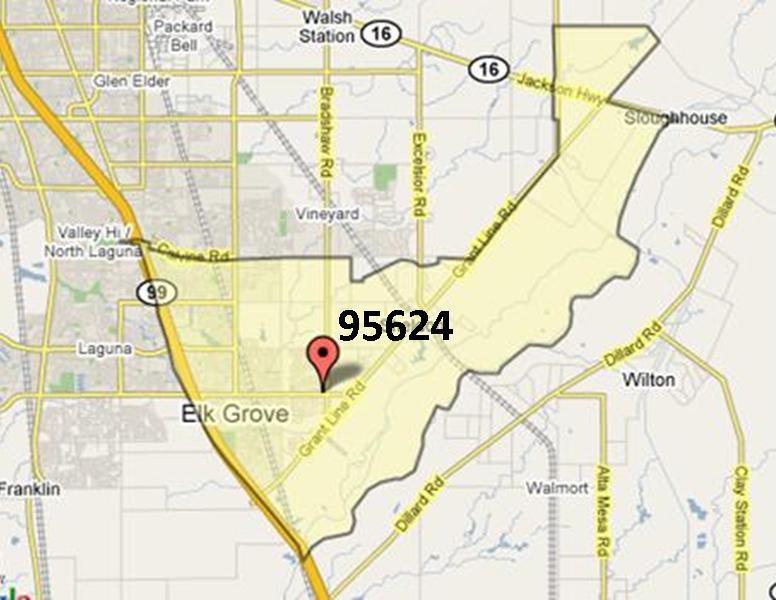
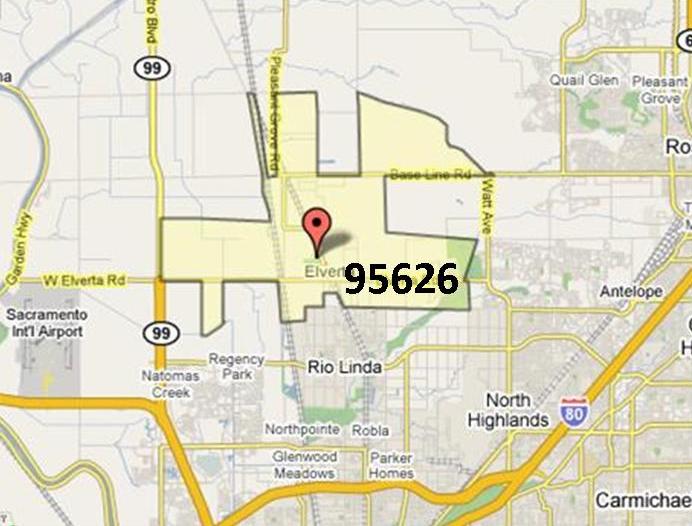
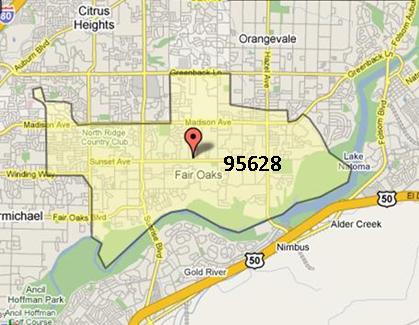
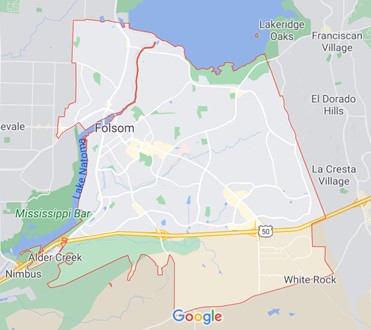
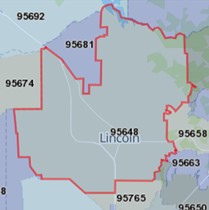
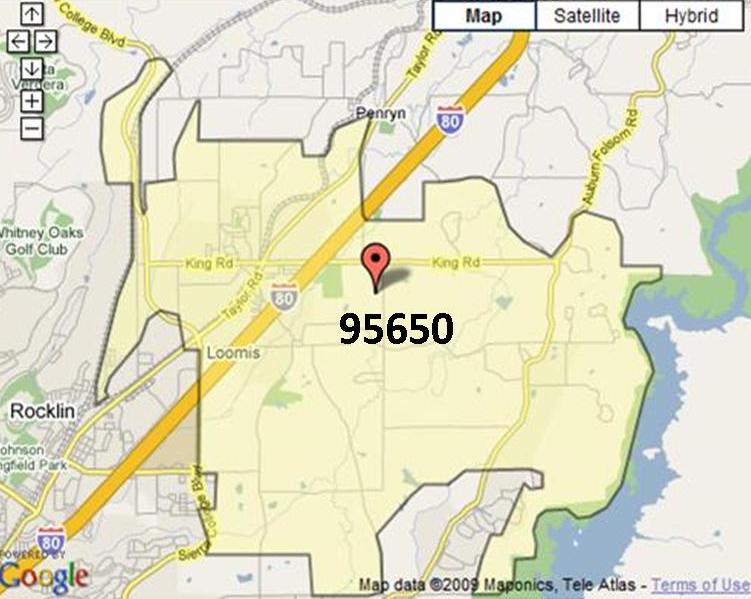
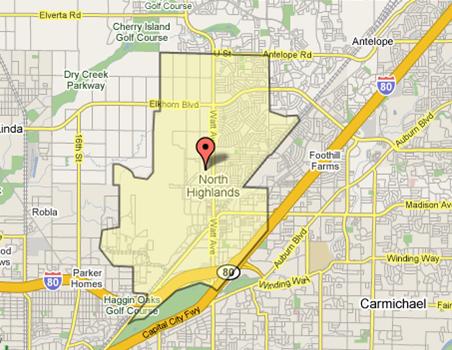
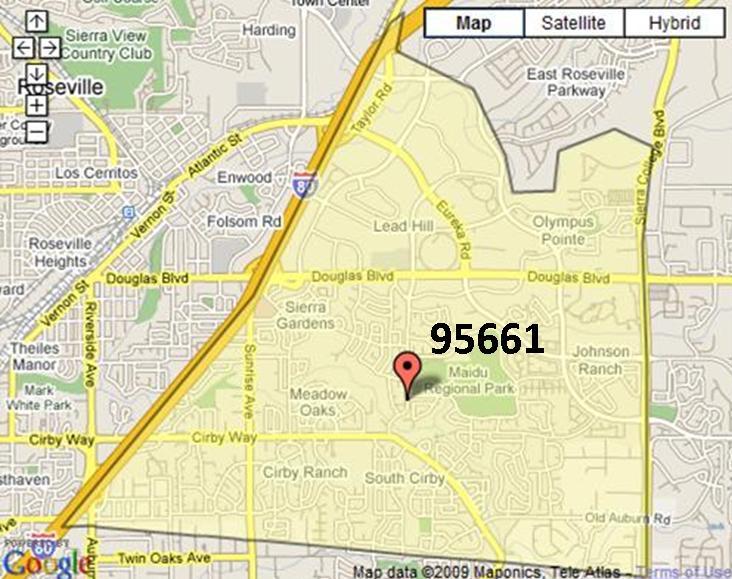
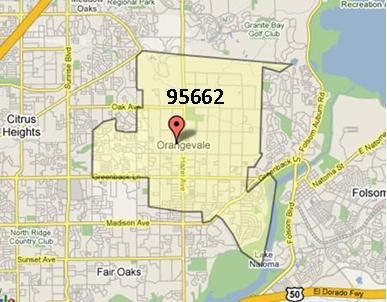
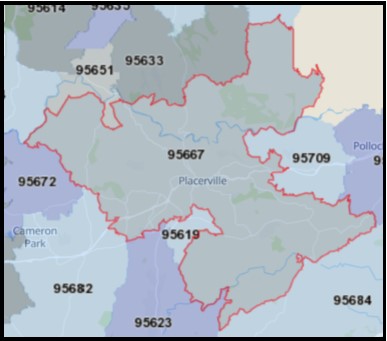
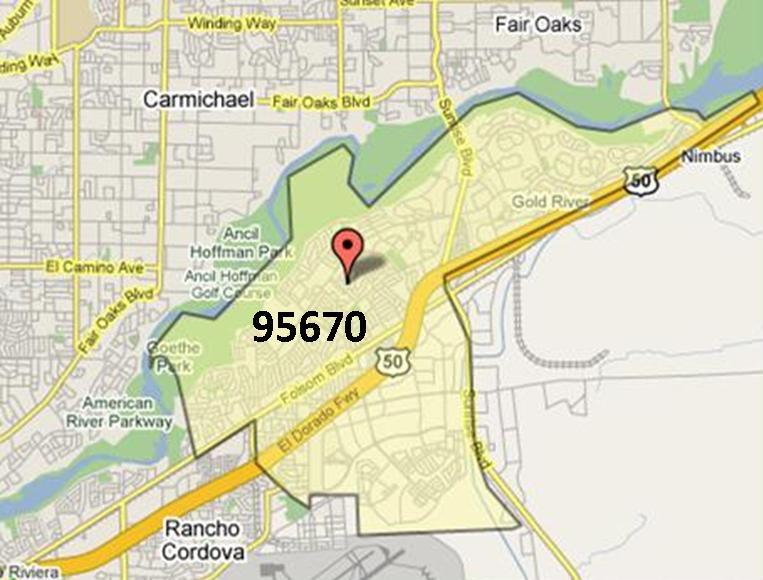
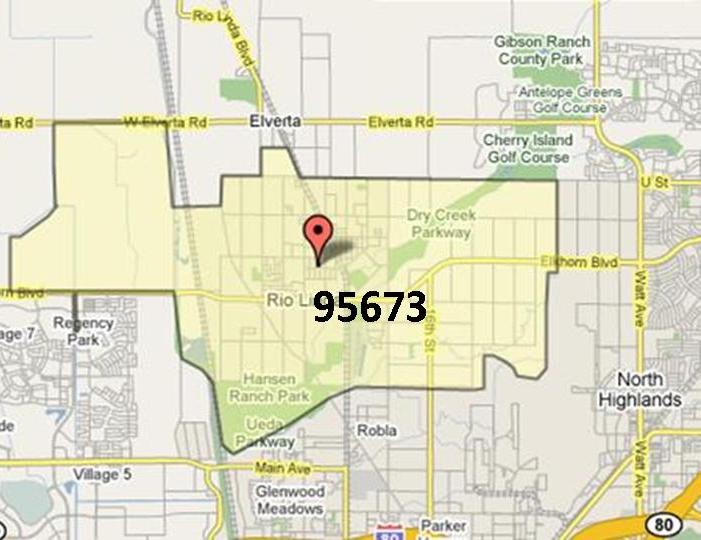
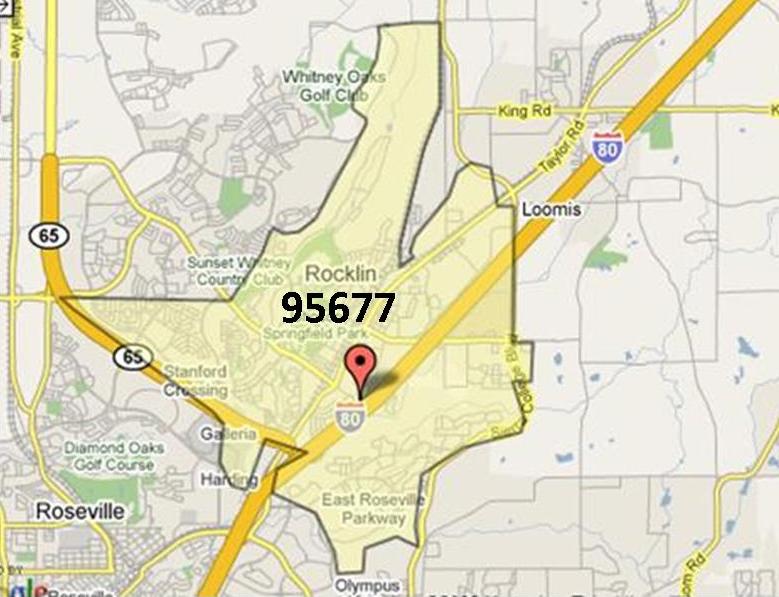
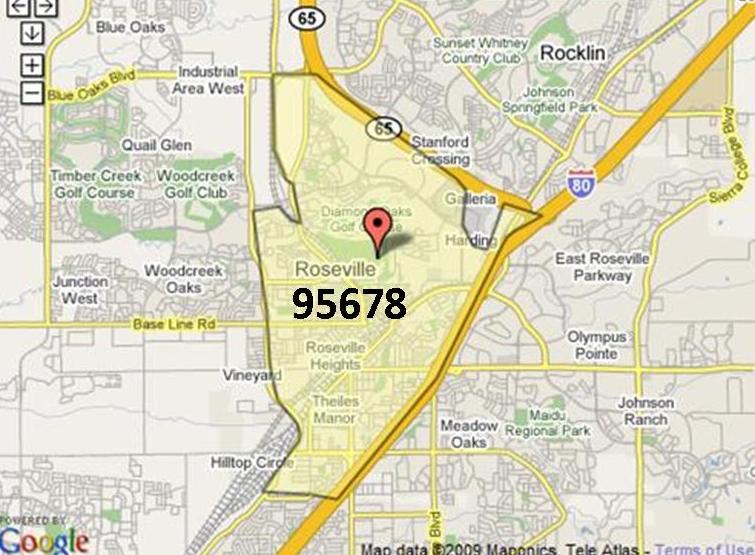
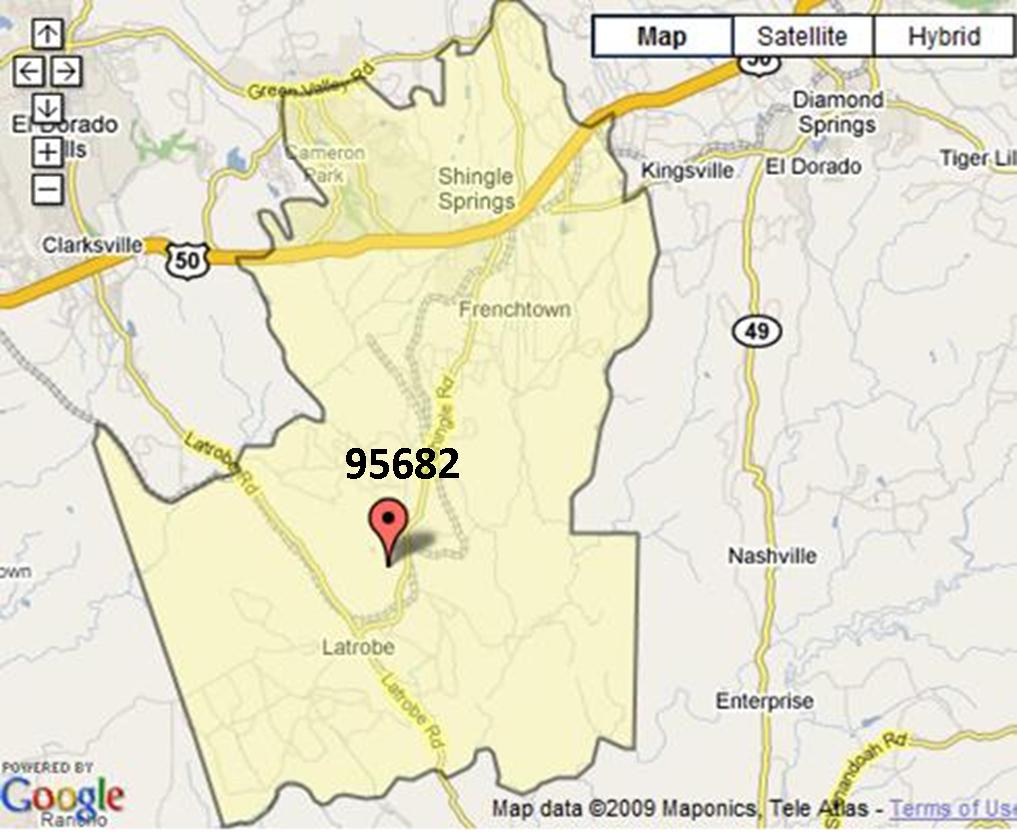
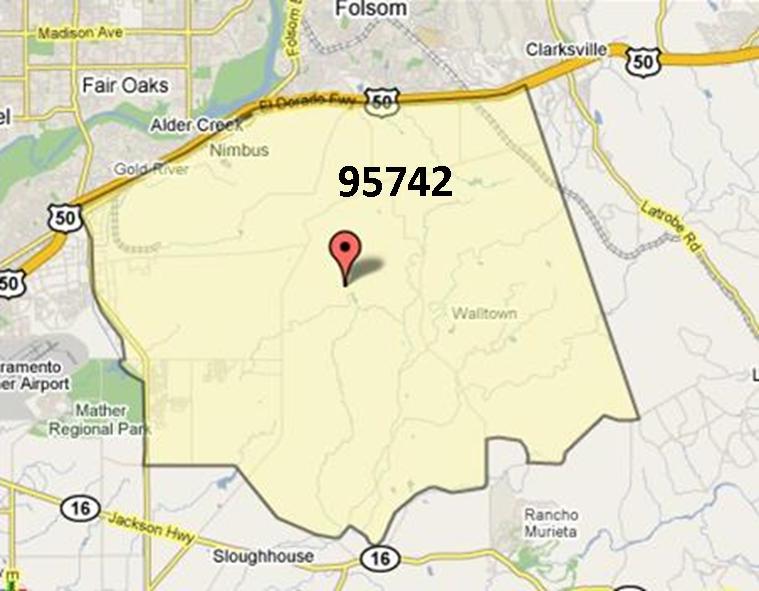
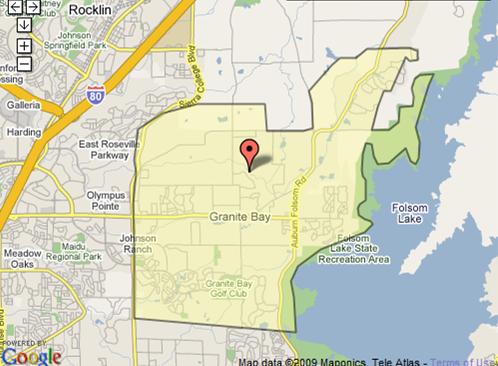
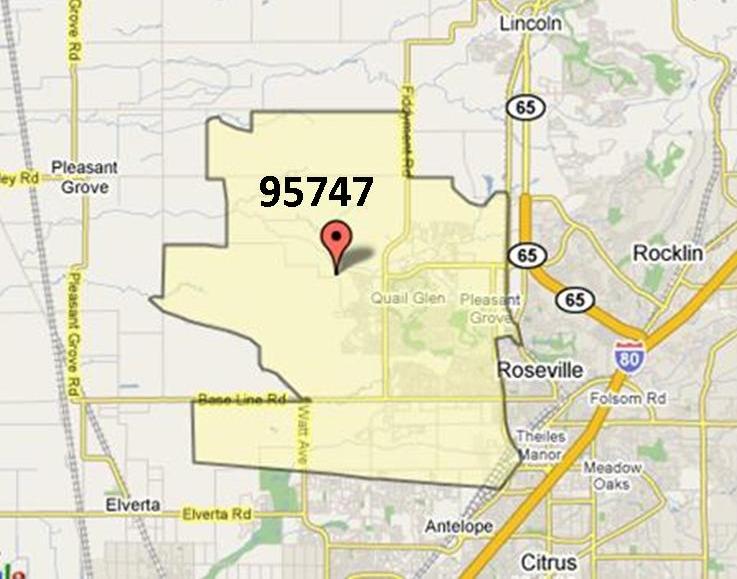
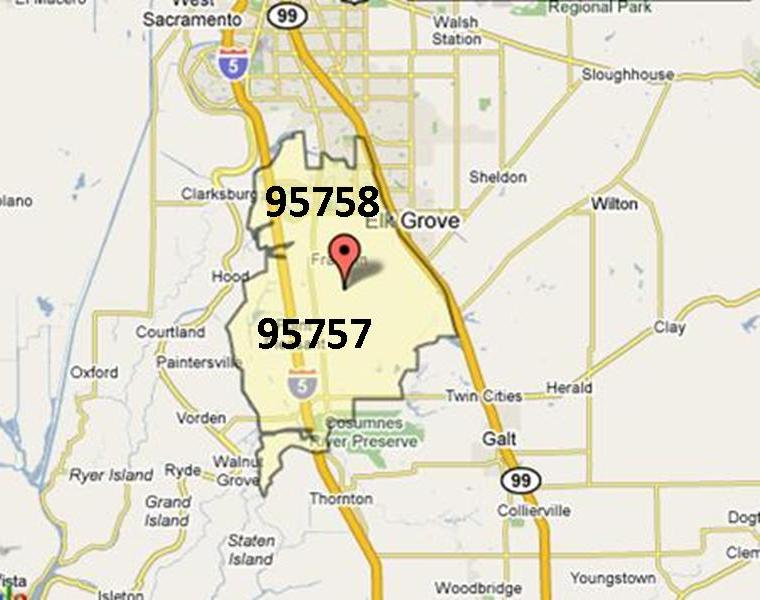
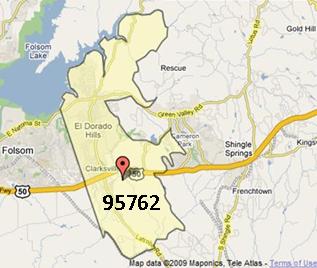
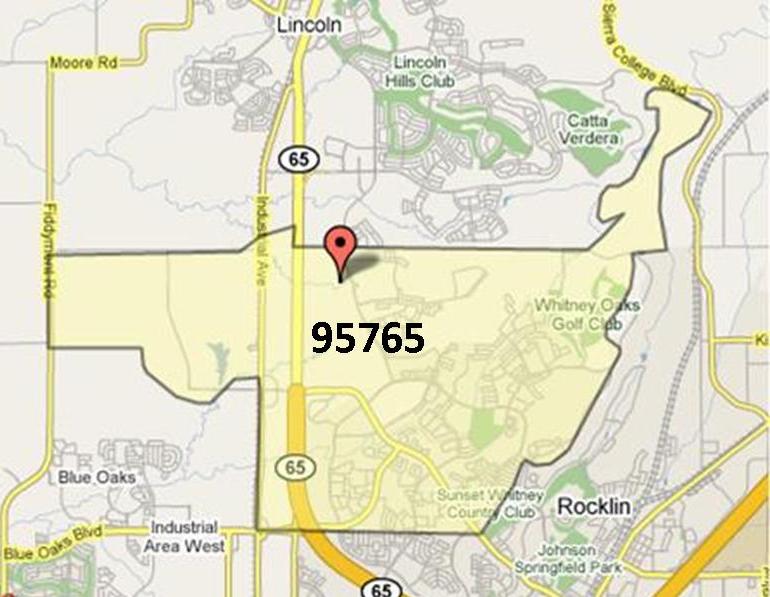
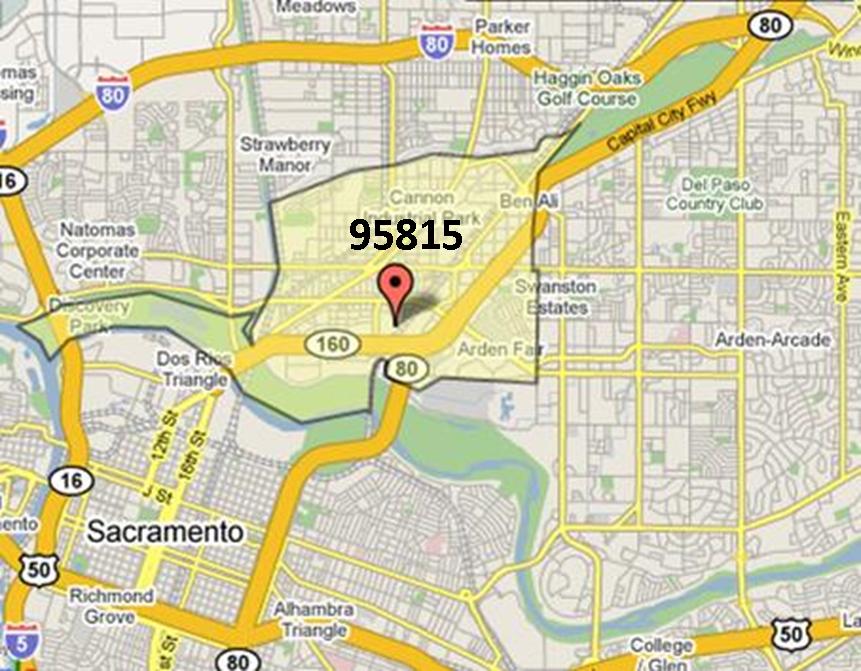
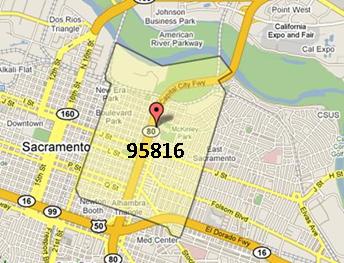
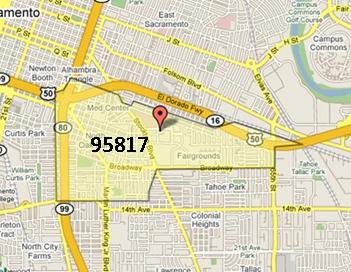
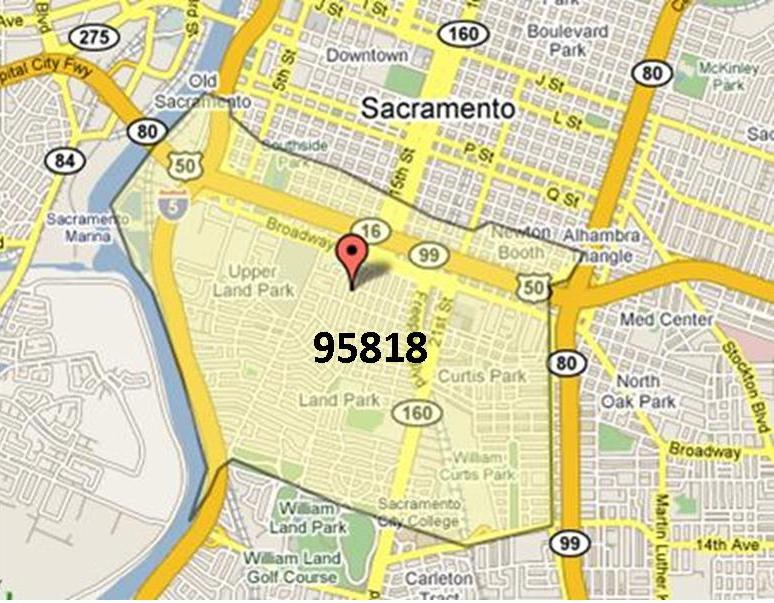
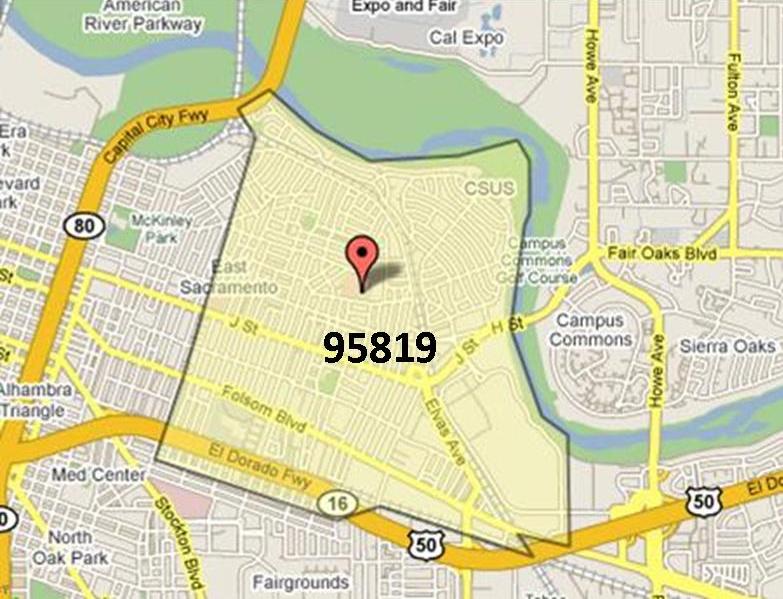
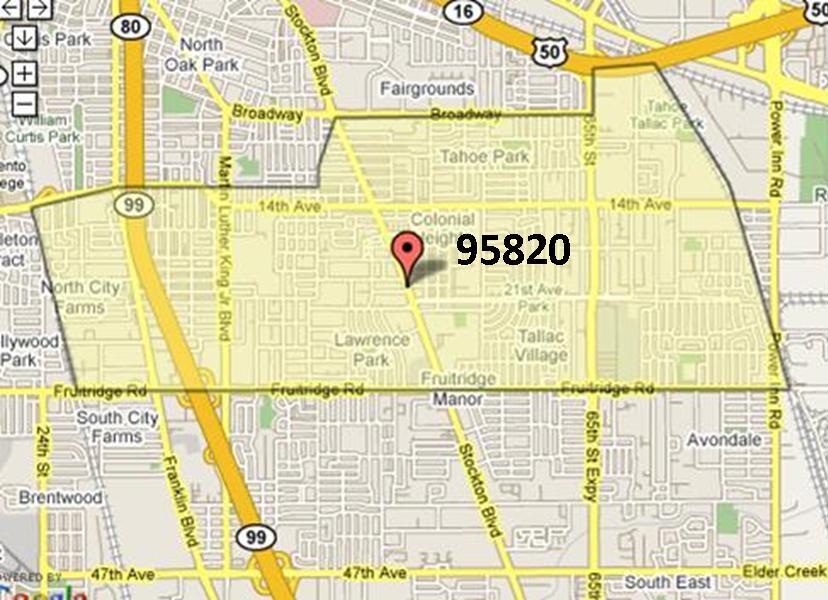
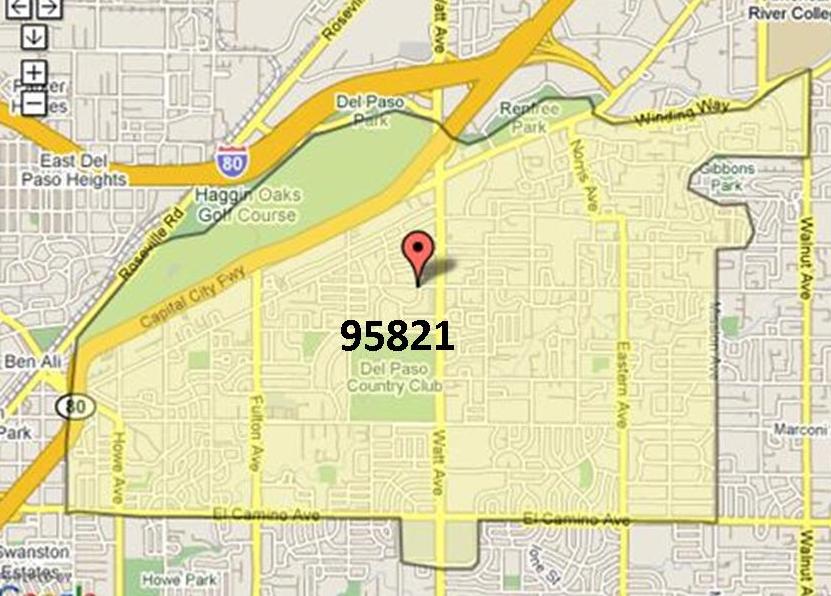
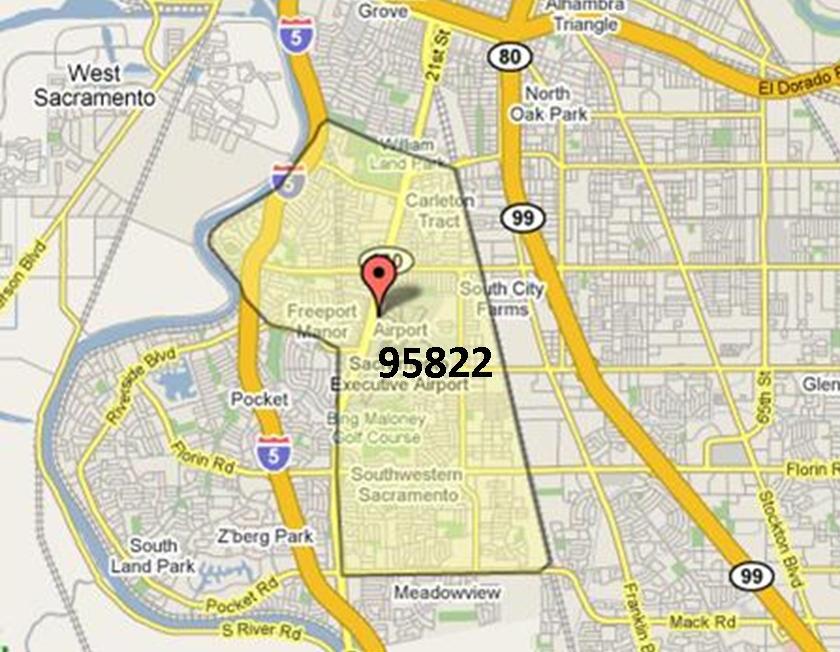
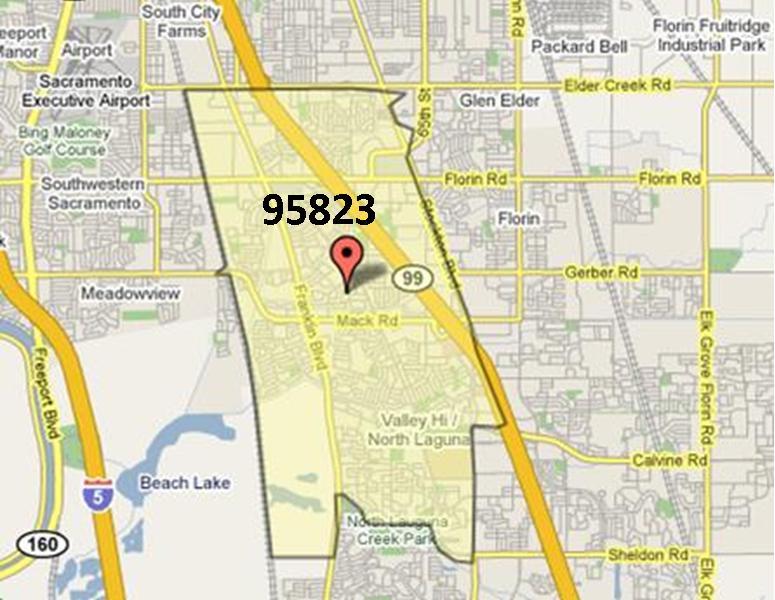
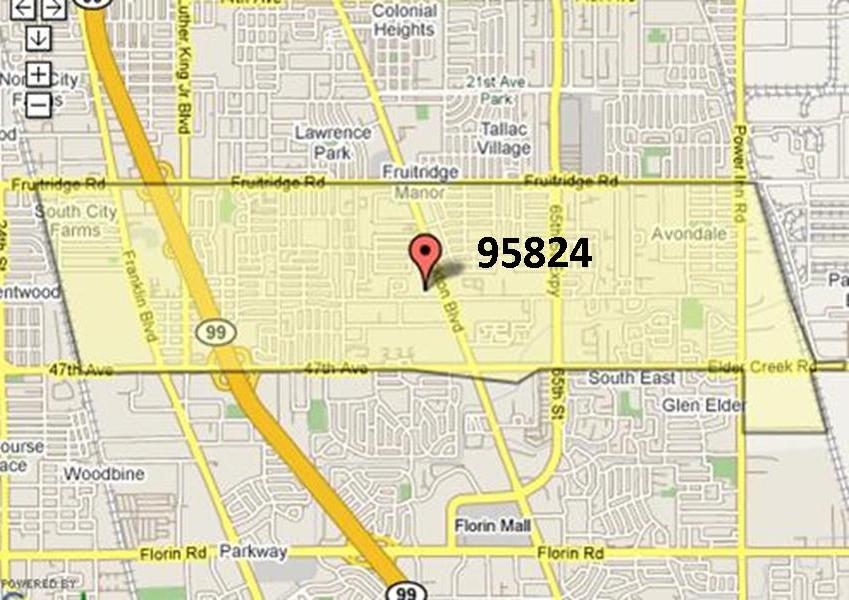
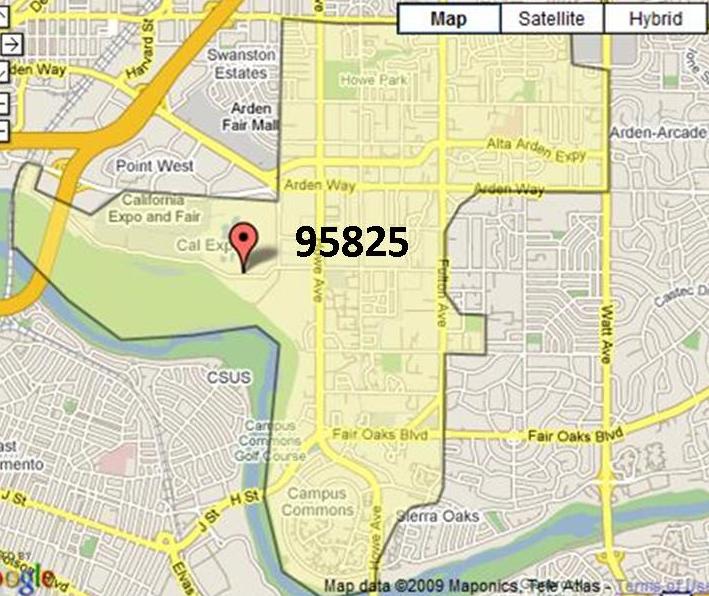
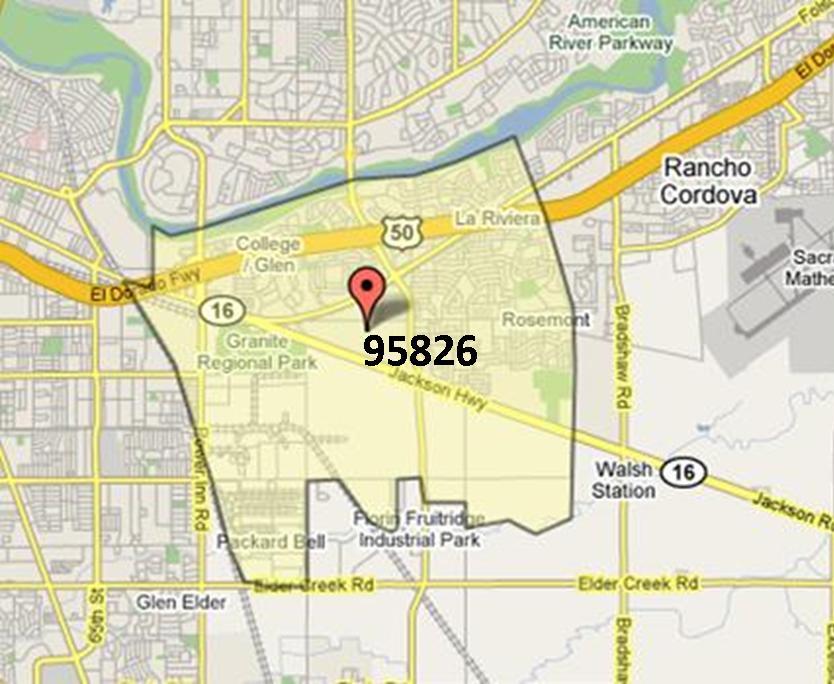
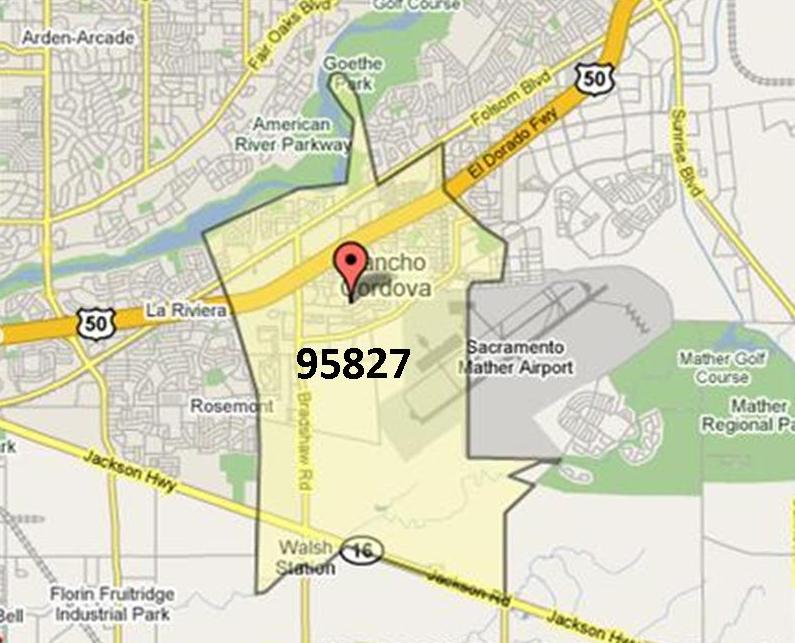
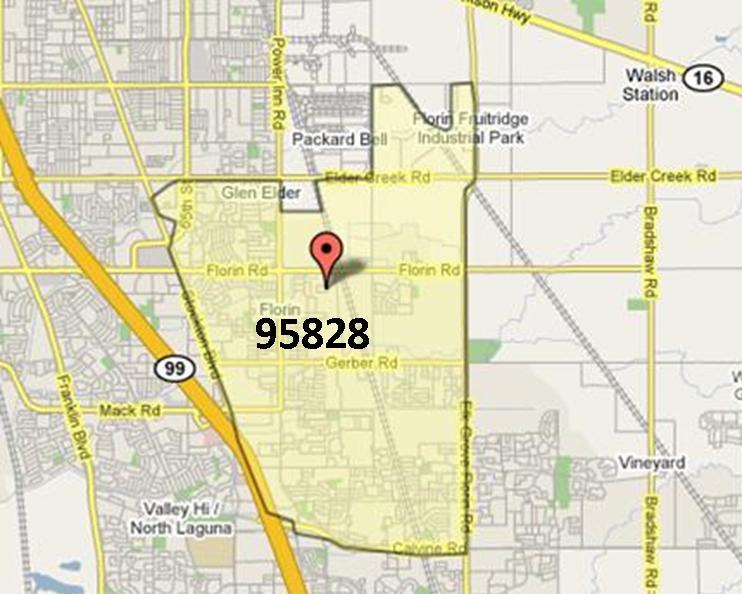
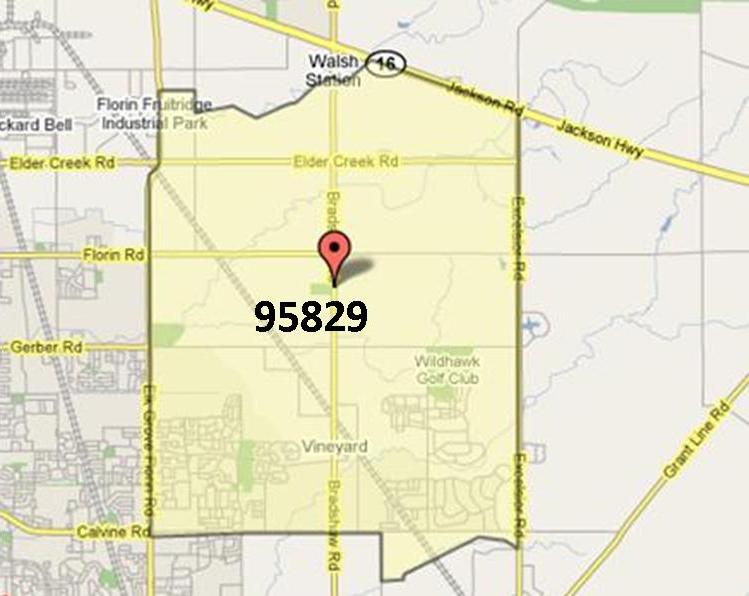
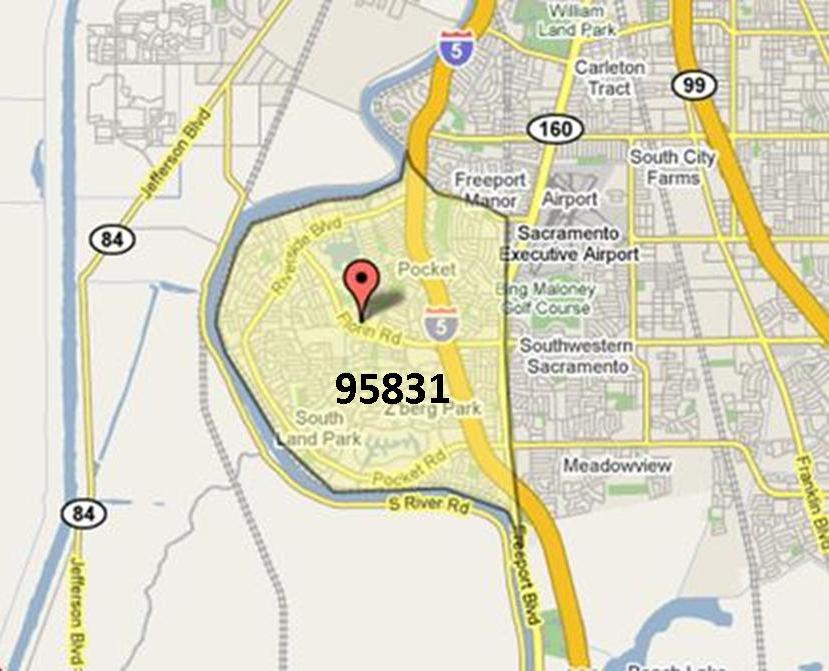
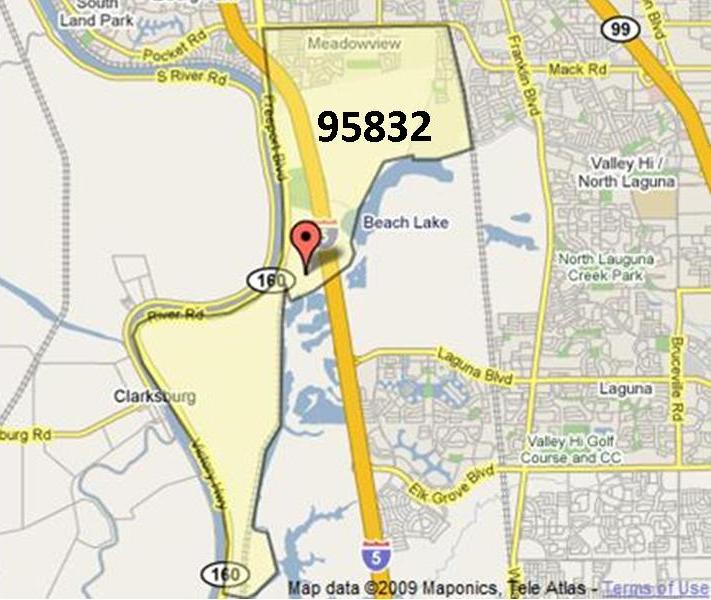
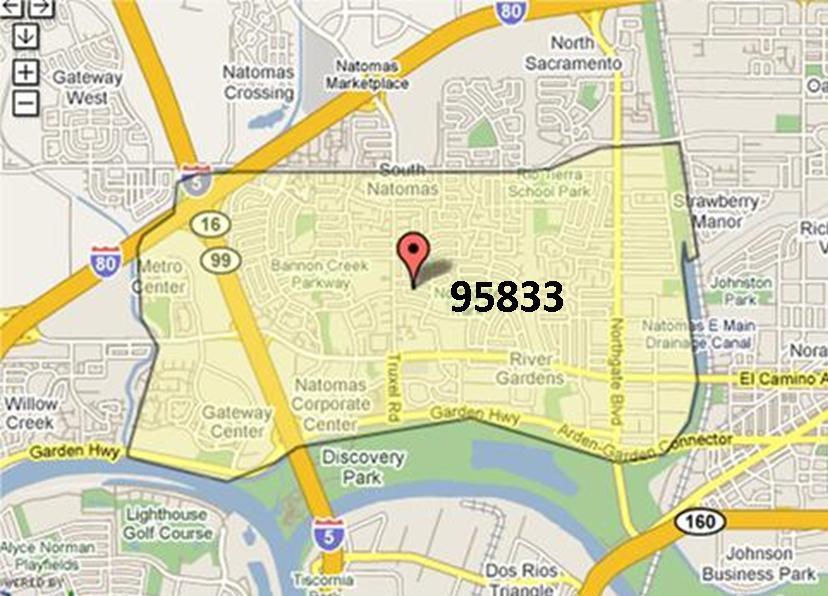
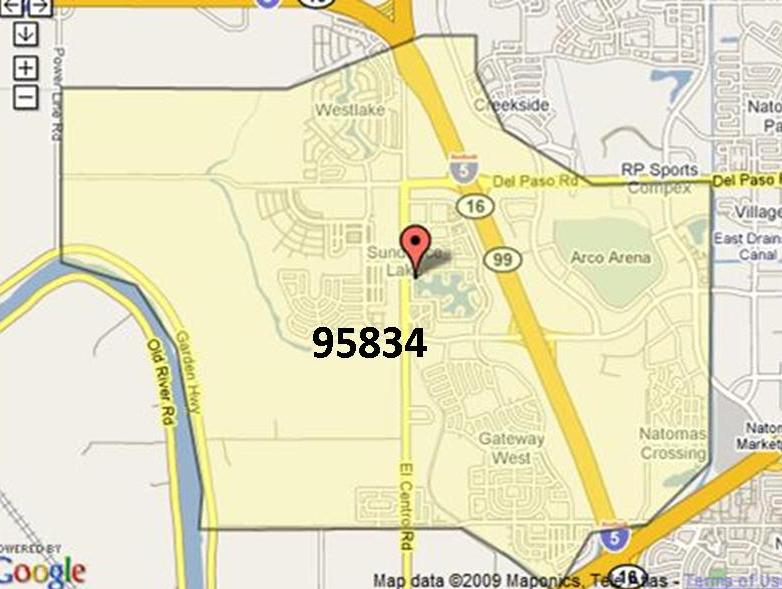
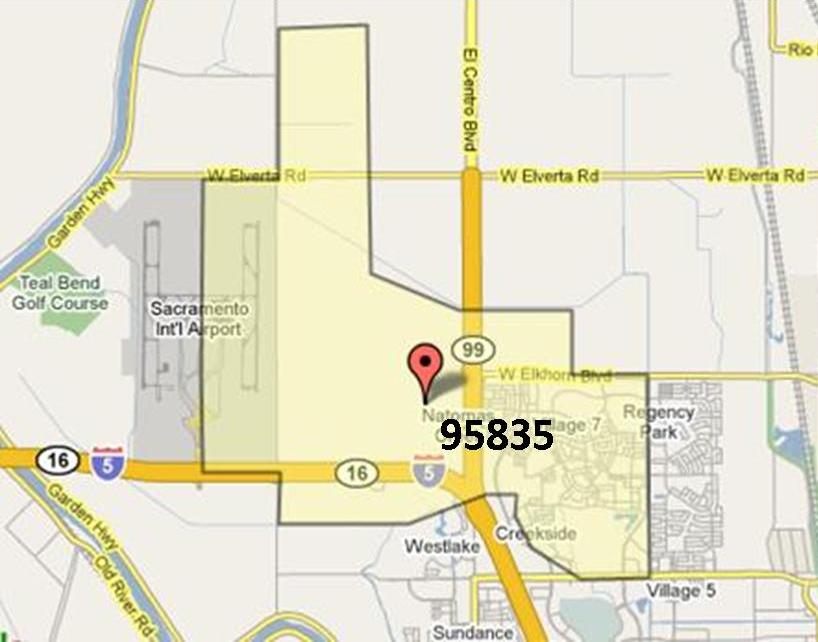
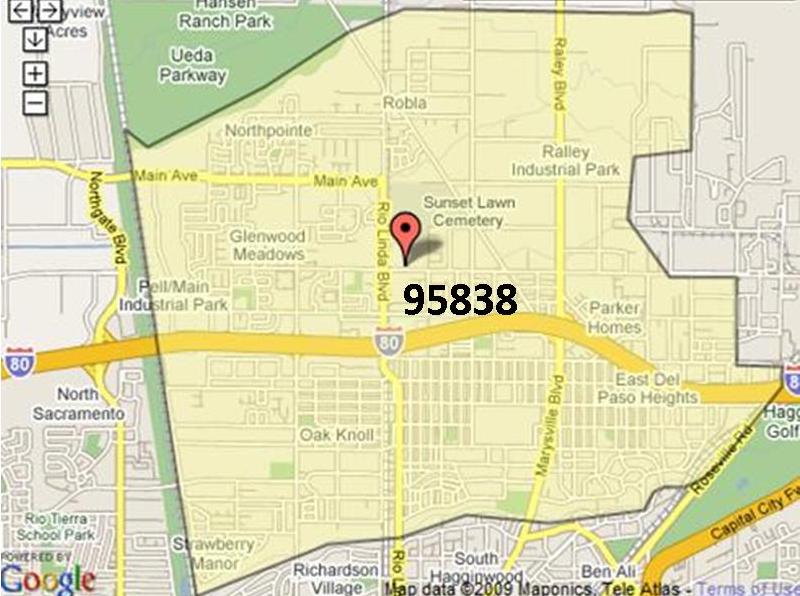
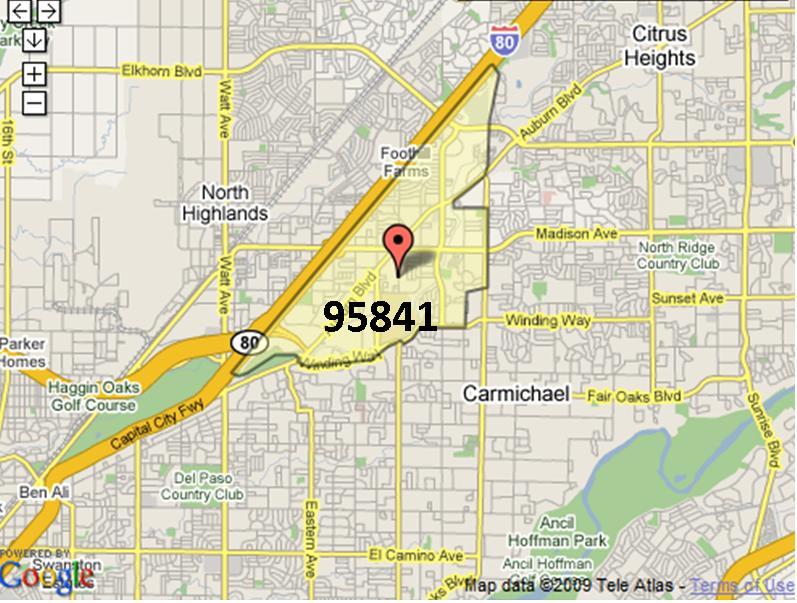
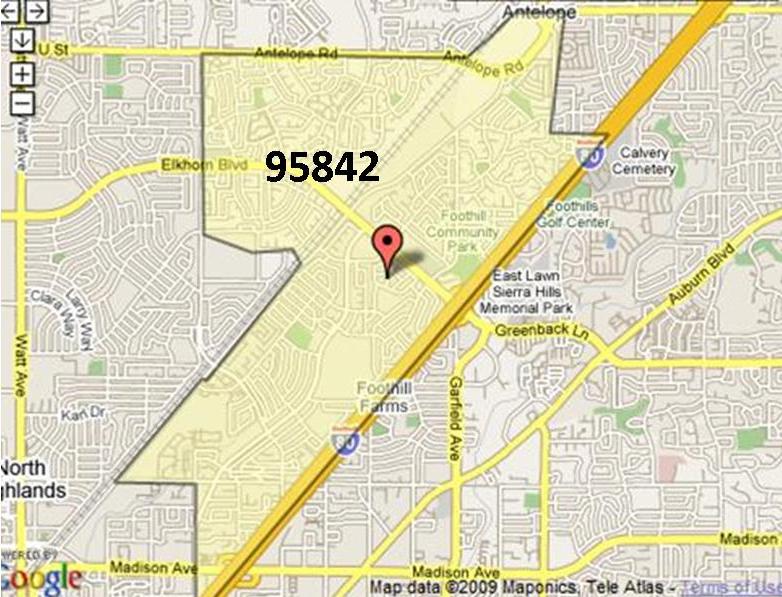
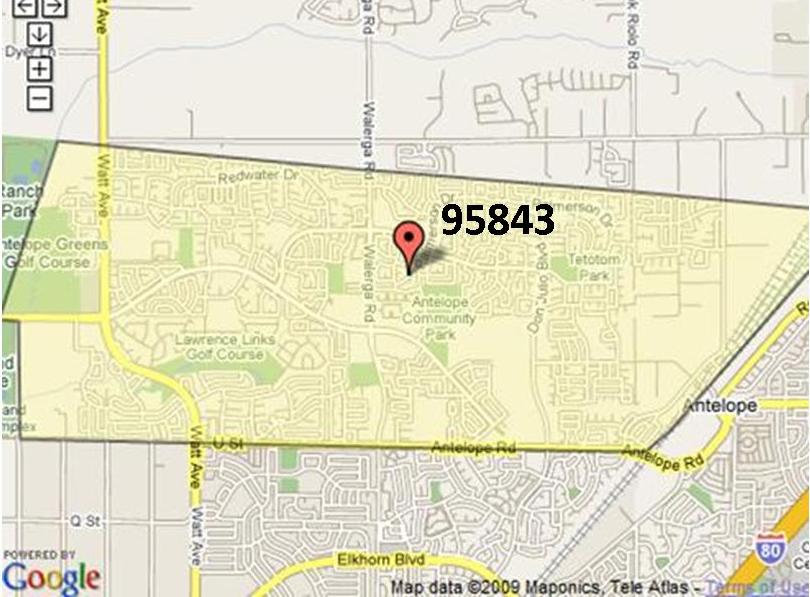
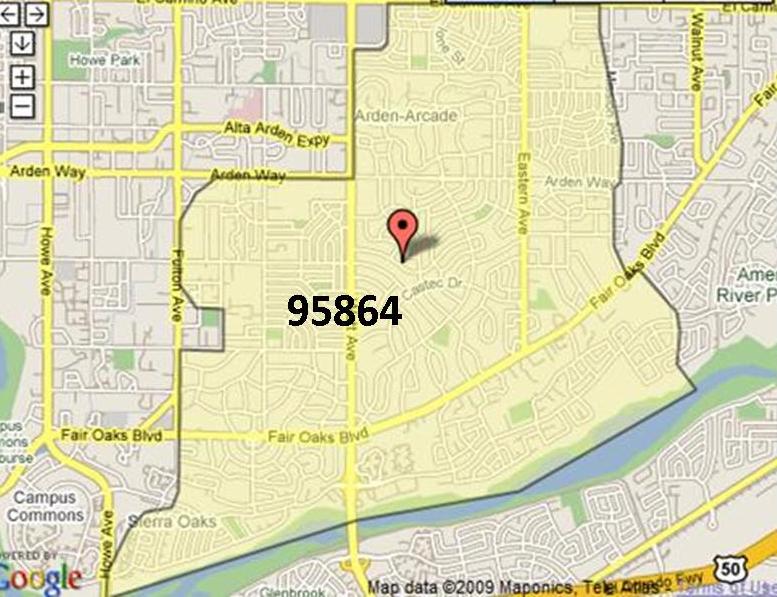
Auburn 95603, West Sac 95605, Carmichael 95608, Citrus Hts 95610, Citrus Hts 95621, Elk Grove 95624, Fair Oaks 95628, Folsom 95630, Lincoln 95648, Loomis 95650, North Hilnds 95660, Roseville 95661, Orangevale 95662, Placerville 95667, Rancho Cord 95670, Rio Linda 95673, Rocklin 95677, Roseville 95678, Cameron Pk 95682, West Sac 95691, Rancho Cord 95742, Pollock Pines 95726, Granite Bay 95746, Roseville 95747, Elk Grove 95757, Elk Grove 95758, El Dorado Hills 95762, Rocklin 95765, Arden 95815, Downtown 95816, Oak Park 95817, Land Park 95818, East Sac 95819, Elder Creek 95820, Arden 95821, Greenhaven 95822, Franklin 95823, Fruitridge 95824, Arden 95825, College Greens 95826, Rosemont 95827, Florin 95828, Vineyard 95829, Pocket 95831, Natomas 95833, Natomas 95834, Natomas 95835, Del Paso Hts 95838, North Sac 95841, Foothill Frms 95842, Antelope 95843, Arden 95864