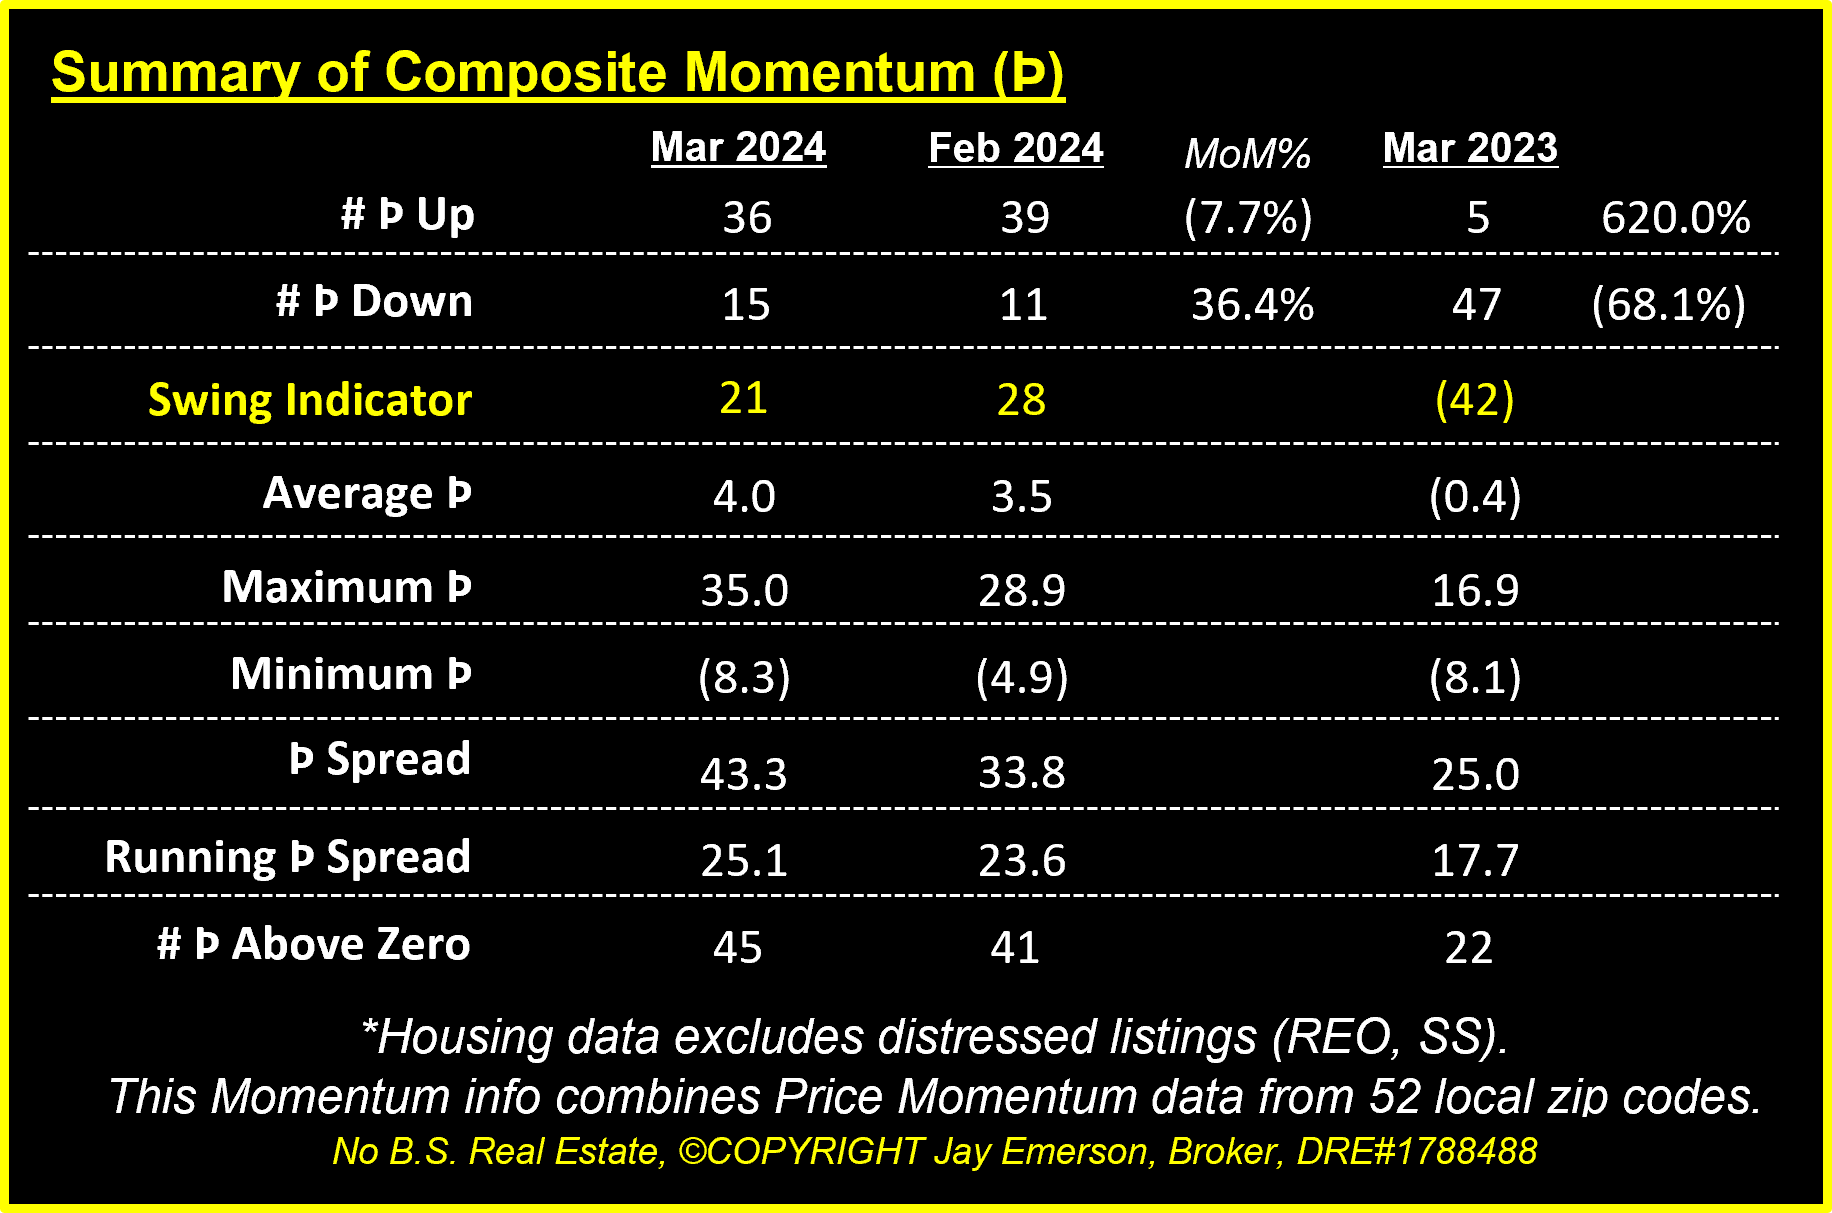
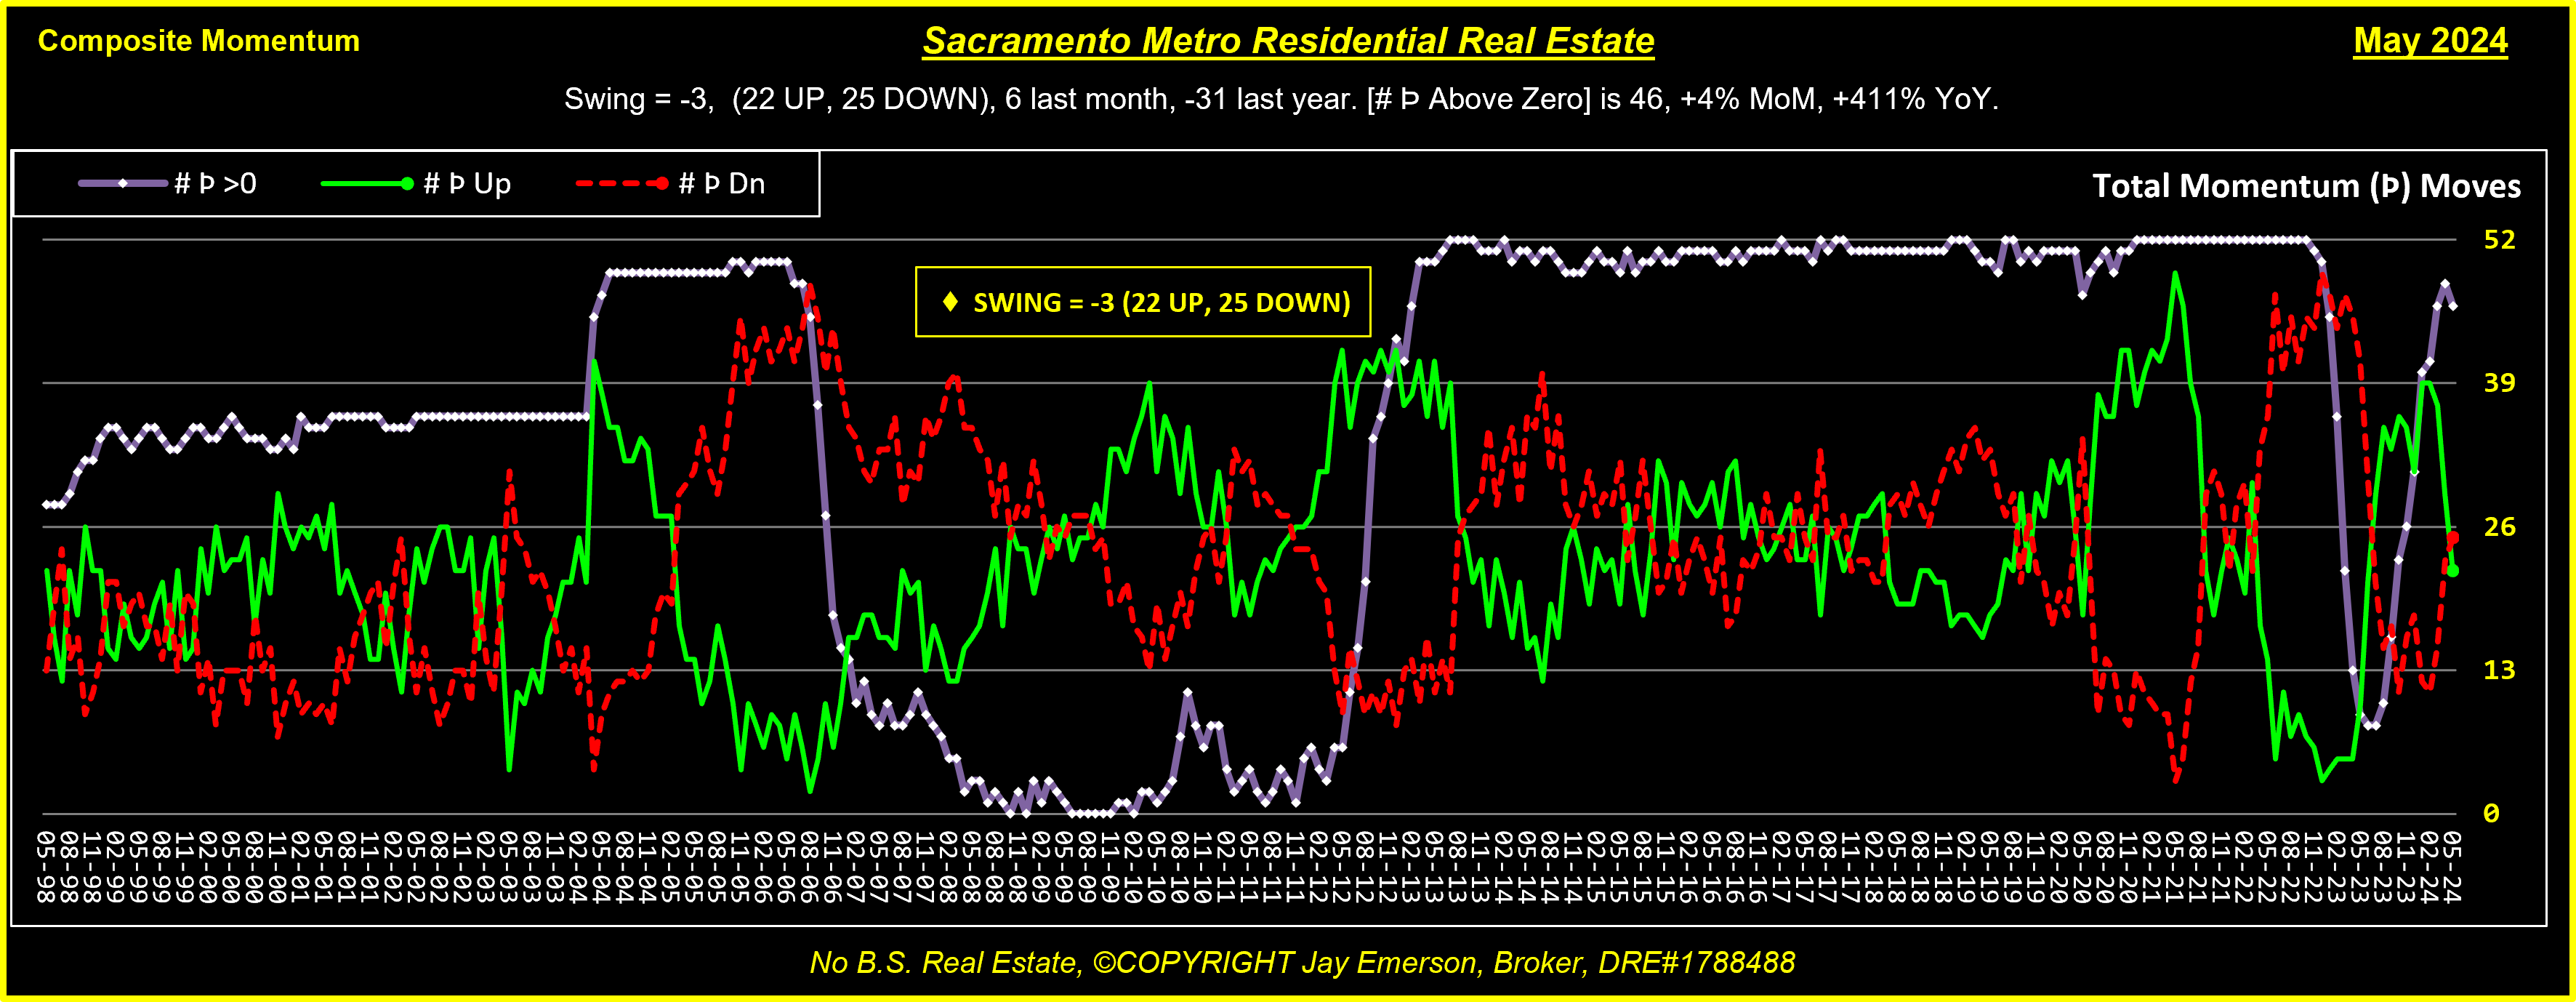
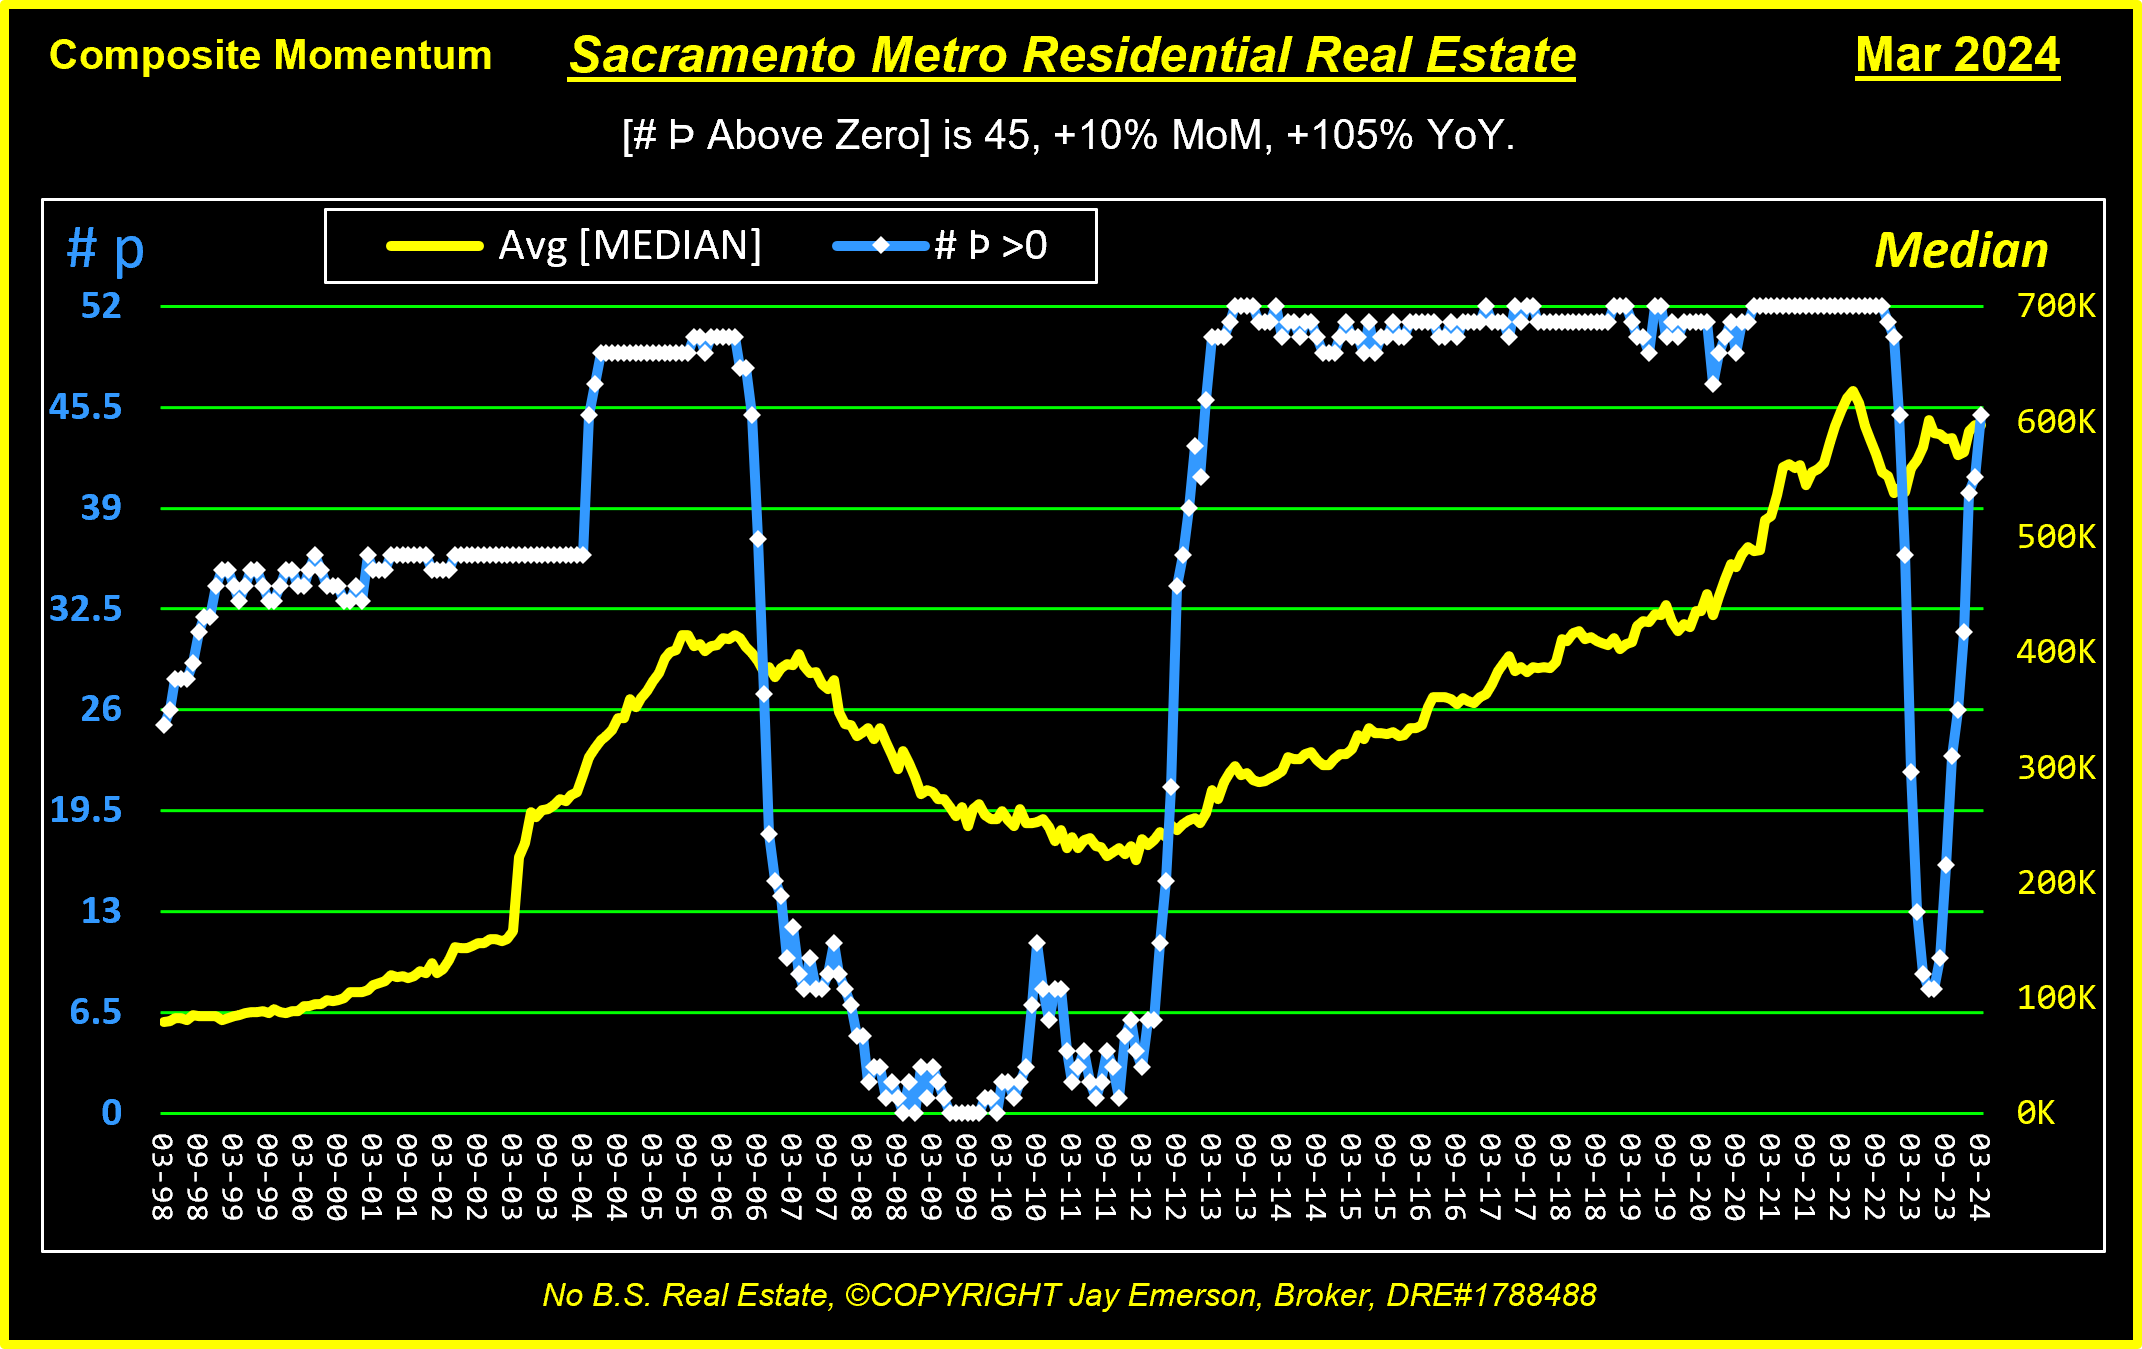
My “Swing Indicator”, similar but not identical to an EKG because of the granular elements (zip codes), tells me when the general direction (via momentum) is increasing, decreasing, or unchanged in the current month. When aggregate momentum is too high or too low, the consequences are usually more of the same.