Sac Metro Real Estate Update - 2022 03
OPINION: This piece, like the others, may contain opinion.

[responsivevoice]
(Data is thru February). The data I track represents the life of a typical MLS listing in our 3 counties. When a home is first listed, it is NEW [and ACTIVE]. During the month, it can become PENDING [once or more times]. If the escrow is successful, it becomes SOLD. The NEW and PENDING data is “transient” whereas ACTIVE and SOLD are the data elements which matter at the end of the month.
If a zip code has more SOLD than ACTIVE (“Turnover”), there is a depletion of inventory that can only be replenished by NEW in the next month(s). When Turnover is greater than 100%, the depletion is measurable. If a zip code has more PENDING than NEW (“Appetite”), it depicts a healthy demand for the NEW and ACTIVE listings especially when Appetite is greater than 100%.
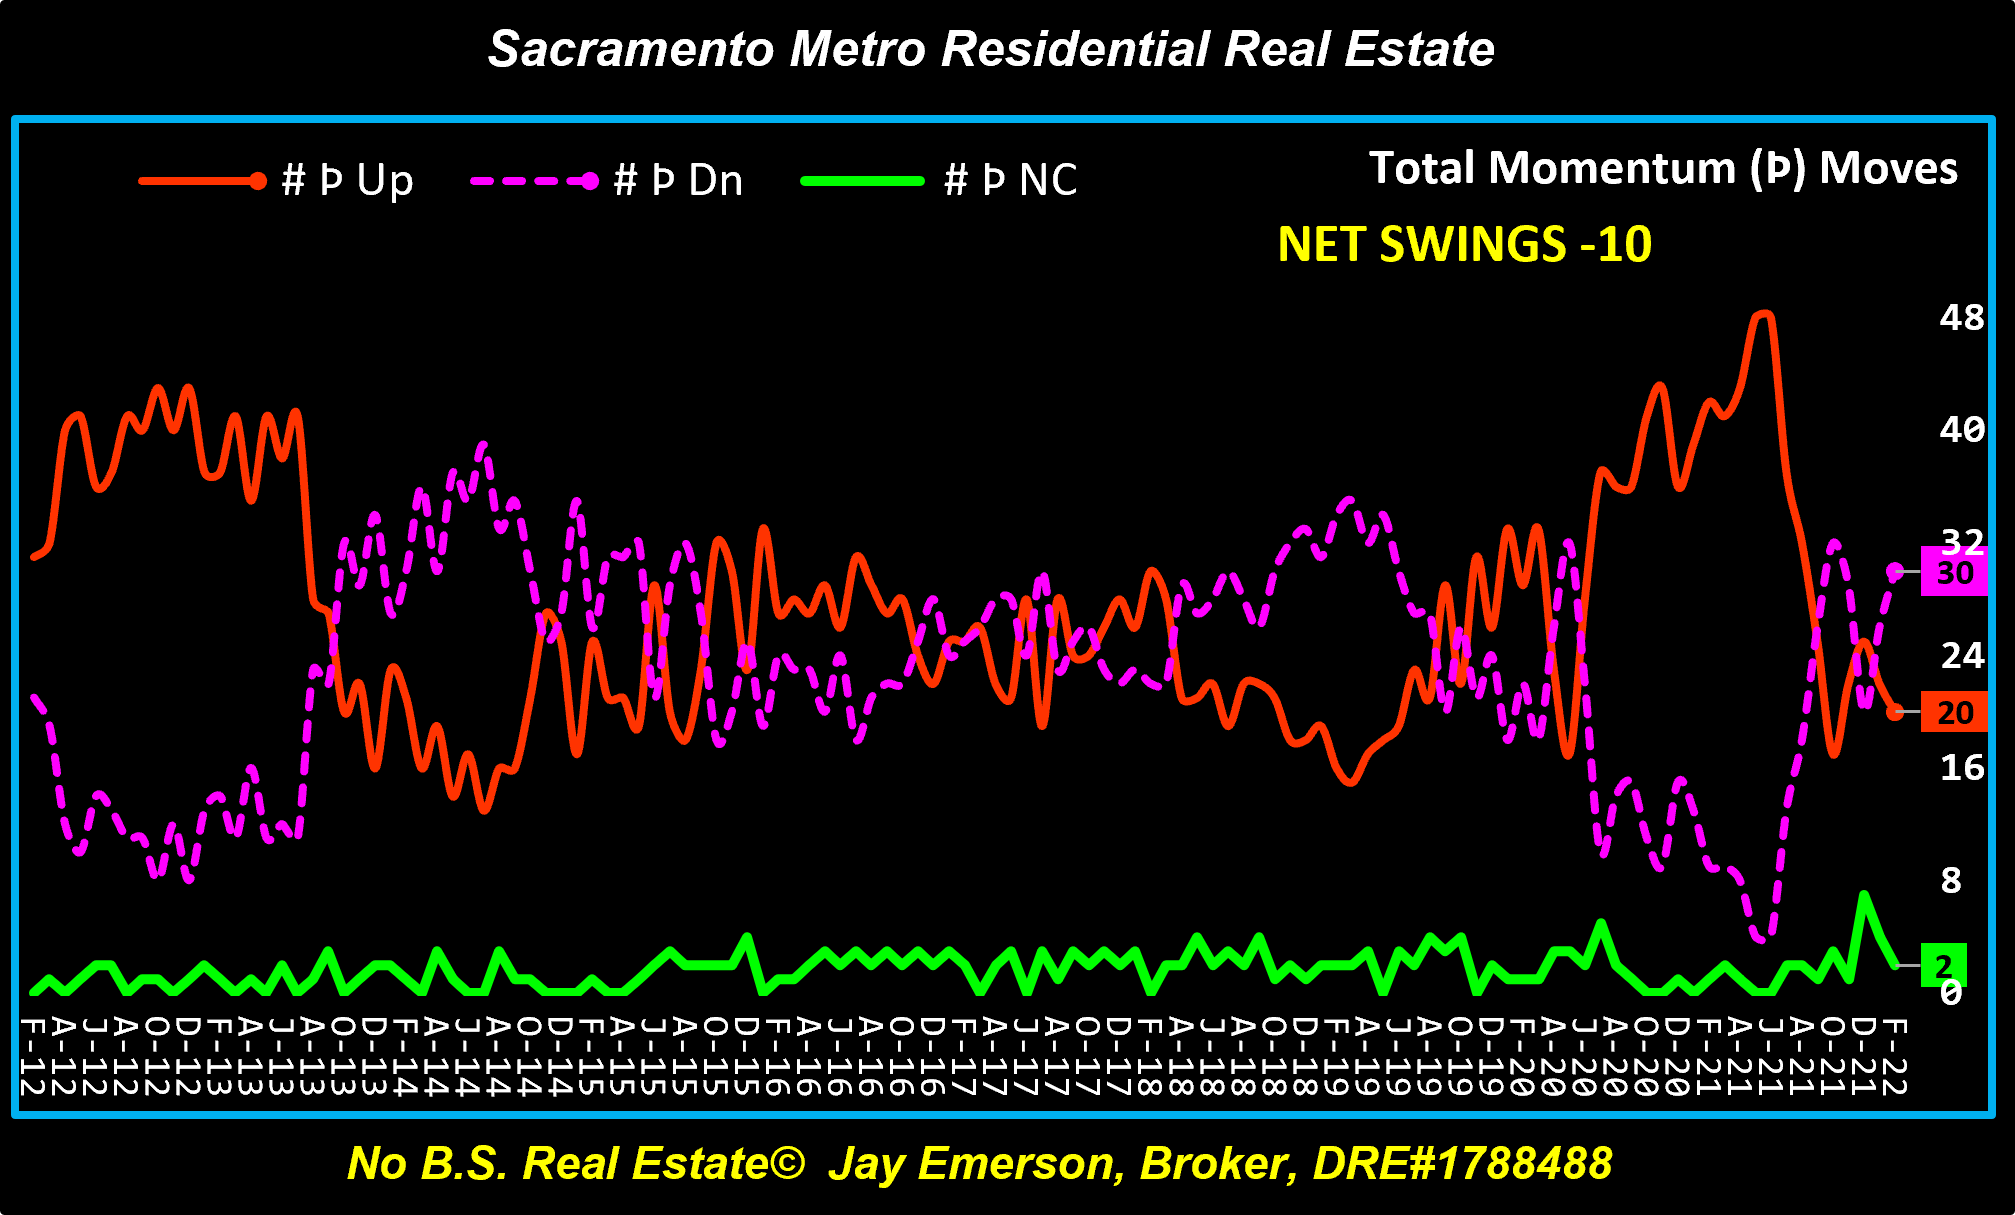
Momentum is calculated for each Median Price, as a commodity trader would do, to depict the direction and force of the price change. When a momentum crosses its zero-axis, the market is headed for a reversal. There are currently NO zip codes with a negative momentum, indicating a BUYER’S MARKET.
[/responsivevoice]
Charted
Major Indicators – /major
Financing Indicators – /financing
Composite Averages – /averages
Composite Momentum – /momentum
Metro Counties – /counties
[responsivevoice]
There are key changes while some things DIDN’T change. Composite Averages and Composite Momentum use the 52 zip codes I track.
- Composite Average [New] listings was 33 and is 86% of its [10yr Feb Avg], favoring SELLERS.
- Composite Average [Active] listings was 19 and is 45% of its [10yr Feb Avg], favoring SELLERS.
- Composite Average [Pended] listings was 34 and is 114% of its [10yr Feb Avg], favoring SELLERS.
- Composite Average [Sold] listings was 25 and is 104% of its [10yr Feb Avg], favoring SELLERS.
- Composite Average [Active] + [Sold] listings was 44, 67% of its [10yr Feb Avg]. Supply is very low, favoring SELLERS.
- Composite Average Appetite and Turnover exceed 100% and that has been true for the last 2 years.
- All 3 counties (Sacramento, El Dorado, Placer) reached new high Median Prices in February.
- The Average Median Price hit yet another new high Median Price in February.
- 19 of the 52 zip codes hit high Median Prices in February.
- 30 of the 52 zip codes had momentum decreases in February. (Momentum measures the Median Price change.)
- Inventory is still less than half of the 10-year average for February.
- View all charts at my website – www.JayEmerson.com/market
[/responsivevoice]
This info graphic summarizes most of the data.

My Swing Indicator may be predicting an end to the 2 years of “bonkers”. (An end to the “fizzle”.) The market was smooth during Trump.
Sacramento County zip codes
- Carmichael 95608 – Median $545K, (Þ▼,MoM▲3.4%,YoY▲10.1%) – Appetite 107.7% – Turnover 102.8% – Consumption 105.3%
- Citrus Heights 95610 – Median $549K (NEW HIGH) (Þ▼,MoM▲5.6%,YoY▲16.6%) – Appetite 105.3% – Turnover 166.7% – Consumption 125.0%
- Citrus Heights 95621 – Median $480K (NEW HIGH) (Þ▼,MoM▲3.0%,YoY▲16.5%) – Appetite 93.0% – Turnover 205.6% – Consumption 126.2%
- Elk Grove 95624 – Median $675K (NEW HIGH) (Þ▼,MoM▲3.7%,YoY▲23.2%) – Appetite 119.0% – Turnover 128.6% – Consumption 122.2%
- Fair Oaks 95628 – Median $646K (NEW HIGH) (Þ◄►,MoM▲4.2%,YoY▲14.5%) – Appetite 95.7% – Turnover 125.0% – Consumption 105.7%
- Folsom 95630 – Median $806K (NEW HIGH) (Þ▲,MoM▲3.3%,YoY▲22.1%) – Appetite 108.1% – Turnover 138.2% – Consumption 118.8%
- North Highlnds 95660 – Median $410K (NEW HIGH) (Þ▲,MoM▲6.2%,YoY▲24.2%) – Appetite 109.4% – Turnover 113.6% – Consumption 111.1%
- Orangevale 95662 – Median $580K (NEW HIGH) (Þ▲,MoM▲9.8%,YoY▲18.4%) – Appetite 85.3% – Turnover 156.3% – Consumption 108.0%
- Rancho Cordova 95670 – Median $538K (NEW HIGH) (Þ▼,MoM▲14.5%,YoY▲15.0%) – Appetite 128.2% – Turnover 246.7% – Consumption 161.1%
- Rio Linda 95673 – Median $428K, (Þ▲,MoM▲0.9%,YoY▲24.1%) – Appetite 50.0% – Turnover 100.0% – Consumption 70.6%
- Rancho Cordova 95742 – Median $641K, (Þ◄►,MoM▲2.6%,YoY▲18.7%) – Appetite 134.8% – Turnover 311.1% – Consumption 184.4%
- Elk Grove 95757 – Median $680K, (Þ▼,MoM▼-2.3% ,YoY▲6.6%) – Appetite 94.7% – Turnover 152.6% – Consumption 114.0%
- Elk Grove 95758 – Median $618K (NEW HIGH) (Þ▲,MoM▲3.2%,YoY▲26.1%) – Appetite 108.9% – Turnover 200.0% – Consumption 135.9%
- Arden 95815 – Median $349K, (Þ▼,MoM▼-4.4% ,YoY▲4.8%) – Appetite 120.0% – Turnover 271.4% – Consumption 168.2%
- Downtown 95816 – Median $778K, (Þ▲,MoM▲10.4%,YoY▲30.3%) – Appetite 220.0% – Turnover 250.0% – Consumption 233.3%
- Oak Park 95817 – Median $532K, (Þ▼,MoM▲0.8%,YoY▲8.8%) – Appetite 116.7% – Turnover 45.5% – Consumption 82.6%
- Land Park 95818 – Median $728K, (Þ▼,MoM▼-3.7% ,YoY▲2.1%) – Appetite 175.0% – Turnover 145.5% – Consumption 160.9%
- East Sacramento 95819 – Median $765K, (Þ▲,MoM▲4.8%,YoY▲25.0%) – Appetite 109.1% – Turnover 187.5% – Consumption 130.0%
- Elder Creek 95820 – Median $415K, (Þ▼,MoM▼-3.0% ,YoY▲11.3%) – Appetite 132.4% – Turnover 166.7% – Consumption 143.6%
- Arden 95821 – Median $527K (NEW HIGH) (Þ▲,MoM▲4.2%,YoY▲22.6%) – Appetite 115.8% – Turnover 118.8% – Consumption 117.1%
- Greenhaven 95822 – Median $459K (NEW HIGH) (Þ▼,MoM▲3.8%,YoY▲17.1%) – Appetite 74.5% – Turnover 187.5% – Consumption 103.2%
- Franklin 95823 – Median $450K (MATCHED HIGH) (Þ▼,MoM◄►0.0%,YoY▲16.6%) – Appetite 96.9% – Turnover 162.5% – Consumption 118.8%
- Fruitridge 95824 – Median $382K, (Þ▲,MoM▼-0.8% ,YoY▲25.7%) – Appetite 108.7% – Turnover 109.1% – Consumption 108.8%
- Arden 95825 – Median $410K, (Þ▼,MoM▼-13.7% ,YoY▼-2.4%) – Appetite 111.1% – Turnover 83.3% – Consumption 100.0%
- College Greens 95826 – Median $492K (NEW HIGH) (Þ▼,MoM▲1.4%,YoY▲11.3%) – Appetite 96.4% – Turnover 142.9% – Consumption 111.9%
- Rosemont 95827 – Median $466K, (Þ▼,MoM▲1.3%,YoY▲11.0%) – Appetite 104.3% – Turnover 285.7% – Consumption 146.7%
- Florin 95828 – Median $448K, (Þ▼,MoM▼-2.0% ,YoY▲9.0%) – Appetite 112.1% – Turnover 168.4% – Consumption 132.7%
- Vineyard 95829 – Median $575K, (Þ▼,MoM▼-8.6% ,YoY▲8.5%) – Appetite 80.6% – Turnover 123.8% – Consumption 96.5%
- Pocket 95831 – Median $650K, (Þ▼,MoM▼-1.5% ,YoY▲12.1%) – Appetite 133.3% – Turnover 144.4% – Consumption 137.0%
- Natomas 95833 – Median $478K (NEW HIGH) (Þ▲,MoM▲8.1%,YoY▲22.6%) – Appetite 103.2% – Turnover 80.0% – Consumption 94.1%
- Natomas 95834 – Median $553K, (Þ▼,MoM▼-5.5% ,YoY▲16.4%) – Appetite 92.3% – Turnover 118.2% – Consumption 104.2%
- Natomas 95835 – Median $640K (NEW HIGH) (Þ▲,MoM▲15.3%,YoY▲35.6%) – Appetite 90.0% – Turnover 147.4% – Consumption 105.8%
- Del Paso Heights 95838 – Median $400K, (Þ▲,MoM▼-1.2% ,YoY▲29.4%) – Appetite 88.9% – Turnover 145.0% – Consumption 108.9%
- North Sacramento 95841 – Median $483K, (Þ▲,MoM▲8.5%,YoY▲23.5%) – Appetite 144.4% – Turnover 133.3% – Consumption 141.7%
- Foothill Farms 95842 – Median $440K (NEW HIGH) (Þ▼,MoM▲2.8%,YoY▲8.6%) – Appetite 88.9% – Turnover 141.7% – Consumption 105.1%
- Antelope 95843 – Median $490K, (Þ▼,MoM▼-4.3% ,YoY▲10.6%) – Appetite 90.0% – Turnover 164.3% – Consumption 106.3%
- Arden 95864 – Median $750K, (Þ▲,MoM▼-18.9% ,YoY▲27.6%) – Appetite 81.5% – Turnover 89.5% – Consumption 84.8%
El Dorado County zip codes
- Placerville 95667 – Median $545K, (Þ▲,MoM▲10.8%,YoY▲9.9%) – Appetite 124.4% – Turnover 77.8% – Consumption 100.0%
- Cameron Pk 95682 – Median $678K, (Þ▼,MoM▼-0.3% ,YoY▲10.1%) – Appetite 59.3% – Turnover 76.2% – Consumption 66.7%
- Pollock Pines 95726 – Median $470K, (Þ▲,MoM▼-2.1% ,YoY▲34.3%) – Appetite 126.7% – Turnover 120.0% – Consumption 124.0%
- El Dorado Hills 95762 – Median $875K, (Þ▼,MoM◄►0.0%,YoY▲6.7%) – Appetite 90.8% – Turnover 96.0% – Consumption 93.0%
Placer County zip codes
- Auburn 95603 – Median $613K, (Þ▼,MoM▼-7.8% ,YoY▼-4.2%) – Appetite 84.2% – Turnover 102.3% – Consumption 92.0%
- Lincoln 95648 – Median $699K (NEW HIGH) (Þ▲,MoM▲7.9%,YoY▲30.7%) – Appetite 103.0% – Turnover 103.3% – Consumption 103.1%
- Loomis 95650 – Median $893K, (Þ▼,MoM▼-32.9% ,YoY▼-17.2%) – Appetite 100.0% – Turnover 53.8% – Consumption 79.3%
- Roseville 95661 – Median $577K, (Þ▼,MoM◄►0.0%,YoY▼-22.0%) – Appetite 97.4% – Turnover 84.6% – Consumption 94.1%
- Rocklin 95677 – Median $658K, (Þ▼,MoM▲4.8%,YoY▲11.3%) – Appetite 100.0% – Turnover 153.8% – Consumption 118.4%
- Roseville 95678 – Median $620K (NEW HIGH) (Þ▼,MoM▲6.7%,YoY▲11.1%) – Appetite 85.4% – Turnover 158.8% – Consumption 106.9%
- Granite Bay 95746 – Median $1,497K (NEW HIGH) (Þ▲,MoM▲54.2%,YoY▲49.7%) – Appetite 95.7% – Turnover 70.6% – Consumption 85.0%
- Roseville 95747 – Median $673K, (Þ▼,MoM▲0.4%,YoY▲15.0%) – Appetite 111.4% – Turnover 194.7% – Consumption 136.5%
- Rocklin 95765 – Median $693K, (Þ▼,MoM▼-5.7% ,YoY▲13.6%) – Appetite 97.3% – Turnover 161.9% – Consumption 120.7%
Yolo County zip codes
- West Sac 95605 – Median $464K, (Þ▲,MoM▲19.0%,YoY▲22.1%) – Appetite 33.3% – Turnover 40.0% – Consumption 36.4%
- West Sacramento 95691 – Median $595K (NEW HIGH) (Þ▲,MoM▲10.2%,YoY▲26.6%) – Appetite 90.9% – Turnover 100.0% – Consumption 94.5%
