Sacramento Metro Real Estate Update - December 2021
Caveats
[responsivevoice]
Last month’s blog entry started with the “elephant” in the room. Our National Debt is beyond ridiculous. Imagine if you managed your credit cards like congress manages our debt. By the way, congress isn’t at risk of getting calls from collection agencies.
There are risks in posting this content. Private websites are getting censored for saying any of the following:
- The “corona virus” was leaked from a lab in Wuhan, China. (Twitter and LinkedIn censored me for this.)
- Sexual deviants are employed in public schools (again, LinkedIn didn’t like this).
- George Soros is leading the evil (Twitter deleted my first account for this).
- Jack Dorsey (Twitter) allows beheading of people on Twitter but doesn’t like me (this one got me removed)
- The US Congress is allowing our enemies to get elected (the squad hates the USA)
- The Communist Party USA was founded in 1919 – that means McCarthy may have been correct.
- Facebook funded the 2020 election fraud in many states.
- There is nothing organic about the real estate market since March 2020 (lockdowns began).
- Corporate HRs made us think politics and religion were not to be discussed in the workplace.
- California has too many government programs, workers and rules.
- There is an apparent competition between the government of the USA and the Taliban.
With that, enjoy a real estate update. This month I want to explain each metric that I track. There is no way to know if we will suddenly get enough Supply to meet Demand. Neither of these market forces is unlimited. Government policy has a major impact on the market. That seems to be unlimited.
[/responsivevoice]
Averages of 52 Zip Codes – Summary
Data contains truth. And if formulas help make a statement using the data, then the raw data must be shown or risk losing all credibility in the formula.
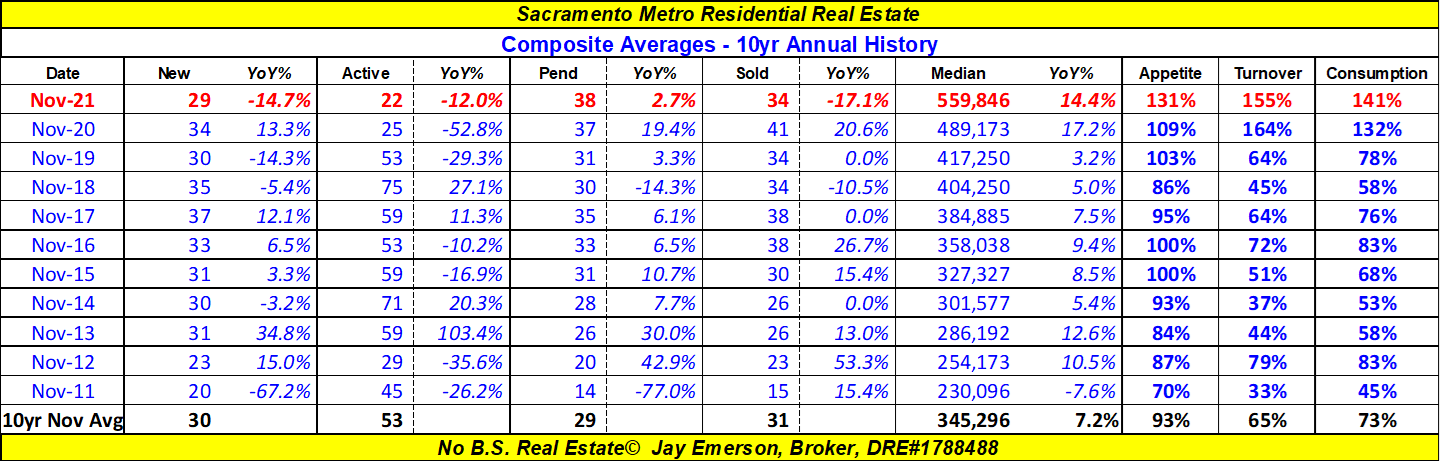
Nov 2021 – Composite Average Summary
- SUPPLY = [New] + [Active] listings was 51, 61% of its [10yr Nov Avg].
- [New] listings was 29, DOWN 14.7% YoY, and is 95% of its [10yr Nov Avg], favoring SELLERS.
- [Active] listings was 22, DOWN 12.0% YoY, and is 42% of its [10yr Nov Avg], favoring SELLERS.
- Appetite for listings was 131% – [Pended]/[New] or 38/29 – the [10yr Nov Avg] is 93%
- DEMAND = [Pended] + [Sold] listings was 72, 122% of its [10yr Nov Avg].
- [Pended] listings was 38, UP 2.7% YoY, and is 133% of its [10yr Nov Avg], favoring SELLERS.
- [Sold] listings was 34, DOWN 17.1% YoY, and is 111% of its [10yr Nov Avg], favoring SELLERS.
- Turnover of listings was 155% – [Sold]/[Active] or 34/22 – the [10yr Nov Avg] is 65%
- Consumption of listings was 141% – ([DEMAND])/([SUPPLY]) or 72/51 – the [10yr Nov Avg] is 73%
Averages of 52 Zip Codes – Appetite
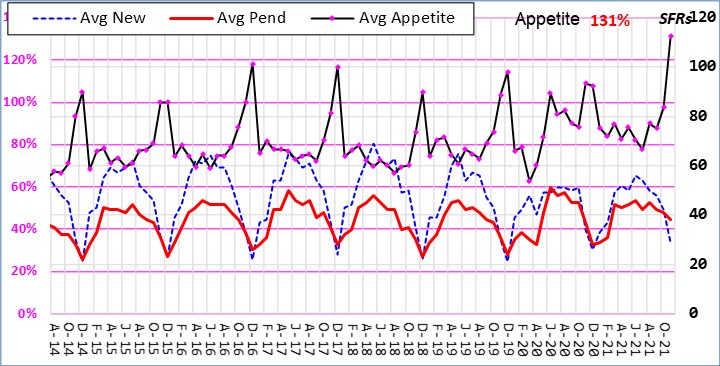
Nov 2021 – Composite Average Appetite
- [New] listings was 29, DOWN 31.0% MoM and DOWN 14.7% YoY.
- [Pended] listings was 38, DOWN 7.3% MoM and UP 2.7% YoY.
- Therefore Appetite is at 131% favoring SELLERS.
- Last month’s Appetite was 98%.
Appetite compares data for New and Pending listings for the month. If New and Pending are equal, it represents an eager demand. If New is less than Pending, supply will vanish if it continues.
Simple math is used and Supply is lacking. When newly Active listings are ‘taken off the market’ as Pending, their life as Active quickly goes away thereby leaving Supply weaker. It also shows that there is still Demand. If this and Turnover (Sold/Active) are high, Supply is still vanishing quicker than Demand.
Averages of 52 Zip Codes – Turnover
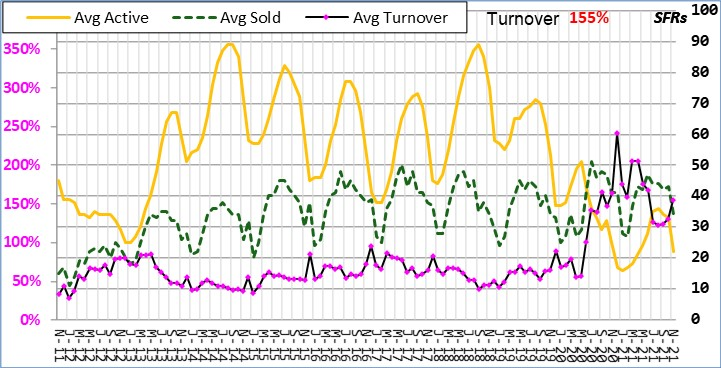
Nov 2021 – Composite Average Turnover
- [Active] listings was 22, DOWN 33.3% MoM and DOWN 12.0% YoY.
- [Sold] listings was 34, DOWN 20.9% MoM and DOWN 17.1% YoY.
- Therefore Turnover is at 155%, favoring SELLERS.
- Last month’s Turnover was 130%.
Turnover compares Active and Sold listings. If Active and Sold are equal, it represents an eager demand. If Active is less than Sold, supply will vanish if it continues.
This chart shows how Supply (Active) has vanished and Demand (Sold) has not. And Winter is here. That means seasonality has a damping effect on the market. And, yes, fear is gripping many otherwise willing buyers and sellers.
Averages of 52 Zip Codes – Consumption
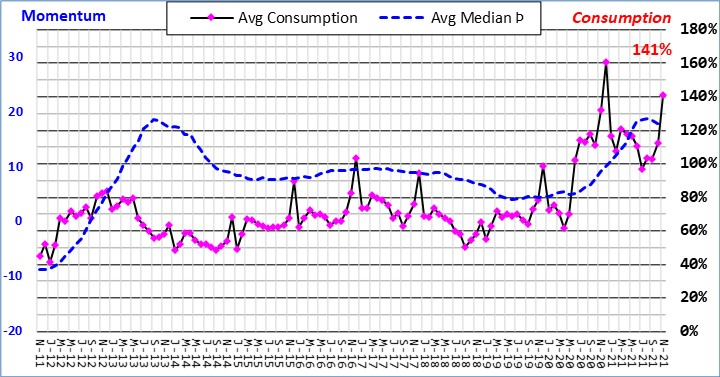
Nov 2021 – Composite Average Consumption
- Consumption is at 141% favoring SELLERS.
- The calculation is (Pending+Sold)/(New+Active) and roughly represents Demand over Supply.
Consumption is a simple calculation of Demand over Supply. Listings go from Active (New), to Pending, to Sold. From Pending back to Active means escrow failure. Supply is Active listings which grows by New listings and Demand is the depletion of supply by Pending and Sold listings.
Sacramento County zip codes
- Carmichael 95608 – Median $547K, (Þ▲,MoM▼-0.5% ,YoY▲24.0%) – Appetite 140.8% – Turnover 122.0% – Consumption 132.2%
- Citrus Heights 95610 – Median $494K, (Þ▼,MoM▼-1.2% ,YoY▲14.4%) – Appetite 112.1% – Turnover 86.5% – Consumption 98.6%
- Citrus Heights 95621 – Median $445K, (Þ▼,MoM▼-2.2% ,YoY▲14.4%) – Appetite 128.1% – Turnover 316.7% – Consumption 179.5%
- Elk Grove 95624 – Median $590K, (Þ▼,MoM▼-4.8% ,YoY▲14.6%) – Appetite 145.5% – Turnover 218.5% – Consumption 173.2%
- Fair Oaks 95628 – Median $560K, (Þ▼,MoM▼-10.1% ,YoY▲1.4%) – Appetite 156.7% – Turnover 195.7% – Consumption 173.6%
- Folsom 95630 – Median $701K, (Þ▼,MoM▼-5.0% ,YoY▲6.2%) – Appetite 132.8% – Turnover 119.1% – Consumption 126.7%
- North Highlnds 95660 – Median $380K (MATCHED HIGH) (Þ▼,MoM▲1.1%,YoY▲15.2%) – Appetite 109.8% – Turnover 79.2% – Consumption 98.5%
- Orangevale 95662 – Median $515K, (Þ▼,MoM▼-6.9% ,YoY▲8.9%) – Appetite 132.3% – Turnover 225.0% – Consumption 168.6%
- Rancho Cordova 95670 – Median $500K (MATCHED HIGH) (Þ▼,MoM▲1.8%,YoY▲18.5%) – Appetite 203.0% – Turnover 320.0% – Consumption 247.2%
- Rio Linda 95673 – Median $447K, (Þ▲,MoM▲5.2%,YoY▲22.5%) – Appetite 157.1% – Turnover 209.1% – Consumption 180.0%
- Rancho Cordova 95742 – Median $596K, (Þ◄►,MoM◄►0.0%,YoY▲17.3%) – Appetite 84.0% – Turnover 105.6% – Consumption 93.0%
- Elk Grove 95757 – Median $700K (NEW HIGH) (Þ▲,MoM▲2.0%,YoY▲26.1%) – Appetite 97.4% – Turnover 246.7% – Consumption 139.6%
- Elk Grove 95758 – Median $585K (NEW HIGH) (Þ▲,MoM▲1.7%,YoY▲26.3%) – Appetite 161.3% – Turnover 340.0% – Consumption 219.6%
- Arden 95815 – Median $336K, (Þ▼,MoM▲0.3%,YoY▲12.0%) – Appetite 130.8% – Turnover 150.0% – Consumption 141.4%
- Downtown 95816 – Median $815K, (Þ▲,MoM▲24.8%,YoY▲48.2%) – Appetite 177.8% – Turnover 58.8% – Consumption 100.0%
- Oak Park 95817 – Median $482K, (Þ▼,MoM◄►0.0%,YoY▲10.0%) – Appetite 188.9% – Turnover 100.0% – Consumption 144.4%
- Land Park 95818 – Median $715K, (Þ▲,MoM▲5.8%,YoY▲24.3%) – Appetite 125.0% – Turnover 169.2% – Consumption 142.4%
- East Sacramento 95819 – Median $778K, (Þ▼,MoM▲0.4%,YoY▲9.4%) – Appetite 145.0% – Turnover 143.8% – Consumption 144.4%
- Elder Creek 95820 – Median $400K, (Þ▼,MoM▼-2.4% ,YoY▲4.7%) – Appetite 159.1% – Turnover 131.0% – Consumption 143.1%
- Arden 95821 – Median $440K, (Þ▼,MoM▼-9.8% ,YoY▲4.3%) – Appetite 100.0% – Turnover 104.2% – Consumption 102.1%
- Greenhaven 95822 – Median $458K (NEW HIGH) (Þ▲,MoM▲9.0%,YoY▲19.0%) – Appetite 97.1% – Turnover 107.1% – Consumption 101.6%
- Franklin 95823 – Median $405K, (Þ▼,MoM▼-2.4% ,YoY▲13.8%) – Appetite 115.4% – Turnover 153.8% – Consumption 128.2%
- Fruitridge 95824 – Median $325K, (Þ▼,MoM▼-7.1% ,YoY▲8.3%) – Appetite 145.5% – Turnover 257.1% – Consumption 188.9%
- Arden 95825 – Median $503K (NEW HIGH) (Þ▲,MoM▲2.0%,YoY▲25.8%) – Appetite 137.5% – Turnover 75.0% – Consumption 106.3%
- College Greens 95826 – Median $478K (NEW HIGH) (Þ▲,MoM▲5.1%,YoY▲21.9%) – Appetite 159.3% – Turnover 280.0% – Consumption 202.4%
- Rosemont 95827 – Median $475K (NEW HIGH) (Þ▲,MoM▲8.0%,YoY▲23.4%) – Appetite 105.6% – Turnover 316.7% – Consumption 158.3%
- Florin 95828 – Median $455K, (Þ▼,MoM▼-7.7% ,YoY▲21.3%) – Appetite 89.4% – Turnover 79.4% – Consumption 85.2%
- Vineyard 95829 – Median $529K, (Þ▼,MoM▼-1.7% ,YoY▼-3.8%) – Appetite 123.8% – Turnover 164.7% – Consumption 142.1%
- Pocket 95831 – Median $596K, (Þ▼,MoM▲1.2%,YoY▲9.4%) – Appetite 150.0% – Turnover 153.8% – Consumption 151.6%
- Natomas 95833 – Median $470K (NEW HIGH) (Þ▲,MoM▲5.6%,YoY▲20.2%) – Appetite 121.1% – Turnover 208.3% – Consumption 154.8%
- Natomas 95834 – Median $546K, (Þ▲,MoM▲5.0%,YoY▲26.7%) – Appetite 134.6% – Turnover 178.6% – Consumption 150.0%
- Natomas 95835 – Median $555K, (Þ▲,MoM▲0.9%,YoY▲22.0%) – Appetite 151.7% – Turnover 255.0% – Consumption 193.9%
- Del Paso Heights 95838 – Median $400K (NEW HIGH) (Þ▲,MoM▲5.3%,YoY▲22.0%) – Appetite 140.6% – Turnover 100.0% – Consumption 121.7%
- North Sacramento 95841 – Median $413K, (Þ▼,MoM▼-14.8% ,YoY▲14.4%) – Appetite 233.3% – Turnover 1400.0% – Consumption 400.0%
- Foothill Farms 95842 – Median $430K (NEW HIGH) (Þ▼,MoM▲3.9%,YoY▲16.8%) – Appetite 154.2% – Turnover 218.2% – Consumption 174.3%
- Antelope 95843 – Median $505K (MATCHED HIGH) (Þ▲,MoM◄►0.0%,YoY▲22.6%) – Appetite 138.9% – Turnover 205.3% – Consumption 161.8%
- Arden 95864 – Median $716K, (Þ▼,MoM▼-8.3% ,YoY▲12.4%) – Appetite 115.8% – Turnover 91.7% – Consumption 102.3%
El Dorado County zip codes
- Placerville 95667 – Median $524K, (Þ▼,MoM▲1.7%,YoY▲10.3%) – Appetite 122.5% – Turnover 76.3% – Consumption 92.2%
- Cameron Pk 95682 – Median $630K, (Þ▼,MoM▲2.4%,YoY▲6.1%) – Appetite 117.6% – Turnover 164.3% – Consumption 138.7%
- Pollock Pines 95726 – Median $420K, (Þ▲,MoM▲16.7%,YoY▲22.4%) – Appetite 181.8% – Turnover 117.6% – Consumption 142.9%
- El Dorado Hills 95762 – Median $900K, (Þ▼,MoM▼-10.3% ,YoY▲18.4%) – Appetite 128.9% – Turnover 158.8% – Consumption 144.8%
Placer County zip codes
- Auburn 95603 – Median $661K, (Þ▼,MoM▲2.8%,YoY▲11.1%) – Appetite 108.3% – Turnover 69.8% – Consumption 86.5%
- Lincoln 95648 – Median $630K, (Þ▲,MoM▼-0.5% ,YoY▲23.3%) – Appetite 115.1% – Turnover 136.5% – Consumption 124.2%
- Loomis 95650 – Median $719K, (Þ▼,MoM▼-25.8% ,YoY▼-21.4%) – Appetite 175.0% – Turnover 58.8% – Consumption 96.0%
- Roseville 95661 – Median $734K, (Þ▲,MoM▲22.1%,YoY▲27.7%) – Appetite 152.6% – Turnover 333.3% – Consumption 210.7%
- Rocklin 95677 – Median $641K, (Þ▼,MoM▼-1.4% ,YoY▲5.1%) – Appetite 126.9% – Turnover 276.9% – Consumption 176.9%
- Roseville 95678 – Median $607K (NEW HIGH) (Þ▲,MoM▲22.6%,YoY▲31.4%) – Appetite 185.0% – Turnover 344.4% – Consumption 234.5%
- Granite Bay 95746 – Median $1,075K, (Þ▼,MoM▲19.4%,YoY▼-3.8%) – Appetite 147.6% – Turnover 123.8% – Consumption 135.7%
- Roseville 95747 – Median $635K, (Þ▲,MoM▼-1.9% ,YoY▲20.7%) – Appetite 135.2% – Turnover 171.2% – Consumption 149.7%
- Rocklin 95765 – Median $669K, (Þ▼,MoM▼-0.1% ,YoY▲14.4%) – Appetite 111.6% – Turnover 225.0% – Consumption 152.2%
Yolo County zip codes
- West Sac 95605 – Median $415K, (Þ▼,MoM◄►0.0%,YoY▲9.5%) – Appetite 183.3% – Turnover 175.0% – Consumption 180.0%
- West Sacramento 95691 – Median $567K (NEW HIGH) (Þ▲,MoM▲4.0%,YoY▲30.3%) – Appetite 139.1% – Turnover 250.0% – Consumption 172.7%
Please go to https://jayemerson.com/blog/ and subscribe in the right sidebar.
