Sacramento Metro Real Estate Update - September 2021
[responsivevoice]
Continuous integration and analysis of data is required to lend some explanation to residential real estate in the Sacramento Metro region. Each month, as data is published [and last month is corrected], I attempt to correct or expand on possible futures. This requires trying to see patterns in the data, if they exist. The problem is, trends don’t exist if the market has changed. And your possible future may still happen regardless of data.
Our current market is being pushed and pulled by many forces. We are seeing unprecedented increases in house prices caused by drops in supply and surges in demand. Lockdowns and fear of sickness led to the reluctance of sellers and agents ‘to become nurses’. Whether the thought of a killer cold created the reluctance to sell or sellers’ inability to determine ‘where to go’, listings are still gold.
California is indeed experiencing an exodus of ‘wise and wealthy’ people. For 5 years, my sellers have been going away. “Move-ups” have become “Move-outs”. This is a paradigm-shift for real estate. The older and more experienced agents, with long-standing and “lights out” marketing, are the ones closer to the move-outs. Referral and re-hires have left. I don’t see that changing soon based on the absurdity from California’s governance.
Corporations with cash and the exodus from the Bay Area are the sources of our Sacramento Metro demand. And the exodus FROM our region is creating demand surges in other states (TN, FL, TX, TX, TX, et al.). But buying a replacement home locally means you are probably selling high and then buying high. That’s hard to swallow for sellers who understand math. Yet “all-cash” purchases are low (below 15%).
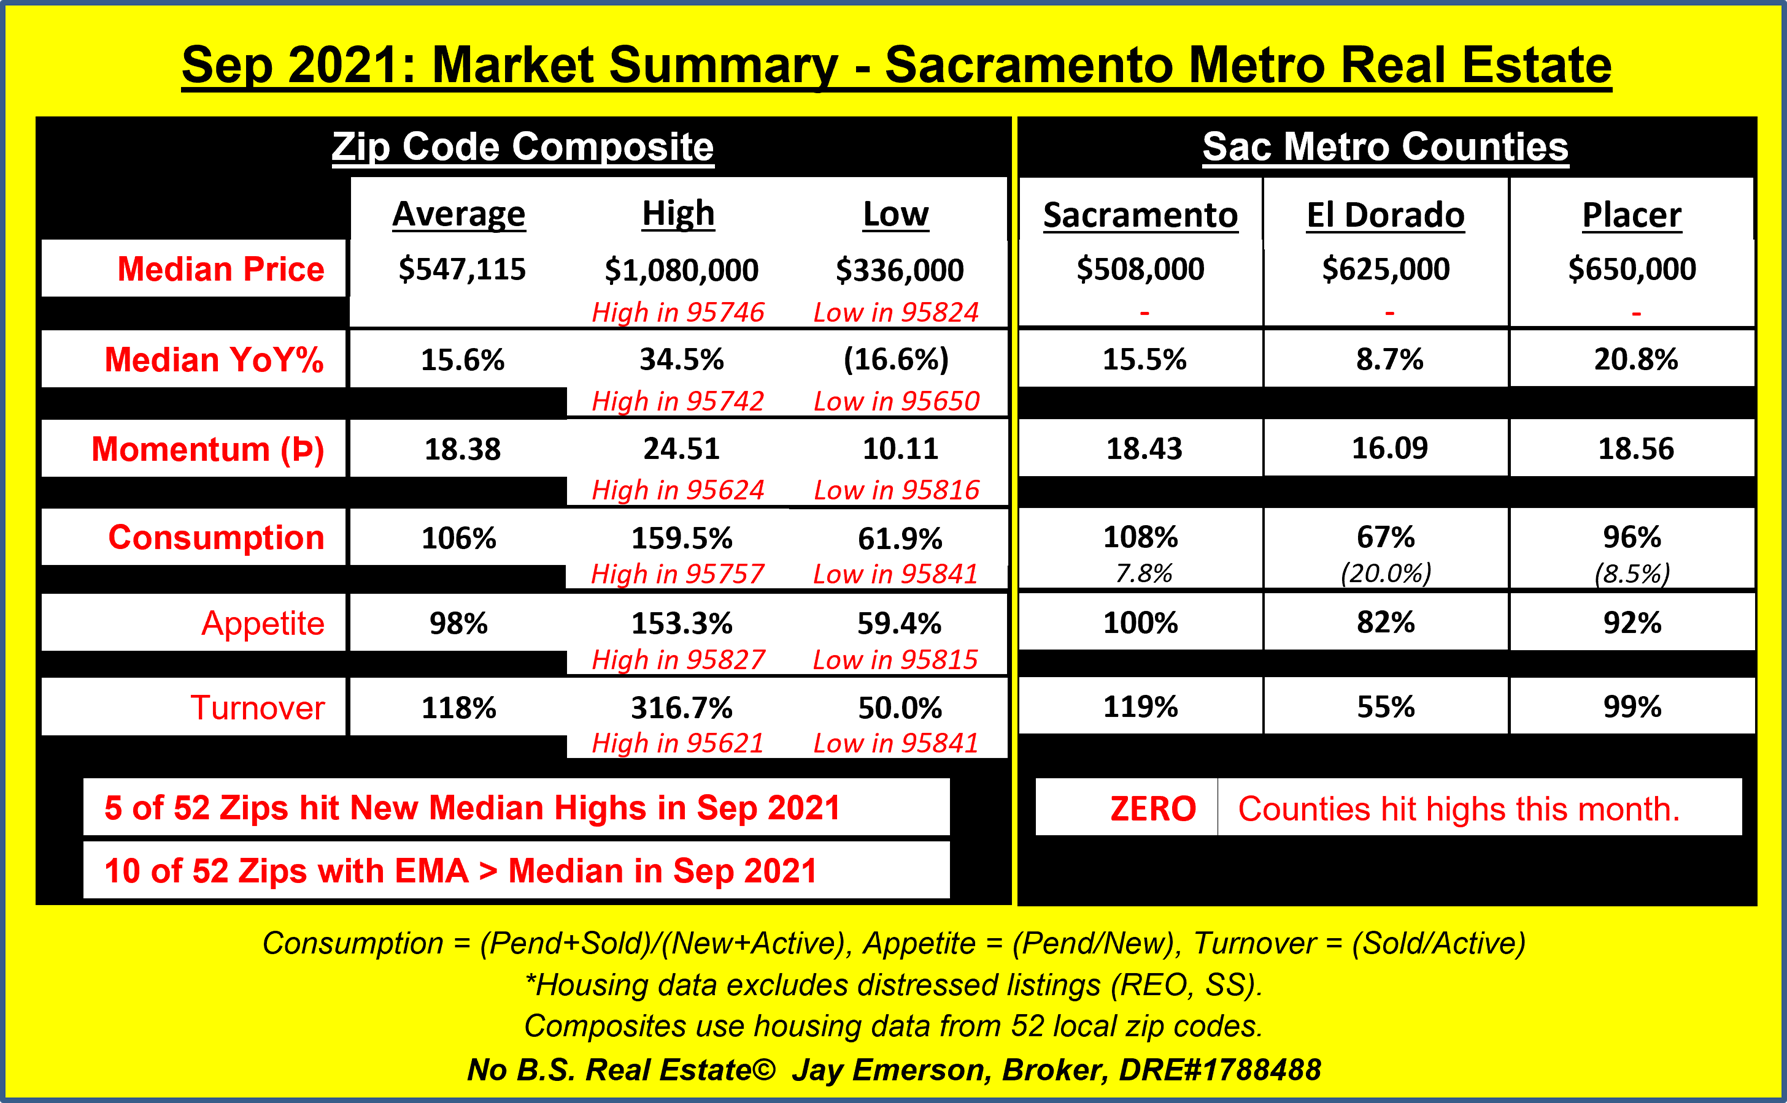
Each month, I analyze our Market by the results of major indicators (confidence, rate, employment, new construction), our 3 Counties, buyer financing choices, and results in 52 zip codes. Supply, demand, and many derivatives are depicted throughout my website for each County and most of the zip codes. The Summary of those indicators (less Major and Financing) are shown in this single graphic below.[/responsivevoice]
[responsivevoice]
The remarkable item, to me, is the increase in Median Prices that are LOWER than their 12-month moving average (EMA). When a Median Price is consistently lower than its EMA, it mathematically means the Median is decreasing.
The Average Median Price, who’s momentum and EMA are coming back to Earth, is still showing a potential to continue its upward run. Builders are mostly not reflected in these numbers. If my current experiences with new construction are an indication of that sub-market, it’s that Builders keep increasing THEIR prices and getting it. This is especially true in the higher-end when retirement arrives.
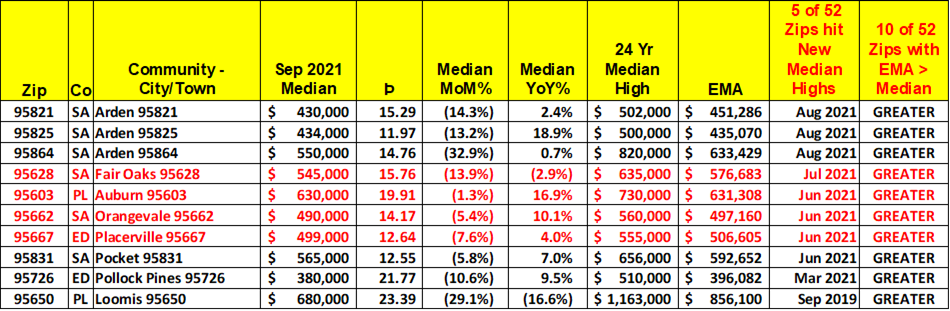
These are the zip codes where the Median Price and its EMA are showing price reductions. Price variability may explain the reversal. Whether the EMA remains above the Median tells us whether the price is going down. In all cases except Auburn, this reversal has only occurred once. And Auburn’s Median Price is fairly volatile. So the trend doesn’t exist yet.[/responsivevoice]
[responsivevoice]
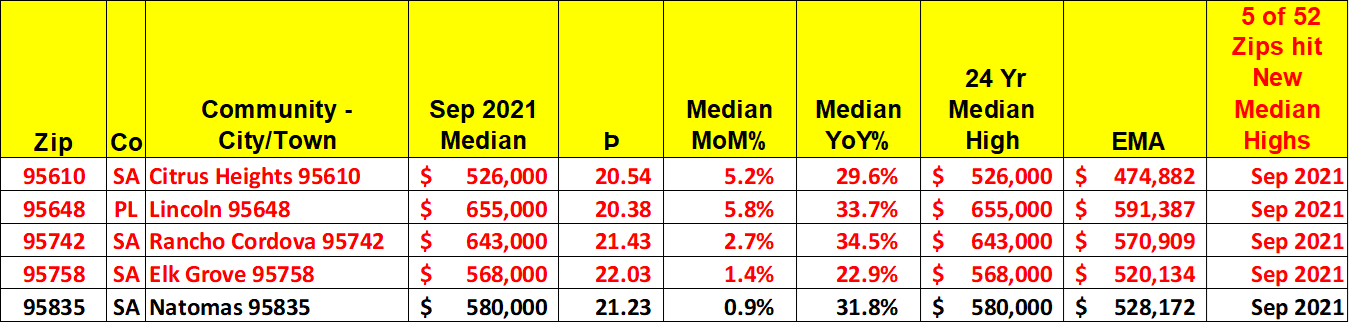
Yet 5 zip codes hit new highs in September. Elk Grove “95758”, Rancho Cordova 95742, Citrus Heights 95610 and Lincoln 95648 have all hit new highs in 10 of the last 18 months. They are not alone in the attainment of new highs. Like the lack of immunity to downswings starting in 2006 and turning upward in 2012, no zip code has been immune to these unprecedented increases [except, I hear, San Francisco].[/responsivevoice]
[responsivevoice]
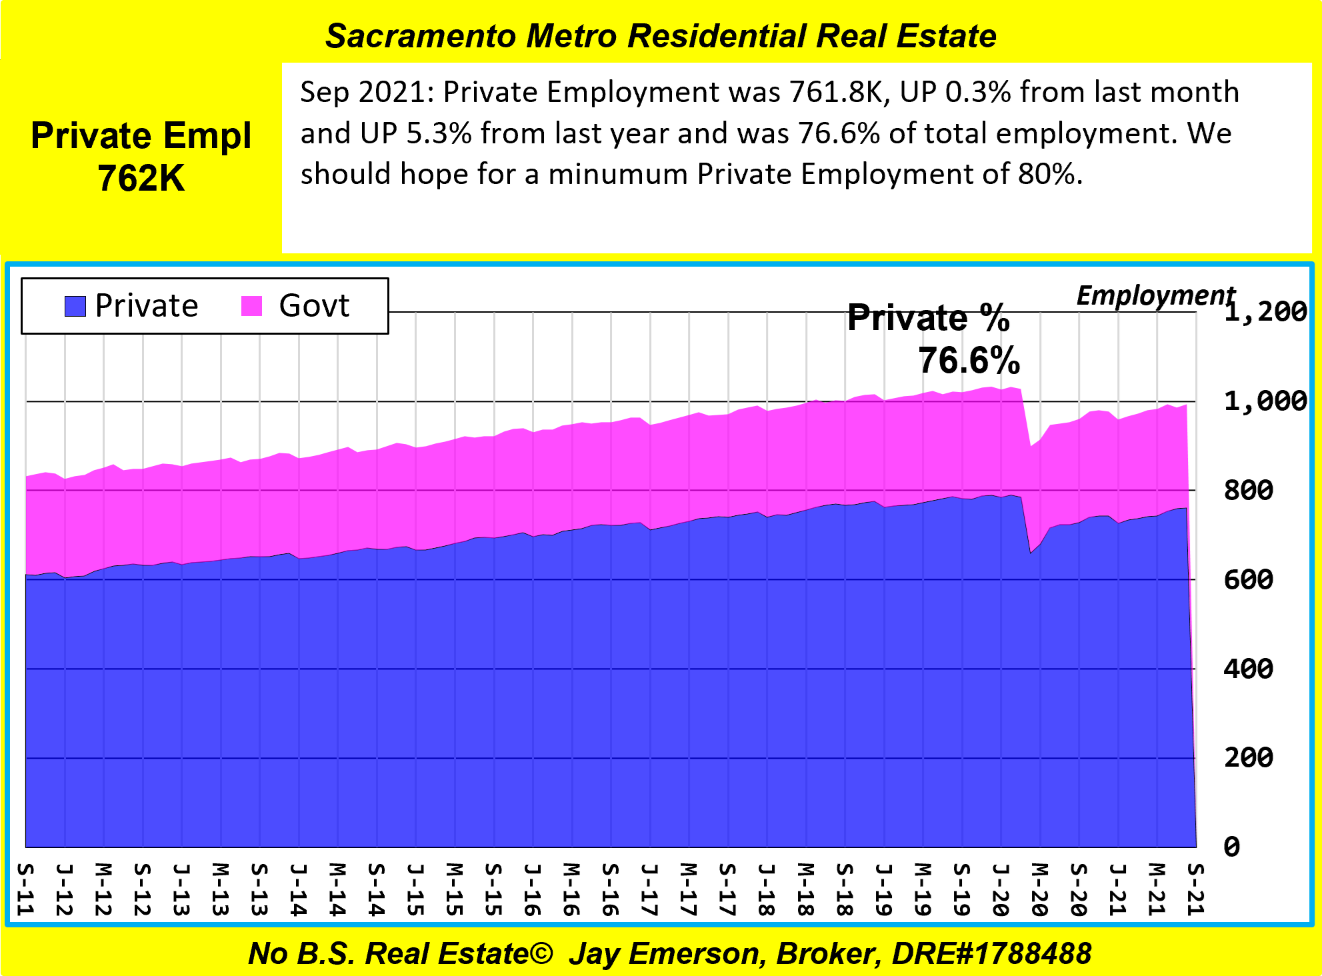
Most disconcerting to me, as stated each month and PERMANENTLY on my website, Private Employment decreased as a percentage of total employment and tax payers (“producers”) pay for each Public Employee. 80% private may be too low to create and sustain a vibrant and solvent economy. Gross Domestic Product doesn’t reflect the Deductions of taxes, government spending, and regulations; all a negative on Gross Product.[/responsivevoice]
Sacramento County zip codes
- Carmichael 95608 – Median $583K, (Þ▲,MoM▼-2.8% ,YoY▲22.0%) – Appetite 126.8% – Turnover 127.6% – Consumption 127.2%
- Citrus Heights 95610 – Median $526K (NEW HIGH) (Þ▲,MoM▲5.2%,YoY▲29.6%) – Appetite 106.5% – Turnover 89.1% – Consumption 99.1%
- Citrus Heights 95621 – Median $450K, (Þ▲,MoM▼-0.7% ,YoY▲20.0%) – Appetite 114.6% – Turnover 316.7% – Consumption 155.0%
- Elk Grove 95624 – Median $621K, (Þ▼,MoM▼-0.6% ,YoY▲23.0%) – Appetite 87.1% – Turnover 114.0% – Consumption 98.3%
- Fair Oaks 95628 – Median $545K, (Þ▼,MoM▼-13.9% ,YoY▼-2.9%) – Appetite 114.5% – Turnover 163.4% – Consumption 135.4%
- Folsom 95630 – Median $685K, (Þ▼,MoM▼-11.6% ,YoY▲12.9%) – Appetite 107.4% – Turnover 127.1% – Consumption 115.7%
- North Highlnds 95660 – Median $370K, (Þ▼,MoM▼-2.6% ,YoY▲15.6%) – Appetite 81.0% – Turnover 150.0% – Consumption 104.7%
- Orangevale 95662 – Median $490K, (Þ▼,MoM▼-5.4% ,YoY▲10.1%) – Appetite 71.2% – Turnover 100.0% – Consumption 83.3%
- Rancho Cordova 95670 – Median $477K, (Þ▼,MoM▼-0.6% ,YoY▲16.1%) – Appetite 120.3% – Turnover 140.0% – Consumption 126.9%
- Rio Linda 95673 – Median $410K, (Þ▲,MoM▼-12.2% ,YoY▲21.7%) – Appetite 73.1% – Turnover 143.8% – Consumption 100.0%
- Rancho Cordova 95742 – Median $643K (NEW HIGH) (Þ▲,MoM▲2.7%,YoY▲34.5%) – Appetite 94.3% – Turnover 162.5% – Consumption 115.7%
- Elk Grove 95757 – Median $675K, (Þ▲,MoM▼-2.2% ,YoY▲25.5%) – Appetite 130.6% – Turnover 216.0% – Consumption 159.5%
- Elk Grove 95758 – Median $568K (NEW HIGH) (Þ▲,MoM▲1.4%,YoY▲22.9%) – Appetite 106.6% – Turnover 206.1% – Consumption 136.7%
- Arden 95815 – Median $351K, (Þ▼,MoM▼-1.7% ,YoY▲15.8%) – Appetite 59.4% – Turnover 74.1% – Consumption 66.1%
- Downtown 95816 – Median $710K, (Þ▼,MoM▼-2.9% ,YoY▲8.9%) – Appetite 136.4% – Turnover 61.9% – Consumption 87.5%
- Oak Park 95817 – Median $503K, (Þ▲,MoM▼-1.8% ,YoY▲24.5%) – Appetite 85.7% – Turnover 129.4% – Consumption 109.7%
- Land Park 95818 – Median $750K, (Þ▲,MoM▲3.4%,YoY▲19.0%) – Appetite 103.4% – Turnover 90.0% – Consumption 96.6%
- East Sacramento 95819 – Median $738K, (Þ▲,MoM▲5.4%,YoY▲12.7%) – Appetite 76.5% – Turnover 62.1% – Consumption 69.8%
- Elder Creek 95820 – Median $390K, (Þ▼,MoM▼-2.7% ,YoY▲21.5%) – Appetite 85.1% – Turnover 83.3% – Consumption 84.2%
- Arden 95821 – Median $430K, (Þ▼,MoM▼-14.3% ,YoY▲2.4%) – Appetite 94.1% – Turnover 103.3% – Consumption 98.4%
- Greenhaven 95822 – Median $425K, (Þ▼,MoM▲3.7%,YoY▲18.1%) – Appetite 134.2% – Turnover 141.2% – Consumption 137.5%
- Franklin 95823 – Median $410K, (Þ▼,MoM▼-2.4% ,YoY▲17.8%) – Appetite 114.0% – Turnover 130.3% – Consumption 120.5%
- Fruitridge 95824 – Median $336K, (Þ▼,MoM▼-4.0% ,YoY▲12.8%) – Appetite 100.0% – Turnover 57.7% – Consumption 79.6%
- Arden 95825 – Median $434K, (Þ▲,MoM▼-13.2% ,YoY▲18.9%) – Appetite 93.8% – Turnover 109.1% – Consumption 100.0%
- College Greens 95826 – Median $450K, (Þ▼,MoM▼-3.2% ,YoY▲16.0%) – Appetite 104.7% – Turnover 139.1% – Consumption 116.7%
- Rosemont 95827 – Median $460K, (Þ▲,MoM▲5.3%,YoY▲21.1%) – Appetite 153.3% – Turnover 150.0% – Consumption 152.0%
- Florin 95828 – Median $433K, (Þ▼,MoM▼-5.7% ,YoY▲18.6%) – Appetite 104.0% – Turnover 93.0% – Consumption 98.9%
- Vineyard 95829 – Median $551K, (Þ▼,MoM▼-3.7% ,YoY▲21.6%) – Appetite 88.4% – Turnover 96.4% – Consumption 91.5%
- Pocket 95831 – Median $565K, (Þ▼,MoM▼-5.8% ,YoY▲7.0%) – Appetite 136.4% – Turnover 152.4% – Consumption 144.2%
- Natomas 95833 – Median $460K (MATCHED HIGH) (Þ▲,MoM▲2.2%,YoY▲21.1%) – Appetite 88.1% – Turnover 190.9% – Consumption 123.4%
- Natomas 95834 – Median $520K, (Þ▲,MoM▼-0.6% ,YoY▲23.8%) – Appetite 87.5% – Turnover 140.0% – Consumption 107.7%
- Natomas 95835 – Median $580K (NEW HIGH) (Þ▲,MoM▲0.9%,YoY▲31.8%) – Appetite 110.5% – Turnover 137.5% – Consumption 121.6%
- Del Paso Heights 95838 – Median $355K, (Þ▲,MoM▼-4.8% ,YoY▲16.4%) – Appetite 95.7% – Turnover 76.7% – Consumption 86.7%
- North Sacramento 95841 – Median $440K, (Þ▼,MoM▲2.3%,YoY▲17.6%) – Appetite 72.7% – Turnover 50.0% – Consumption 61.9%
- Foothill Farms 95842 – Median $423K, (Þ▲,MoM▼-0.5% ,YoY▲23.0%) – Appetite 91.9% – Turnover 142.9% – Consumption 113.8%
- Antelope 95843 – Median $500K (MATCHED HIGH) (Þ▲,MoM▲3.1%,YoY▲25.0%) – Appetite 112.5% – Turnover 165.4% – Consumption 127.8%
- Arden 95864 – Median $550K, (Þ▼,MoM▼-32.9% ,YoY▲0.7%) – Appetite 83.3% – Turnover 82.9% – Consumption 83.1%
El Dorado County zip codes
- Placerville 95667 – Median $499K, (Þ▼,MoM▼-7.6% ,YoY▲4.0%) – Appetite 86.8% – Turnover 59.1% – Consumption 71.2%
- Cameron Pk 95682 – Median $615K, (Þ▼,MoM▲6.0%,YoY▲11.8%) – Appetite 78.1% – Turnover 65.0% – Consumption 73.1%
- Pollock Pines 95726 – Median $380K, (Þ▲,MoM▼-10.6% ,YoY▲9.5%) – Appetite 106.7% – Turnover 59.3% – Consumption 76.2%
- El Dorado Hills 95762 – Median $900K, (Þ▼,MoM▼-5.3% ,YoY▲19.2%) – Appetite 91.1% – Turnover 86.5% – Consumption 88.9%.
Placer County zip codes
- Auburn 95603 – Median $630K, (Þ▼,MoM▼-1.3% ,YoY▲16.9%) – Appetite 93.3% – Turnover 66.3% – Consumption 78.7%
- Lincoln 95648 – Median $655K (NEW HIGH) (Þ▲,MoM▲5.8%,YoY▲33.7%) – Appetite 92.3% – Turnover 117.4% – Consumption 103.0%
- Loomis 95650 – Median $680K, (Þ▼,MoM▼-29.1% ,YoY▼-16.6%) – Appetite 63.3% – Turnover 77.8% – Consumption 70.2%
- Roseville 95661 – Median $670K, (Þ▼,MoM▼-0.7% ,YoY▲9.8%) – Appetite 89.8% – Turnover 78.8% – Consumption 85.4%
- Rocklin 95677 – Median $650K, (Þ▲,MoM▲1.6%,YoY▲20.6%) – Appetite 107.1% – Turnover 145.8% – Consumption 125.0%
- Roseville 95678 – Median $551K, (Þ▲,MoM▲5.4%,YoY▲22.4%) – Appetite 87.2% – Turnover 146.9% – Consumption 111.4%
- Granite Bay 95746 – Median $1,080K, (Þ▼,MoM▲20.0%,YoY▼-2.1%) – Appetite 106.7% – Turnover 134.5% – Consumption 120.3%
- Roseville 95747 – Median $675K, (Þ▲,MoM▲6.0%,YoY▲24.5%) – Appetite 88.1% – Turnover 142.4% – Consumption 110.0%
- Rocklin 95765 – Median $651K, (Þ▼,MoM▼-2.1% ,YoY▲16.3%) – Appetite 125.9% – Turnover 196.2% – Consumption 148.8%
Yolo County zip codes
- West Sac 95605 – Median $445K, (Þ▲,MoM▲23.6%,YoY▲30.5%) – Appetite 75.0% – Turnover 75.0% – Consumption 75.0%
- West Sacramento 95691 – Median $562K, (Þ▲,MoM▲4.1%,YoY▲14.7%) – Appetite 100.0% – Turnover 214.3% – Consumption 139.3%
Please go to https://jayemerson.com/blog/ and subscribe in the right sidebar.
