June 2021 - Supplemental Real Estate Market Update
When 1 or just several Highs are achieved for local zip codes, it is normal. When 23 zip codes and 3 counties “hit” new highs in a given month (May 2021), it is not normal.
Supply and Demand did this.
But there are market forces that influence both Supply and Demand. Curiously, some zip codes are not affected like others even though housing amenities and conditions may be similar.
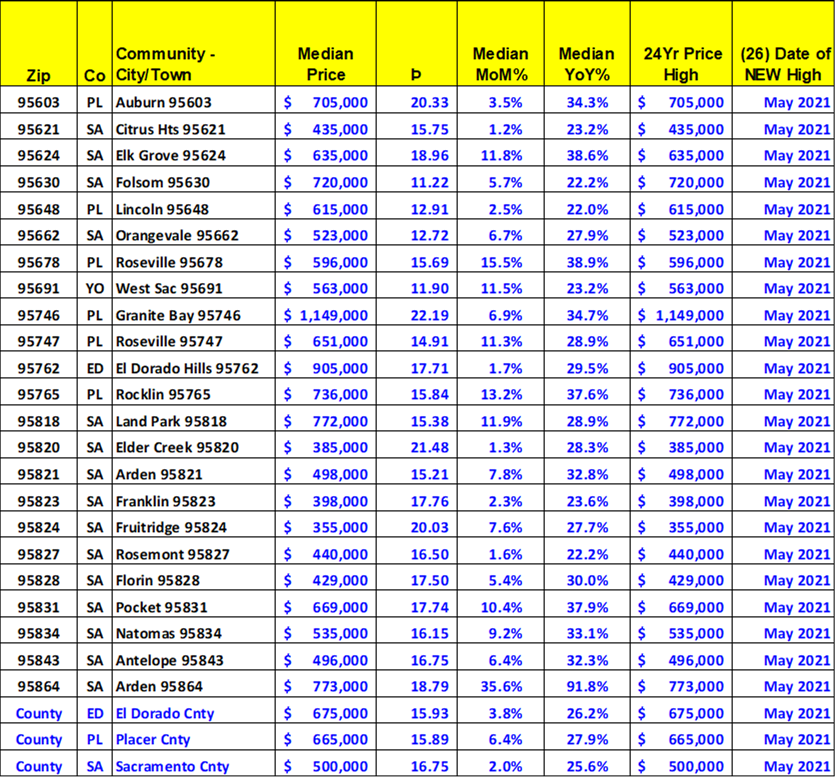
The Highs are shown (26 of them) below. The next graphic shows those zip codes that have NOT reached a new high in many years.
Sacramento Details - High Medians
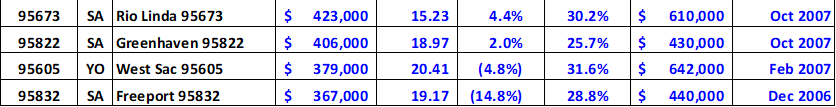
Sacramento Details - No Highs
Zip Code (No Highs) Details
Rio Linda 95673, 05/2021 – Median $423K, (Þ▲,MoM▲4.4%,YoY▲30.2%) – Supply is at 63% – Demand is at 111% – Appetite is at 85% – Turnover is at 129%
Greenhaven 95822, 05/2021 – Median $406K, (Þ▲,MoM▲2.0%,YoY▲25.7%) – Supply is at 71% – Demand is at 105% – Appetite is at 86% – Turnover is at 184%
West Sac 95605, 05/2021 – Median $379K, (Þ▲,MoM▼-4.8% ,YoY▲31.6%) – Supply is at 51% – Demand is at 71% – Appetite is at 100% – Turnover is at 133%
Freeport 95832, 05/2021 – Median $367K, (Þ▼,MoM▼-14.8% ,YoY▲28.8%) – Supply is at 50% – Demand is at 73% – Appetite is at 100% – Turnover is at 67%