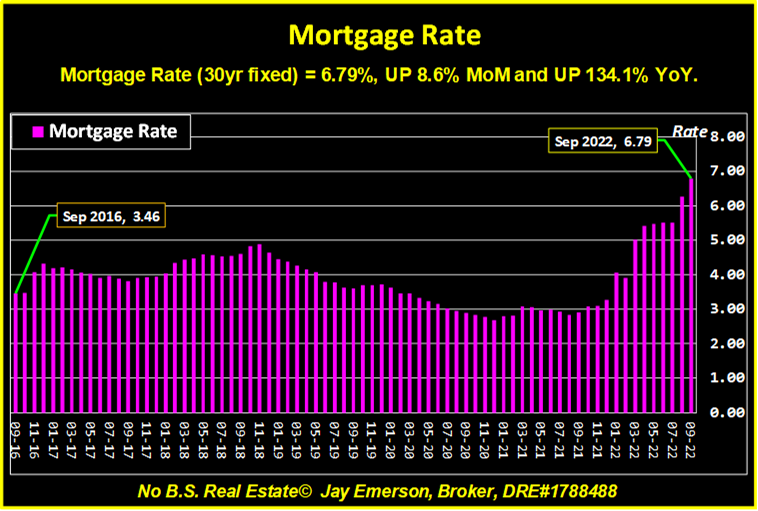
When newly printed money, lots of it, pours into the purchase of anything, while the supply of that item is going down, the price will go up until a “breaking point”. That breaking point is inevitable but can come as a surprise and be done by those who are not a party of the market for that item. The Federal Reserve (not Federal and doesn’t have a Reserve) is not a home buyer or seller but their incompetent actions have produced nothing but chaos. We haven’t had a “free market” in decades but now it’s ludicrous. Rates have been held low for years [for the wrong reason] and now suddenly must be higher AFTER the introduction of trillions of new money. No logic can help me understand their actions [or existence]. By the way, when a bubble loses its pressure, it becomes a vacuum in reverse. (www.JayEmerson.com/major)
Showing Bubbles
There are 2 derivatives I calculate for each Median Price (“price”):
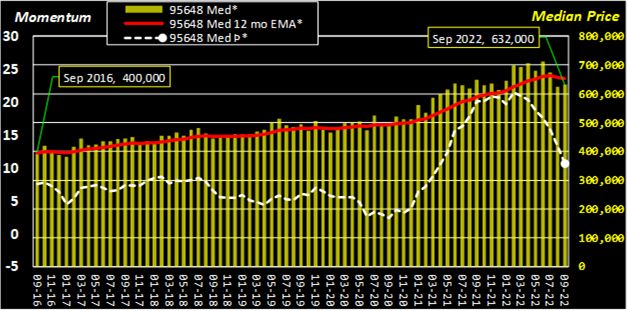
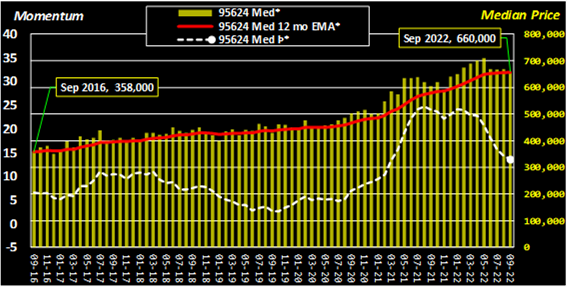
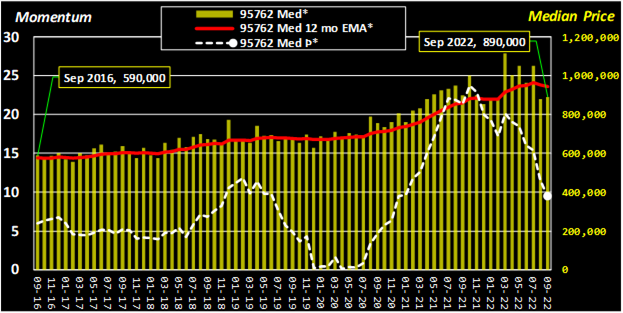
Momentum (Þ) — Momentum is the rate of acceleration of a commodity’s price — that is, the speed and direction at which the price is changing, if at all. Momentum trading is a strategy that seeks to capitalize on momentum to enter a trend as it is picking up [or losing] steam. As Momentum can be positive, zero, or negative, each has its tactical actions if your strategy is using momentum. Momentum can be used to produce profits [and avoid losses]. (www.JayEmerson.com/momentum)
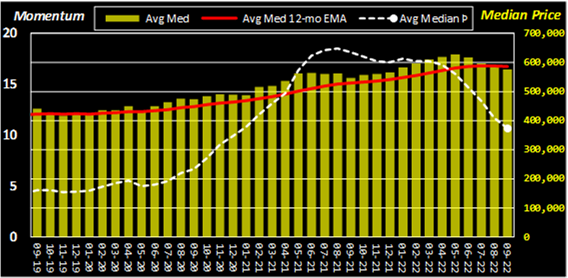
Exponential Moving Average (EMA) — An indicator that shows how the price of an asset changes over a certain period of time. In this system, a 12-month EMA is used.
When prices are rising each month, the EMA is lower (math). Conversely, if prices are declining, the EMA can soon be higher than the price. Likewise, although on a different scale and can be negative, the Momentum of a price change can show reductions while prices are still rising. The Momentum shows that the price is changing more slowly and, hence, Momentum changes before the trend of the price. As the Momentum can make changes obvious before the underlying price shows it, these zip codes depict the extreme outcomes of the recent market. And, as a price appreciates, its EMA is generally less than its underlying price. Most zip codes showed changes to Momentum late last year. The Median Price EMAs are now starting to exceed their prices, indicating a reduction.
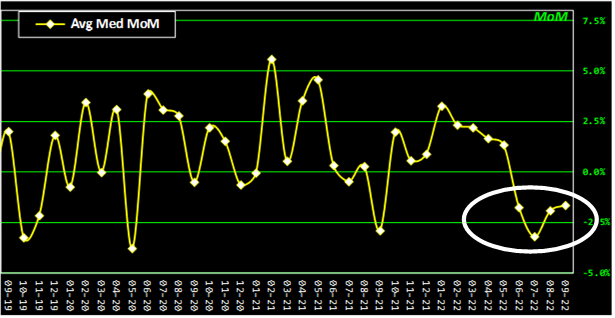
Long a colloquial truth, “two data points make a line; three data points make a trend”, we have seen the trends start in many zip codes. Using the Average Median Price and its change month-over-month, the latest 4 data points are lower than zero. While it’s possible this doesn’t indicate a downward trend in the future, it’s not probable. That is, the Median Price is showing what Momentum has been showing for a year. (www.JayEmerson.com/zip-codes)
Composite Average Median Price
Sep 2022 – Composite Average [Median Price] was $574,981, DOWN 1.7% MoM and UP 5.5% YoY. The last [Median Price] high was $627,173 set in May 2022.
[Median Price] was -1.7% lower than the [12 mo EMA] of $584,987. The gap last month was -0.4%, last year was 3.3%. (www.JayEmerson.com/averages)
Pended Or Not
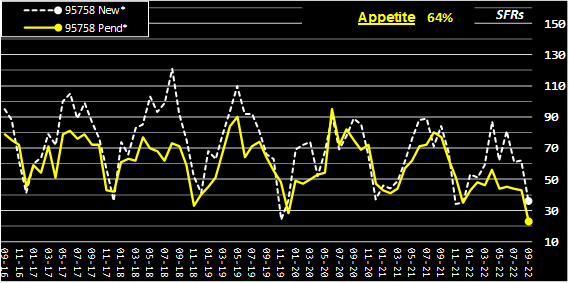
As rates increase and buyers stop, available homes do not go Pending. As transactions are cancelled by buyers, those listings go back as Active. That “Pended” transaction is counted. Therefore, a low Pended count means listings aren’t even getting into their FIRST escrow. In other words, offers aren’t getting accepted or buyers aren’t submitting any.
At the end of each calendar month, our multiple listing service (Metrolist) reports on results of all activity. (They also revise prior months based on new/belated information.) The number of CLOSED sales is used to determine the Median Price of those closed transactions. (Median means half of the closed prices are higher, half are lower.) The Momentum of that price, in reference to the recent year of change, can be up, down, or unchanged (“Whipsaw Indicator”). The result can be positive, zero, or negative. The Averages combine all 52 zip codes tracked in this system.
Summary of Momentum data for Sep 2022:
Avg Þ was 10.66, DOWN 8.8% from last month and DOWN 41.2% from last year.
[Maximum Þ] was 20.33 in Loomis 95650.
[Minimum Þ] was 3.82 in Pollock Pines 95726.
[# of Þ Above Zero] was 52. A price whose momentum is positive is technically in the BUY range.
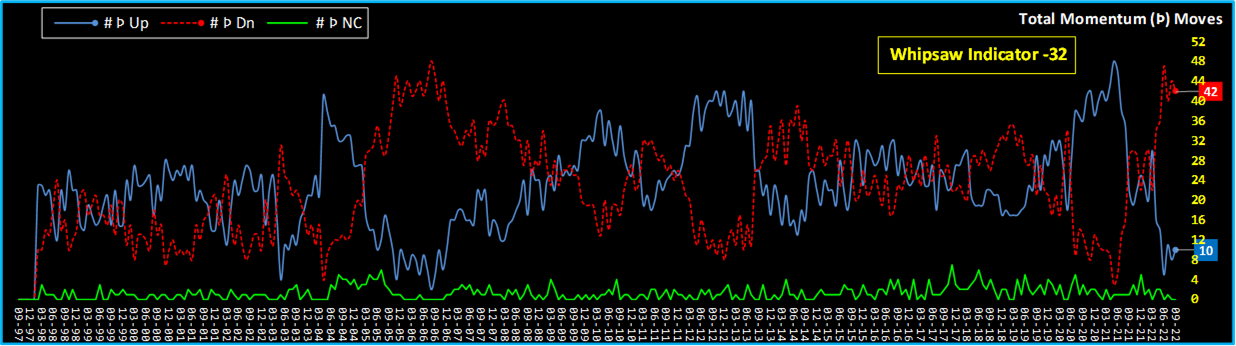
[# of Þ Up] was 10, UP 25.0% from last month and DOWN 54.5% from last year. [# of Momenta Down] was 42, DOWN 4.5% from last month and UP 44.8% from last year.
[# of Þ Down] was 42, DOWN 4.5% from last month and UP 44.8% from last year.
[Whipsaw Indicator] was -32, DOWN 11.1% from last month and DOWN 557.1% from last year. This is the result of subtracting 42 [# of Þ Down] from 10 [# of Þ Up] and depicts swings in market behavior.
[Þ Spread] was 16.51 and [Running Þ Spread (12 mo.)] was 17.72. Spread depicts the variance between Maximum and Minimum Þfor the month and, hence, the disparity of price changes and depth of market swings.
The whipsaw from up to down markets has been dramatic of late. This EKG-like chart shows the breadth of up, down, and “quiet” markets. Time even heels these wounds. The Spread shows the depths of the market while Whipsaw shows breadth.
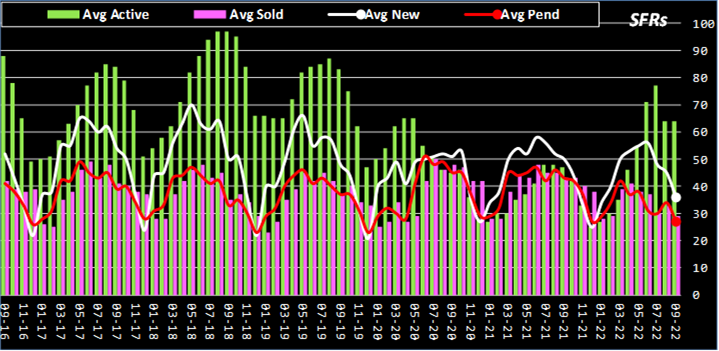
The Inventory Story
Sep 2022 – Composite Average
SUPPLY = [New] + [Active] listings was 100, 80% of its [10yr Sep Avg]. [New] listings was 36, DOWN 28.0% YoY, and is 75% of its [10yr Sep Avg], favoring SELLERS. [Active] listings was 64, UP 36.2% YoY, and is 83% of its [10yr Sep Avg], favoring SELLERS.
DEMAND = [Pended] + [Sold] listings was 56, 77% of its [10yr Sep Avg]. [Pended] listings was 27, DOWN 37.2% YoY, and is 75% of its [10yr Sep Avg], favoring BUYERS. [Sold] listings was 29, DOWN 32.6% YoY, and is 78% of its [10yr Sep Avg], favoring BUYERS.
Consumption of listings was 56% – ([DEMAND]/[SUPPLY]) or 56/100 – the [10yr Sep Avg] is 60%. Appetite for listings was 75% – [Pended]/[New] or 27/36 – the [10yr Sep Avg] is 75%. Turnover of listings was 45% – [Sold]/[Active] or 29/64 – the [10yr Sep Avg] is 53%. (www.JayEmerson.com/averages)
ALL INVENTORY Showing all inventory “stages” in one chart can hide trends in any one data point. In short, a listing can be NEW, PENDED, ACTIVE, and SOLD in 1 month (rare). But also rare in this market is escrow failure (PENDING becoming ACTIVE again).
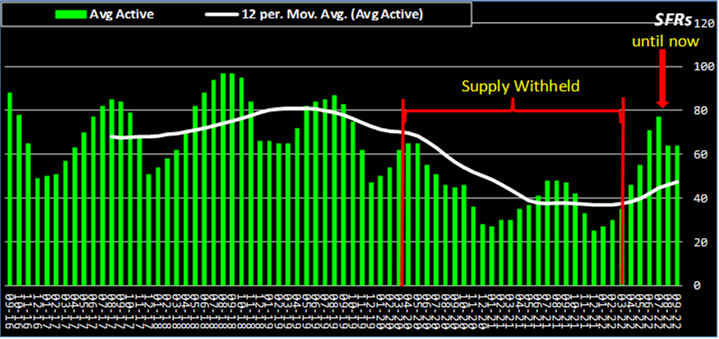
ACTIVE INVENTORY Showing each data element with its trend makes changes more obvious. This trend line is showing the drastic reduction in inventory that boosted the price appreciation in the last 2 years.
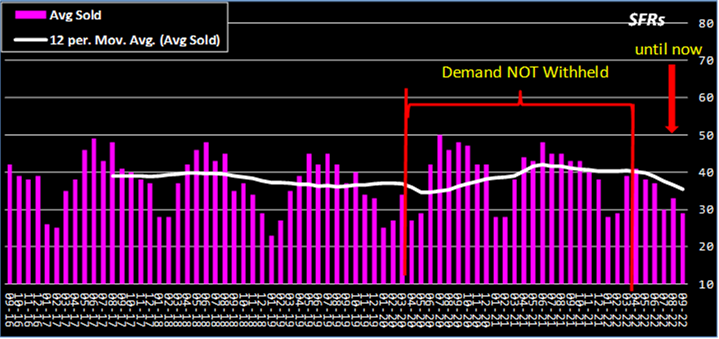
SOLD INVENTORY When a listing is SOLD (new owner), it cannot go back to PENDING or ACTIVE.
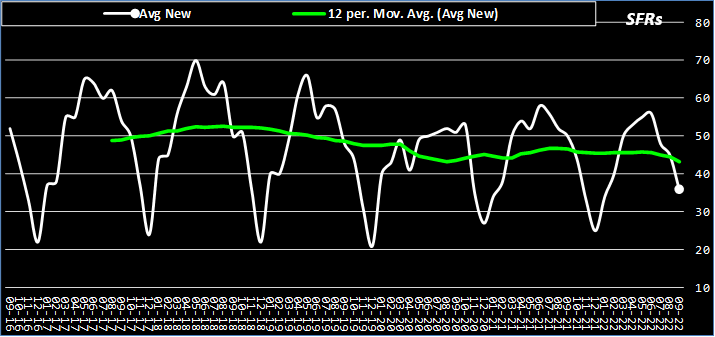
NEW INVENTORY When a seller puts their house on the market, it is a NEW listing (ACTIVE, technically). If no sellers list their houses and, yet, there are SOLD listings, the diminishing supply puts upward pressure on prices. Although the trend line is lower in the recent years, it in no way compares to the reduction of ACTIVE listings.
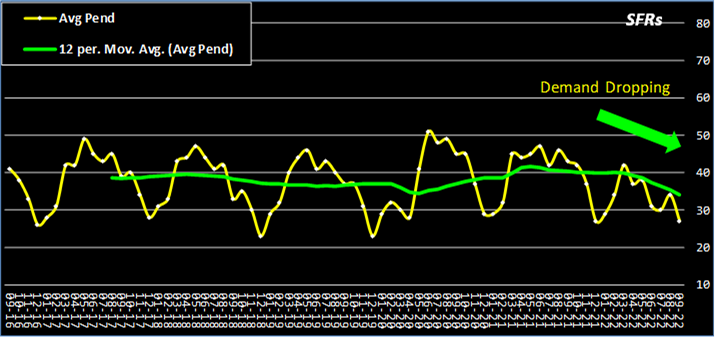
PENDED INVENTORY When a seller and buyer reach agreement on the buyer’s offer, the listing becomes PENDING. Whether that buyer performs per their contractual promises or not, that listing is counted as a PENDED listing. In short, a listing can be NEW, PENDED, ACTIVE, and SOLD in 1 month (rare).
Based on interest rate movement, supply and demand, sentiment and confidence, my expected “pipeline”, and geo-political events, prices will continue coming down.
Unless there is a drastic change, prices will come down, supply will increase. Some of this will be attributed to the seasonal “slow-down”. What I can’t see is how much prices will drop and where is the next “bottom”. As I am advising my sellers, if you get an offer, the bird in the hand is worth more than 3 in the bush. And price for tomorrow, not last month. For my buyers, I advise that sellers will be reducing their prices EVEN THOUGH they will 1) have a choice to cancel their listing, and 2) reduce more slowly than desired.
I would love to know your thoughts. By the way, I’m never too busy for your referrals.