County Lean Score Update
Is it a Seller’s market? Are we seeing cracks?
Lean Score, explained
Real estate data shows us monthly activity for NEW, ACTIVE, PENDED/PENDING, CANCELED/EXPIRED, and SOLD listings. This activity is the actual supply and demand for houses. NEW and ACTIVE represent supply and PEND and SOLD represent demand. (CANCELED and EXPIRED represent a failed attempt that may return). Listing activity has long indicated market leanings. In fact, the famous “Months of Inventory” has long been an indicator used by clients and professionals. (How many months would it take to sell the currently active inventory based on the previous sales rate). This month’s SOLD activity takes a certain amount of time (days) and renders a MEDIAN price. These results are shown as they frequently depict underlying market leanings that are not explained by the listing activity.
My Lean Score is a representation of seven data elements [chosen because they aren’t derivatives of any other]. Each item is compared to its short and long-term averages to calculate the variances, combine them, and pad them to make them larger (for charting purposes).
- NEW – entered as a listing during this calendar month
- ACTIVE – currently available in MLS
- PENDED – went pending during this calendar month
- SOLD – sold during this calendar month
- CANC – canceled or expired during this calendar month
- CDOM – cumulative days on market – the total number of days a listing is available before selling
- MEDIAN – the median price of the sold listings
NOTE: a [PENDED] listing may have [SOLD], maybe back to [ACTIVE].
NOTE: only [NEW] listings increase the supply of inventory
Sacramento County Lean Score
April 30th, 2024
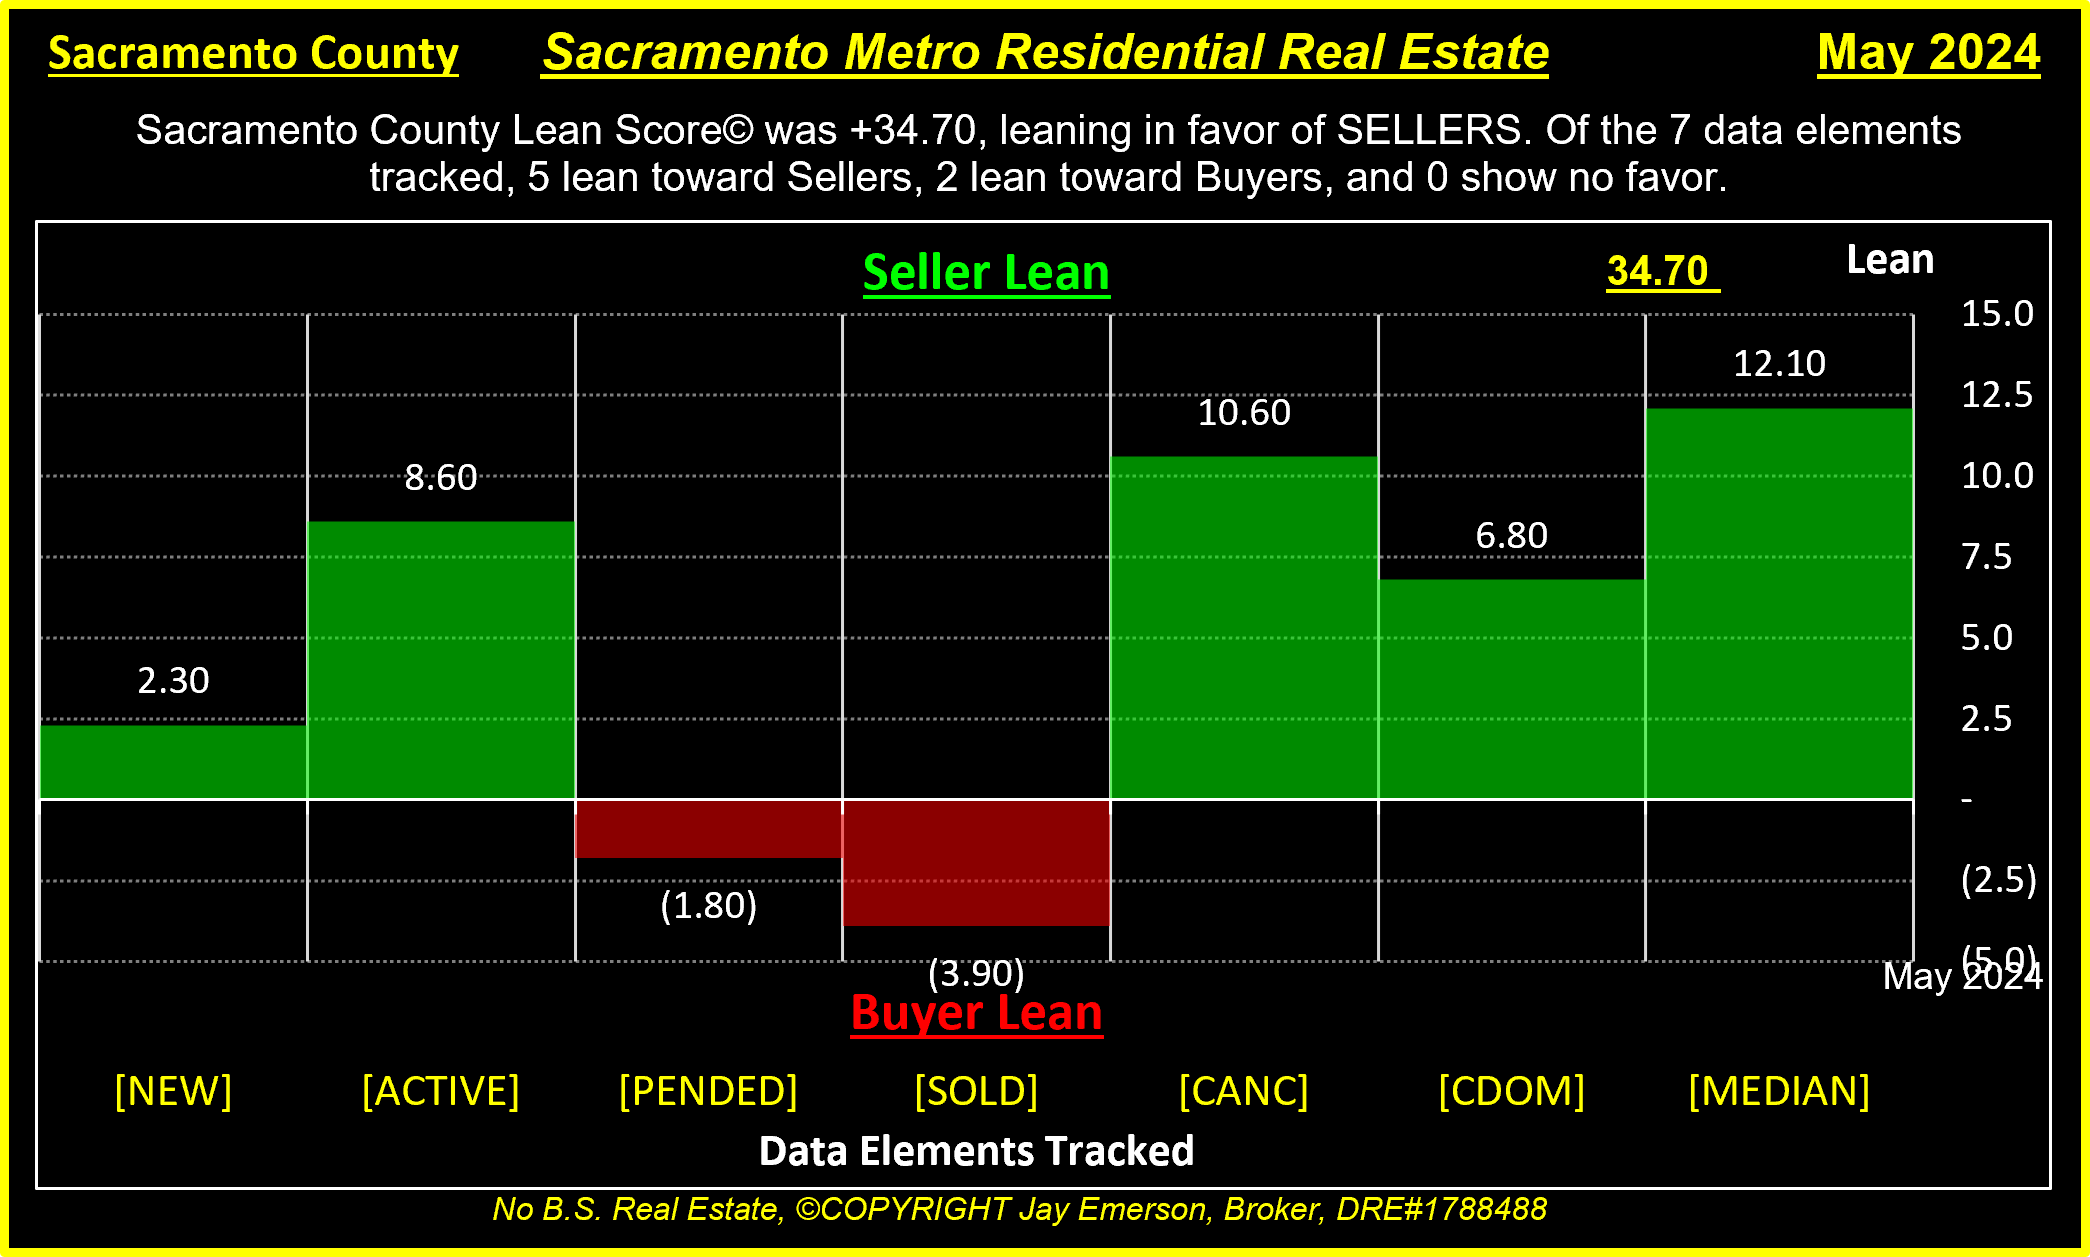
April 2024 was a SELLERS market in Sacramento County.
► Months of inventory was 1.5, which is 47.6% higher than last year.
► The number of [NEW] listings = 1,317, +6% MoM, +22% YoY. Which is 71% of its [10yr Apr Avg] of 1,860. Last high was 2,558 in May 2018. Last low was 507 in Dec 2023.
♦ LEAN: 81% of its 10 Year Avg (1,621) ┼ 75% of its 26 Year Avg (1,756) ≡ Lean Score is +4.40, leaning toward SELLERS
► The number of [ACTIVE] listings = 1,231, +14% MoM, +48% YoY. Which is 60% of its [10yr Apr Avg] of 2,060. Last high was 3,680 in Aug 2014. Last low was 753 in Mar 2023.
♦ LEAN: 58% of its 10 Year Avg (2,119) ┼ 40% of its 26 Year Avg (3,095) ≡ Lean Score is +10.20, leaning toward SELLERS
► The number of [PENDED] listings = 1,008, +8% MoM, +10% YoY. Which is 73% of its [10yr Apr Avg] of 1,377. Last high was 1,755 in May 2017. Last low was 593 in Dec 2022.
♦ LEAN: 80% of its 10 Year Avg (1,265) ┼ 88% of its 26 Year Avg (1,150) ≡ Lean Score is -3.20, leaning toward BUYERS
► The number of [SOLD] listings = 822, +2% MoM, +0% YoY. Which is 62% of its [10yr Apr Avg] of 1,328. Last high was 1,742 in Jun 2017. Last low was 550 in Jan 2023.
♦ LEAN: 65% of its 10 Year Avg (1,266) ┼ 73% of its 26 Year Avg (1,131) ≡ Lean Score is -6.20, leaning toward BUYERS
► The number of [CANC] listings = 163, +15% MoM, +39% YoY. Which is 61% of its [10yr Apr Avg] of 269. Last high was 727 in Oct 2014. Last low was 111 in Jan 2022.
♦ LEAN: 48% of its 10 Year Avg (343) ┼ 26% of its 26 Year Avg (623) ≡ Lean Score is +12.60, leaning toward SELLERS
► [CDOM] = 20 days, -31% MoM, -49% YoY. Last high was 56 in Jan 2015.
♦ LEAN: 67% of its 10 Year Avg (30) ┼ 47% of its 26 Year Avg (42) ≡ Lean Score is +8.60, leaning toward SELLERS
► [MEDIAN] = $550,000, 0% MoM, +7% YoY. Last high [MEDIAN] was $575,000 in May ’22.
♦ LEAN: 136% of its 10 Year Avg (403,017) ┼ 181% of its 26 Year Avg (304,186) ≡ Lean Score is +11.70, leaning toward SELLERS
► [#Offers] = 3,047, +26% MoM, -2% YoY. Avg 3.7. Which is 74% of its [10yr Apr Avg] of 4,112. Last high was average 6.2 offers per SOLD in Apr 2021.
Lean Score© was 38.10, leaning in favor of SELLERS. Of the 7 data elements tracked, 5 lean toward Sellers, 2 lean toward Buyers, and 0 show no favor.
El Dorado County Lean Score
April 30th, 2024
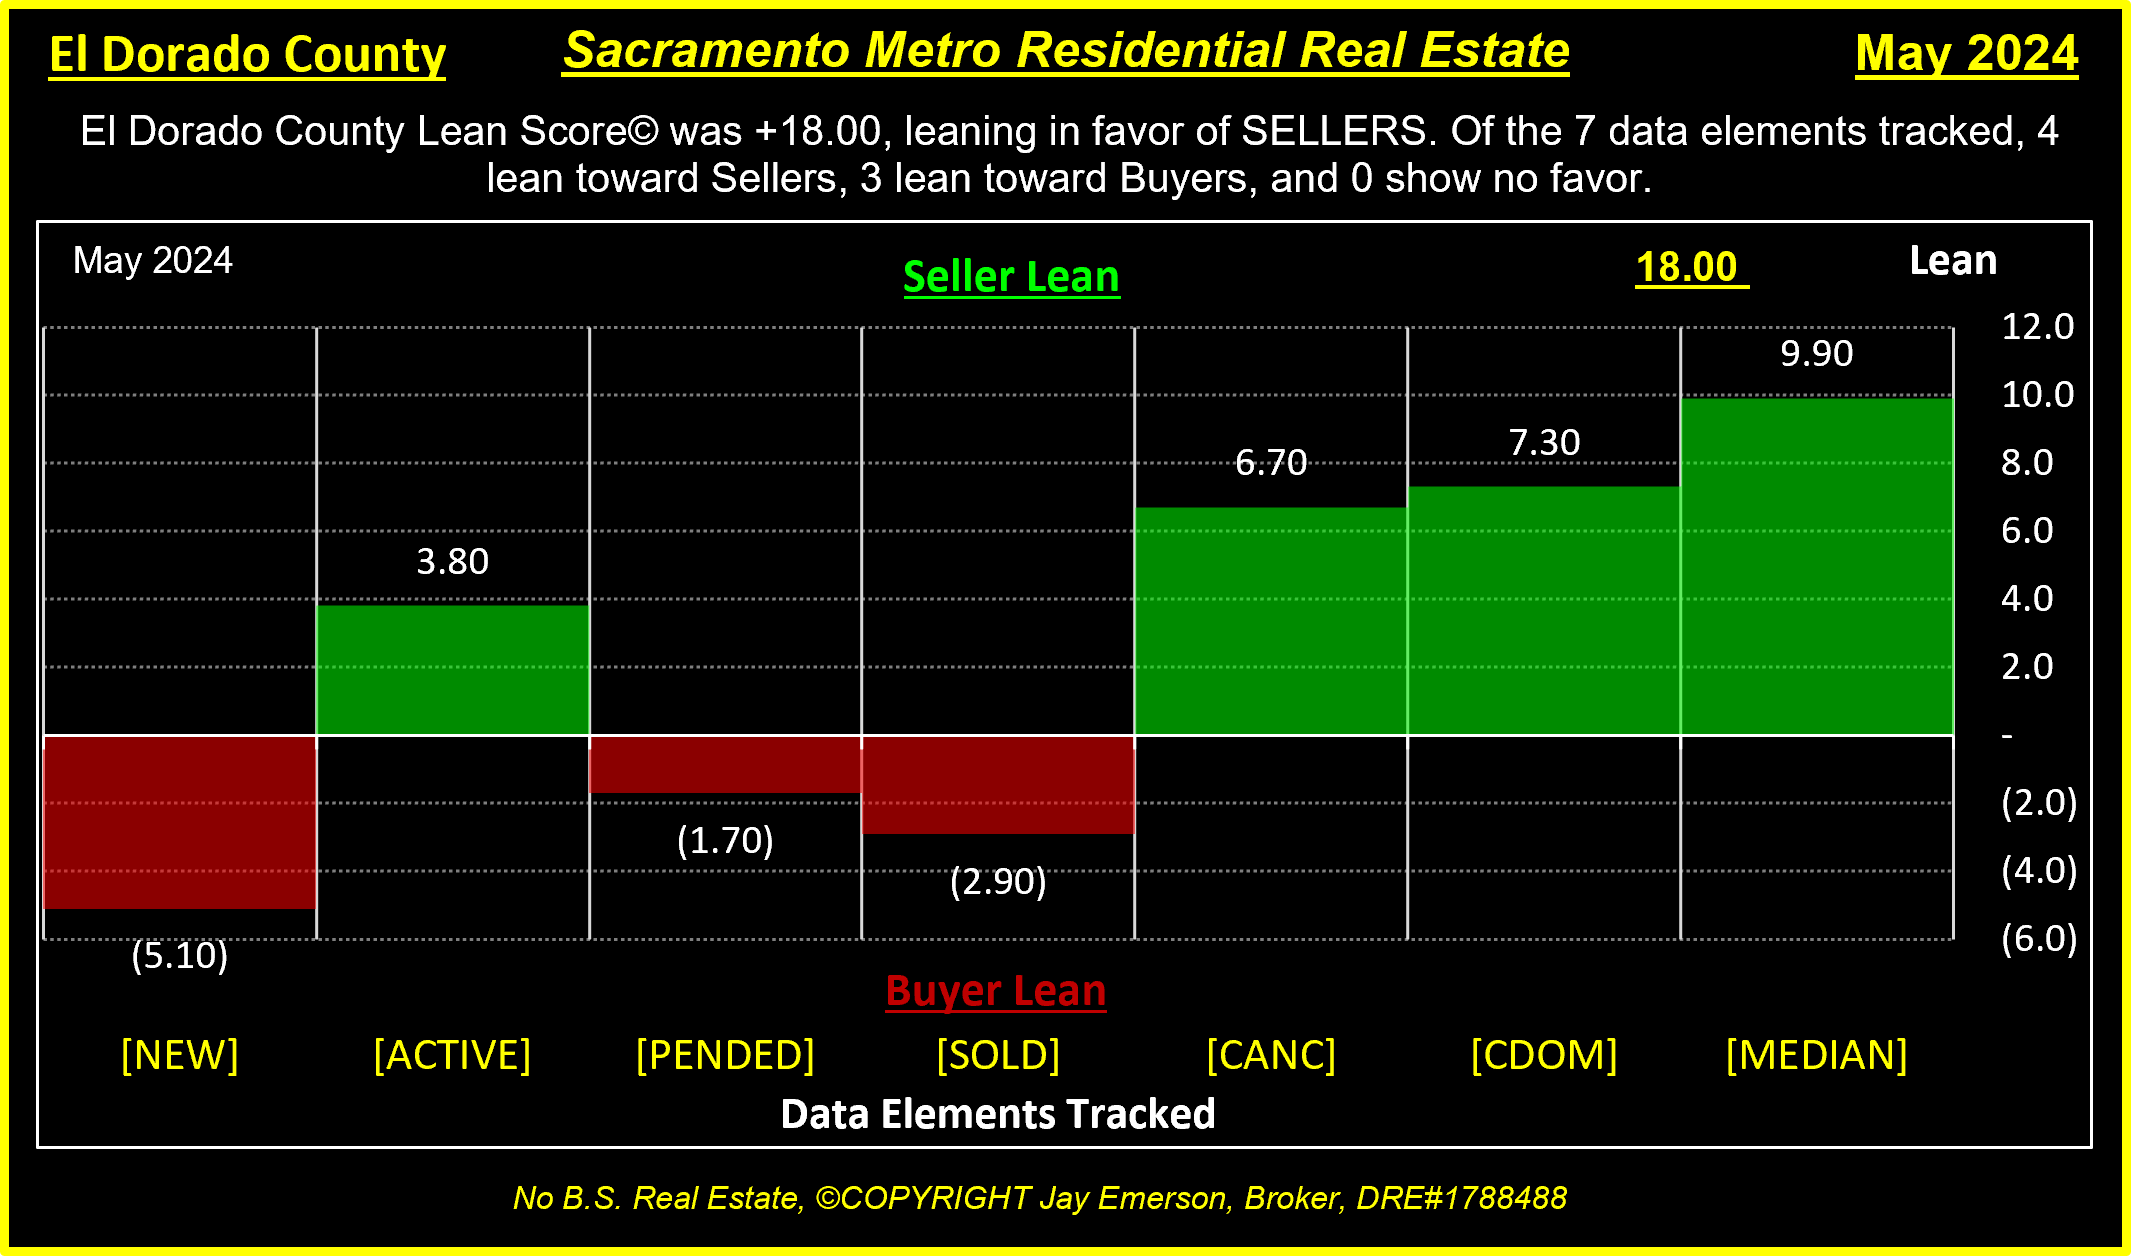
April 2024 was a SELLERS market in El Dorado County.
► Months of inventory was 2.4, which is 25.0% higher than last year.
► The number of [NEW] listings = 290, +19% MoM, +15% YoY. Which is 76% of its [10yr Apr Avg] of 381. Last high was 508 in May 2019. Last low was 83 in Dec 2023.
♦ LEAN: 99% of its 10 Year Avg (294) ┼ 101% of its 26 Year Avg (287) ≡ Lean Score is .00, leaning toward Nobody
► The number of [ACTIVE] listings = 419, +14% MoM, +44% YoY. Which is 65% of its [10yr Apr Avg] of 641. Last high was 1,091 in Jun 2019. Last low was 231 in Dec 2021.
♦ LEAN: 68% of its 10 Year Avg (616) ┼ 54% of its 26 Year Avg (771) ≡ Lean Score is +7.80, leaning toward SELLERS
► The number of [PENDED] listings = 173, +4% MoM, +1% YoY. Which is 76% of its [10yr Apr Avg] of 227. Last high was 390 in Jun 2020. Last low was 75 in Dec 2022.
♦ LEAN: 83% of its 10 Year Avg (208) ┼ 100% of its 26 Year Avg (173) ≡ Lean Score is -1.70, leaning toward BUYERS
► The number of [SOLD] listings = 178, +31% MoM, +16% YoY. Which is 82% of its [10yr Apr Avg] of 216. Last high was 378 in Sep 2020. Last low was 74 in Jan 2023.
♦ LEAN: 86% of its 10 Year Avg (208) ┼ 104% of its 26 Year Avg (171) ≡ Lean Score is -1.00, leaning toward BUYERS
► The number of [CANC] listings = 52, +44% MoM, +63% YoY. Which is 97% of its [10yr Apr Avg] of 53. Last high was 166 in Oct 2019. Last low was 21 in Jan 2022.
♦ LEAN: 65% of its 10 Year Avg (79) ┼ 63% of its 26 Year Avg (83) ≡ Lean Score is +7.20, leaning toward SELLERS
► [CDOM] = 43 days, -14% MoM, -12% YoY, 89% of its [10yr Apr Avg] of 48. = 43 days, -14% MoM, -12% YoY. Last high was 189 in Feb 2011. Last low was 16 in May 2021.
♦ LEAN: 83% of its 10 Year Avg (52) ┼ 61% of its 26 Year Avg (71) ≡ Lean Score is +5.60, leaning toward SELLERS
► [MEDIAN] = $758,000 (NEW HIGH), +16% MoM, +5% YoY. Last high [MEDIAN] was $758,000 in Apr ’24.
♦ LEAN: 144% of its 10 Year Avg (527,878) ┼ 181% of its 26 Year Avg (417,785) ≡ Lean Score is +12.50, leaning toward SELLERS
► [#Offers] = 308, +23% MoM, +4% YoY. 1.7 Which is 79% of its [10yr Apr Avg] of 389. Last high was 3.6 in Mar 2021.
► [MEDIAN Þ] = 5.1, above zero, a BUY signal. Last high was 19 in Jun ’21.
Lean Score© was +30.40, leaning in favor of SELLERS. Of the 7 data elements tracked, 4 lean toward Sellers, 2 lean toward Buyers, and 1 shows no favor.
Placer County Lean Score
April 30th, 2024
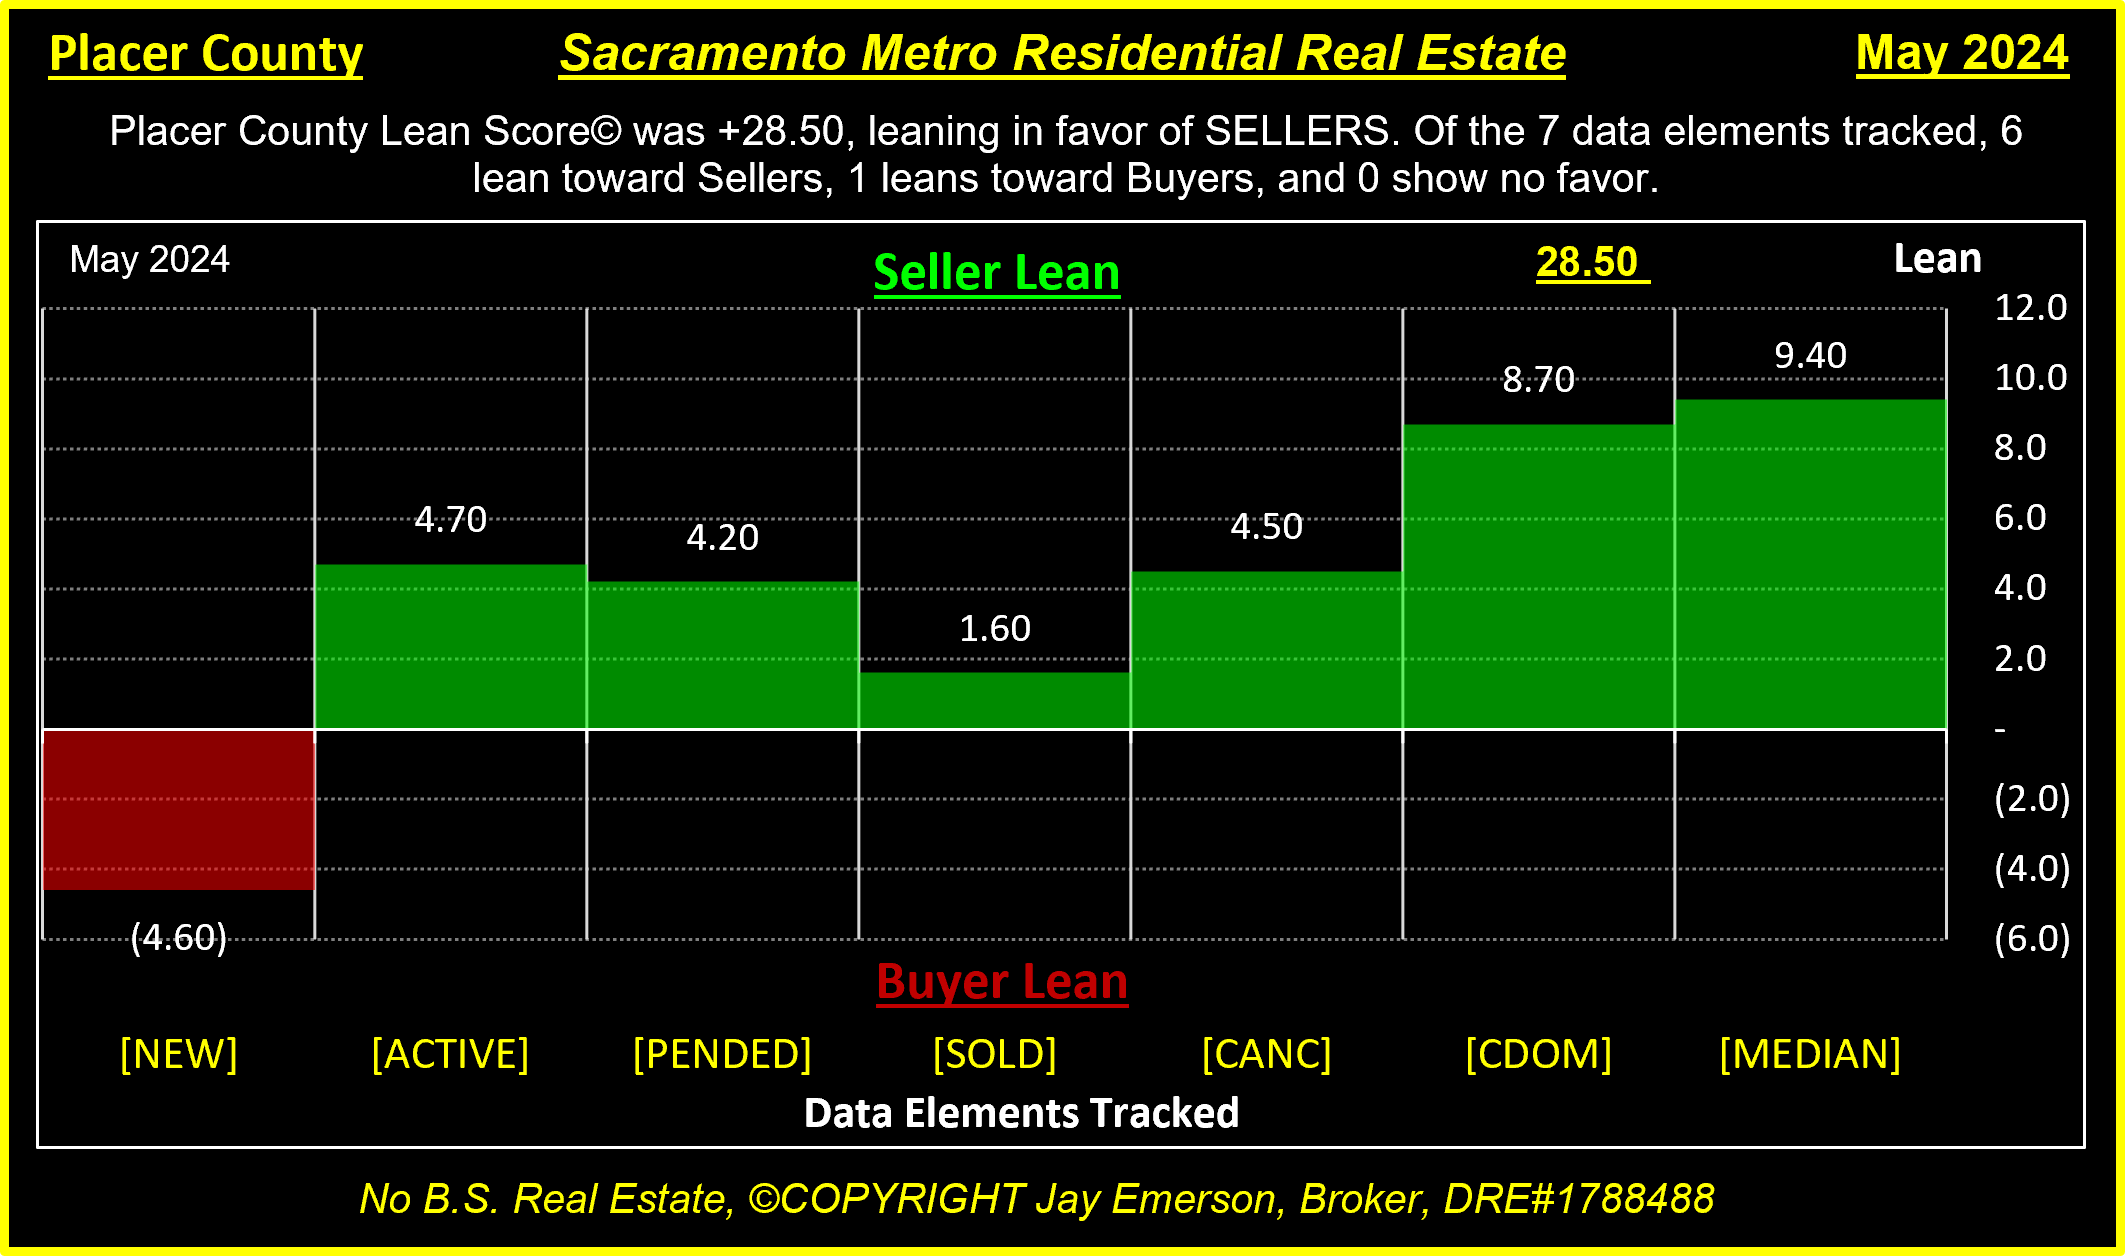
April 2024 was a SELLERS market in Placer County.
► Months of inventory was 1.7, which is 4.7% higher than last year.
► The number of [NEW] listings = 696, +25% MoM, +33% YoY. Which is 90% of its [10yr Apr Avg] of 771. Last high was 927 in May 2019. Last low was 207 in Dec 2023.
♦ LEAN: 114% of its 10 Year Avg (610) ┼ 118% of its 26 Year Avg (589) ≡ Lean Score is -3.20, leaning toward BUYERS
► The number of [ACTIVE] listings = 704, +23% MoM, +32% YoY. Which is 72% of its [10yr Apr Avg] of 980. Last high was 1,587 in Jul 2014. Last low was 354 in Dec 2021.
♦ LEAN: 74% of its 10 Year Avg (955) ┼ 59% of its 26 Year Avg (1,192) ≡ Lean Score is +6.70, leaning toward SELLERS
► The number of [PENDED] listings = 485, +16% MoM, +7% YoY. Which is 89% of its [10yr Apr Avg] of 543. Last high was 735 in Jul 2020. Last low was 239 in Dec 2023.
♦ LEAN: 103% of its 10 Year Avg (471) ┼ 128% of its 26 Year Avg (380) ≡ Lean Score is +3.10, leaning toward SELLERS
► The number of [SOLD] listings = 420, +19% MoM, +26% YoY. Which is 86% of its [10yr Apr Avg] of 491. Last high was 716 in Jul 2020. Last low was 212 in Jan 2023.
♦ LEAN: 89% of its 10 Year Avg (470) ┼ 112% of its 26 Year Avg (375) ≡ Lean Score is +.10, leaning toward SELLERS
► The number of [CANC] listings = 76, +23% MoM, -4% YoY. Which is 78% of its [10yr Apr Avg] of 97. Last high was 252 in Sep 2014. Last low was 36 in Feb 2022.
♦ LEAN: 59% of its 10 Year Avg (129) ┼ 60% of its 26 Year Avg (127) ≡ Lean Score is +8.10, leaning toward SELLERS
► [CDOM] = 43 days, -14% MoM, -12% YoY, 89% of its [10yr Apr Avg] of 48. = 34 days, -19% MoM, -17% YoY. Last high was 66 in Jan 2015. Last low was 12 in Apr 2021.
♦ LEAN: 88% of its 10 Year Avg (39) ┼ 65% of its 26 Year Avg (52) ≡ Lean Score is +4.70, leaning toward SELLERS
► [MEDIAN] = $677,000, +3% MoM, +3% YoY. Last high [MEDIAN] was $738,000 in May ’22.
♦ LEAN: 131% of its 10 Year Avg (517,591) ┼ 165% of its 26 Year Avg (410,911) ≡ Lean Score is +9.60, leaning toward SELLERS
► [#Offers] = 979, +43% MoM, +29% YoY. 2.3 Which is 93% of its [10yr Apr Avg] of 1,053. Last high was 5.4 in Jul 2021.
► [MEDIAN Þ] = 1.3, above zero, a BUY signal. Last high was 18 in Sep ’21.
Lean Score© was +29.10, leaning in favor of SELLERS. Of the 7 data elements tracked, 6 lean toward Sellers, 1 leans toward Buyers, and 0 show no favor.
Jay Emerson, Broker Masters Club – Outstanding Life Member – DRE#1788488 |