Preliminary July and 2022 Data
General Status Descriptions
When a listing is put on MLS, it is “ACTIVE” with a qualifier of “NEW” for the first 2-5 days. When a seller and buyer come to agreement, the listing becomes “PENDING”. If the escrow/contract is successfully closed, the listing is marked as “SOLD”. That single listing is shown in the data as one NEW listing, one SOLD listing and one PENDED listing (it went PENDING during the month). As you may know, PENDING typically takes 30 days so NEW/ACTIVE/PENDED this month “should” be one SOLD next month and is not an ACTIVE listing this month.
If that escrow/contract is NOT successful and fails for any reason, the seller places the ACTIVE listing back on the market. If it stays ACTIVE through the end of the month, that listing is tallied as one ACTIVE and one PENDED listing.
For this reason, I think of NEW and PENDED as “cashflow” statuses and SOLD and ACTIVE as “balance sheet” statuses. That is, a “cashflow” perspective shows what happened to a listing (capital, in accounting) during a month. And a “balance sheet” status is how the tally ends the month.
Forecasting With Math
Reporting for a particular month is not helpful to my clients NEXT month [unless trends are unmistakable]. When MLS tells me about a data point during the month, it is as good as the listing agents’ timely entry of that data. For this reason, it is important for YOU to know that the MLS data is “as good as it gets”.
When I grab data during the month, like these tables below, we have to understand that humans err and the data is probably how some errors are manifested.
For example: (shown on my home page)
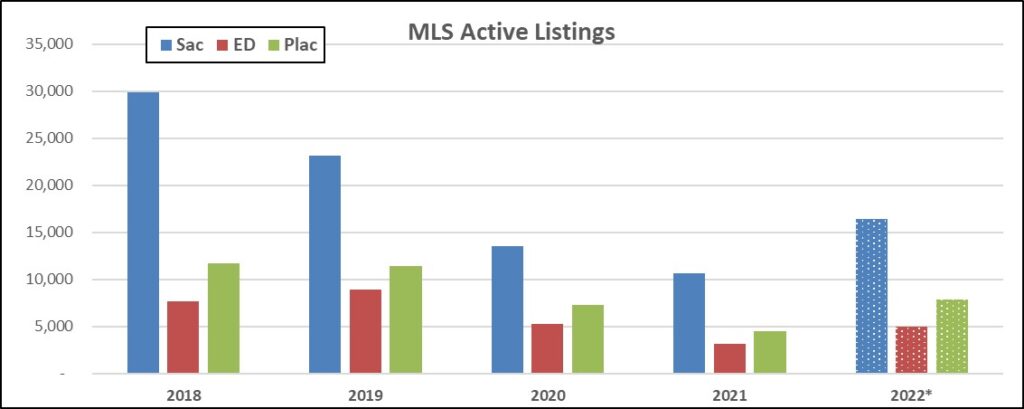
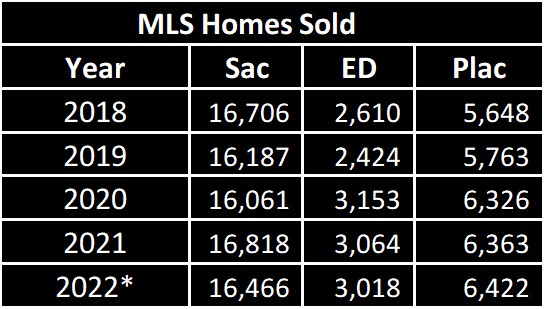
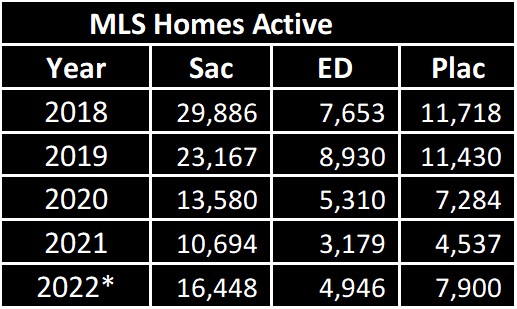
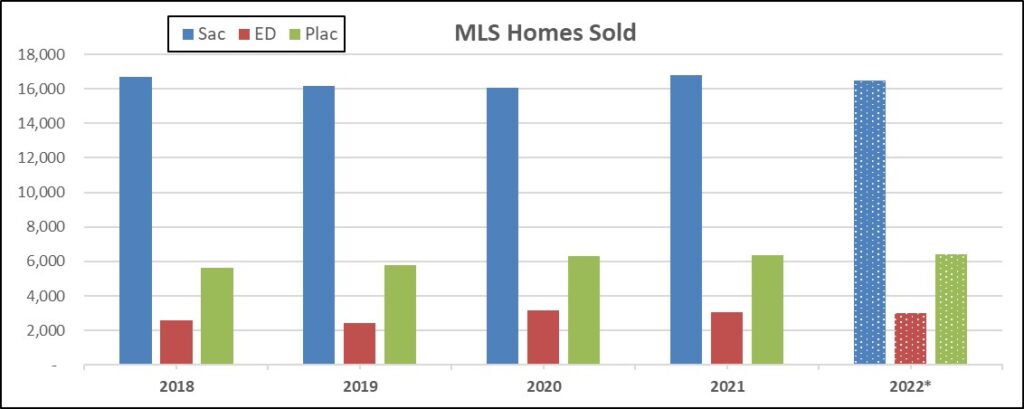
Annually, since 2022 is only half over, the cumulative data is doubled to project 2022 final tallies – marked with an asterisk (2022*).
As you can see, doubling the tallies for the first half of 2022 doesn’t result in an increase in SOLD.

Likewise, ACTIVE listings, when doubled to predict the latter half of 2022, don’t show a “return” to normal. In fact, patterns have been shattered and there is no way to know if patterns will return to what we understand. Selling and buying a home takes patience and fortitude. Understanding the market is necessary to avoid the stress of selling and buying. Can your broker show you data like this?
I’m never too busy for your referrals and I can connect you or your friends and family with excellent agents throughout the country. Please don’t hesitate to reach out if I can help in any way.
Recent Posts
Please subscribe to my blog: https://jayemerson.com/blog/
Market Menu
Overview – Major – Financing – Averages – Momentum – Counties
Zip Codes Charted
Fair Oaks – Folsom – Roseville – Orangevale – El Dorado Hills – Carmichael – Citrus Heights – Elk Grove – Placerville – Auburn – Lincoln – Rocklin – Rancho Cordova


