No Secrets
It’s no secret that we are in an abnormal market. It’s no secret that buyers are now priced out of most homes. It’s no secret that sellers may have missed the “peak”. It’s no secret that gasoline is WAY more expensive than 2 years ago. It’s no secret that a fast-food burger is WAY more expensive. It’s no secret that the USA was a “net exporter” of energy just two years ago. It’s no secret that sellers are waiting longer for showings, offers, and closings. It’s no secret that buyers now wonder how long they should wait for “the bottom”. It’s no secret that sellers want to sell before “the bottom”. It’s no secret that “the bottom” will only be evident after it happens.
What ARE secrets, and I’m exposing them here,
- there is evidence that our local market was heading toward ‘uneventful and down’ in late 2019,
- abnormal markets create a Whipsaw of supply/demand gluts (supply glut when rates were low, demand glut now that rates are high),
- lenders make money by lending money to buyers and, with no buyers, lenders are going broke,
- builders create value on blank dirt but, without buyers for new construction, that value is being destroyed,
- a solar system on lease, without the seller passing on their original subsidy, is a liability to buyers (it’s math).
- of the 52 zip codes I track,
- 78% have a moving average that exceeds its median price (“broken below”, sign of decreasing price),
- 59% have a median price with a negative year-over-year change (the recent appreciation has disappeared),
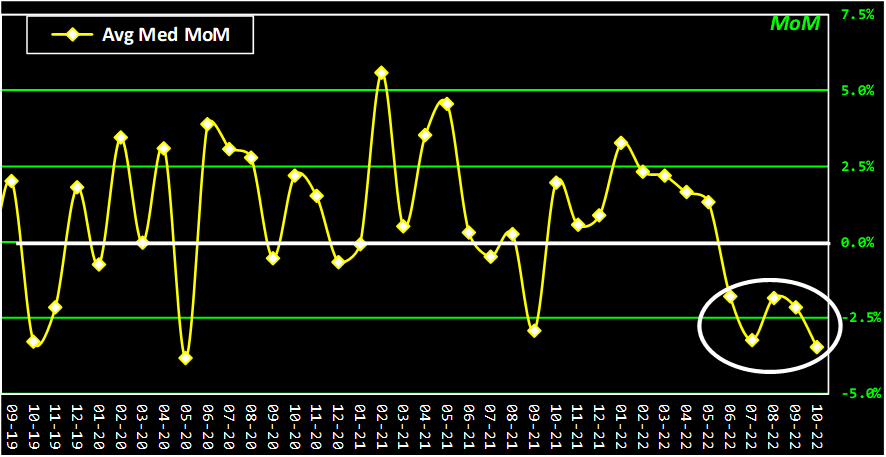
- 46 had a downward price momentum movement in October 2022 (and 5 went up),
- all have a positive momentum value (still a “buy” indicator), and
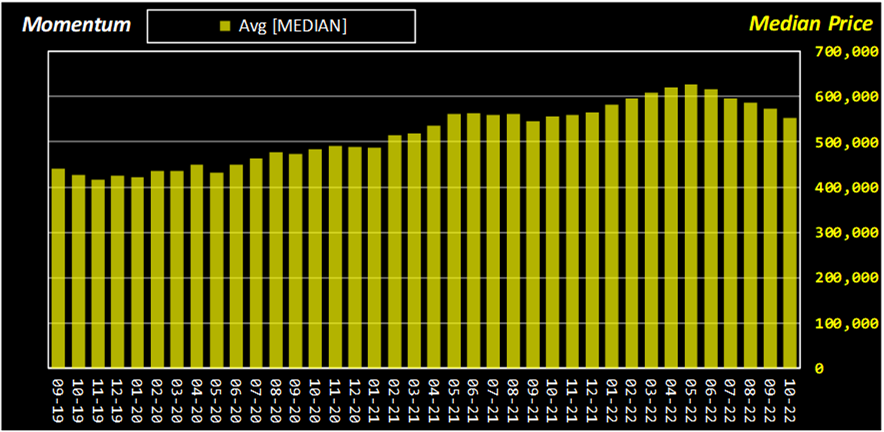
- their Average Median Price has decreased month-over-month for 5 straight months.

Evidence of Abnormal
Equilibrium is a concept that connotes a balance between supply and demand. Like a teeter-totter, when both sides are at the same level, the teeter isn’t tottering and it is equivalent to equilibrium or a balance between the two sides. As momentum can and does change the height of each side, back and forth. Because there is a physical limit to the height of both sides (and a “floor”), the weight on either side is what can keep the plank from tottering again.
Now put housing supply on one side and housing demand on the other. Zero becomes the limit to the “floor” on each side and the height of each side is limited by the other side. That is, the demand of housing cannot exceed the supply of housing. Herein comes builders and price increases. And, yes, builders like increases, too. But until there is enough supply for the demand, the price of a house will rise because the relative demand will rise.
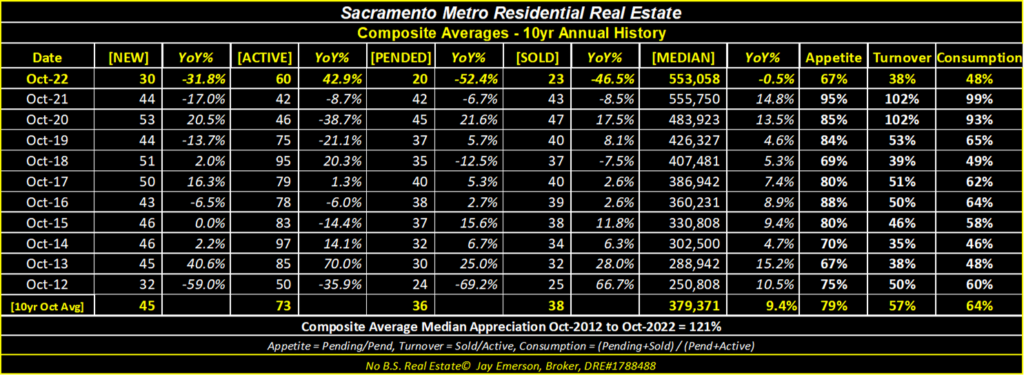
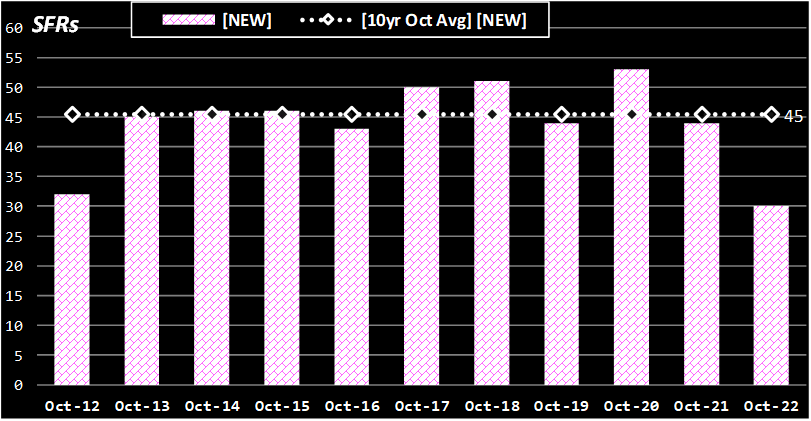
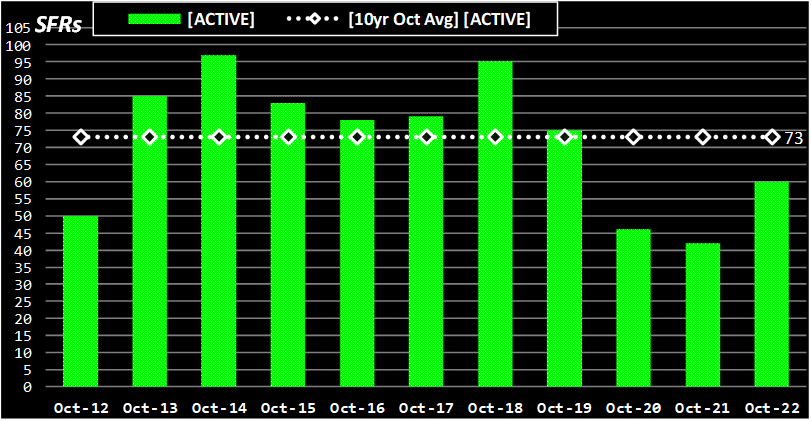
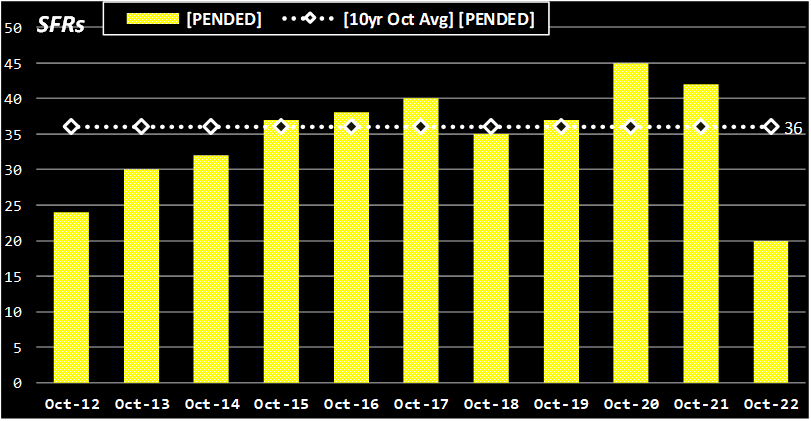
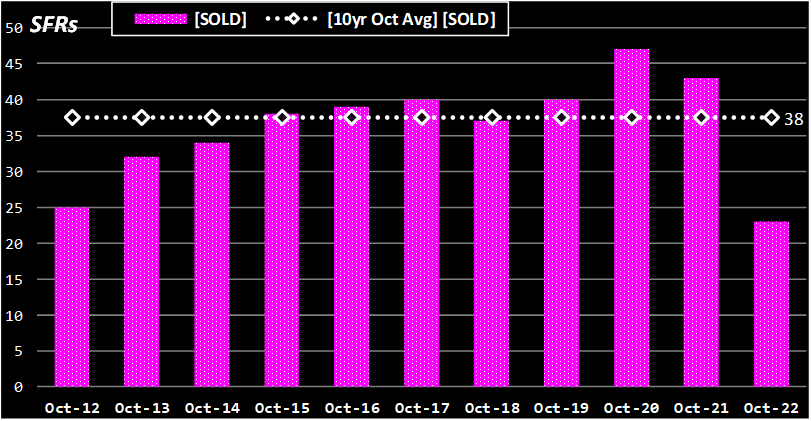
These charts show the individual supply and demand items I track. Bonkers is evident, to me.
Momentum, Moving Average, and Median Price
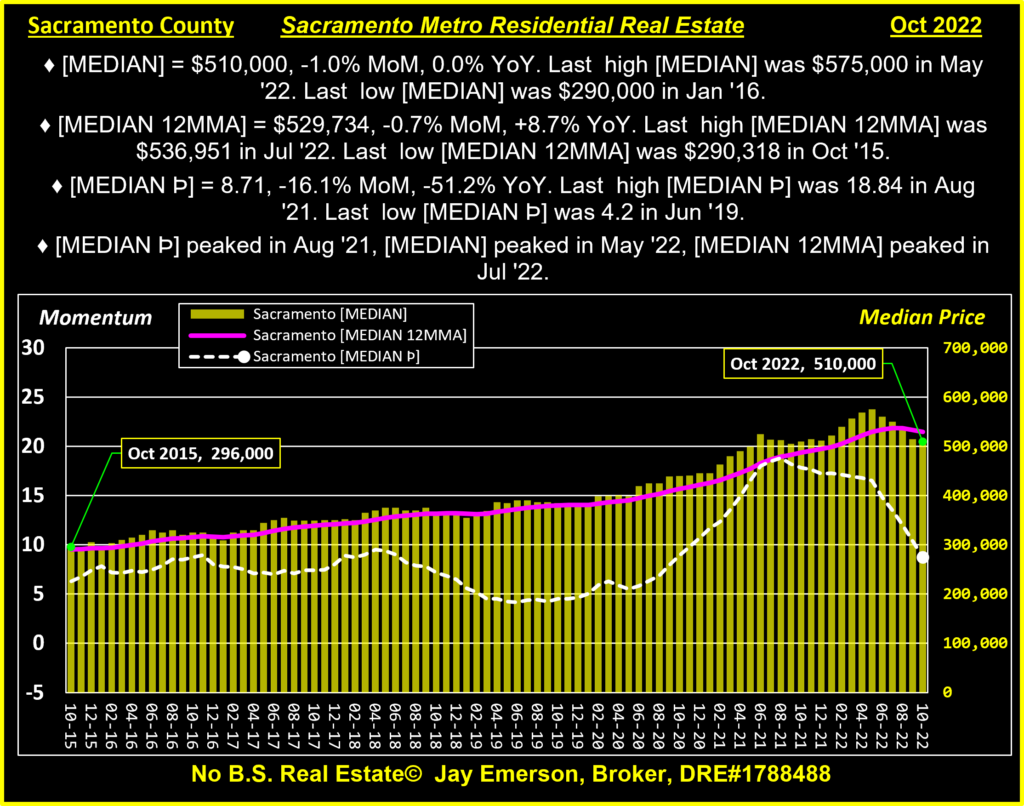
When a median price results from SOLD listings, the change from the previous months gives rise to 2 derivate calculations: 1) Momentum of the price change, and 2) Moving Average of the price. When all 3 are charted together, it’s easier to explain how the Momentum shows obvious changes before the Price which shows changes before the Moving Average. The charts now show the narrative for Price and derivatives to show how consistent the evidence is.
Almost without exception for each zip code and County tracked, Momentum ([MEDIAN Þ]) peaked before the Price ([MEDIAN]) which peaked before the Moving Average ([MEDIAN 12MMA]). Some zip codes had extended surges in appreciation and momentum. But all are starting to come down.
▓ Zip Codes Charted ▓
Fair Oaks – Folsom – Roseville – Orangevale – El Dorado Hills – Carmichael – Citrus Heights – Elk Grove – Placerville – Auburn – Lincoln – Rocklin – Rancho Cordova
Auburn 95603 – Median $649K, (Þ▼,MoM▲1.4%,YoY▲0.9%) – Appetite 60% – Turnover 27% – Consumption 36% – https://www.JayEmerson.com/auburn
Carmichael 95608 – Median $603K, (Þ▲,MoM▲8.1%,YoY▲9.6%) – Appetite 84% – Turnover 31% – Consumption 47% – https://www.JayEmerson.com/carmichael
Citrus Heights 95610 – Median $490K, (Þ▼,MoM▲2.1%,YoY▼-2.0%) – Appetite 79% – Turnover 34% – Consumption 49% – https://www.JayEmerson.com/citrus-heights
Citrus Heights 95621 – Median $464K, (Þ▼,MoM▲7.2%,YoY▲2.4%) – Appetite 93% – Turnover 65% – Consumption 77% – https://www.JayEmerson.com/citrus-heights
El Dorado Hills 95762 – Median $920K, (Þ◄►,MoM▲3.4%,YoY▼-8.0%) – Appetite 39% – Turnover 35% – Consumption 37% – https://www.JayEmerson.com/edh
Elk Grove 95624 – Median $591K, (Þ▼,MoM▼-10.5% ,YoY▼-4.7%) – Appetite 51% – Turnover 34% – Consumption 40% – https://www.JayEmerson.com/elk-grove
Elk Grove 95757 – Median $640K, (Þ▼,MoM▼-7.5% ,YoY▼-6.6%) – Appetite 132% – Turnover 30% – Consumption 52% – https://www.JayEmerson.com/elk-grove
Elk Grove 95758 – Median $547K, (Þ▼,MoM▼-2.3% ,YoY▼-4.9%) – Appetite 65% – Turnover 23% – Consumption 40% – https://www.JayEmerson.com/elk-grove
Fair Oaks 95628 – Median $612K, (Þ▼,MoM▲3.0%,YoY▼-1.8%) – Appetite 31% – Turnover 29% – Consumption 30% – https://www.JayEmerson.com/fair-oaks
Folsom 95630 – Median $725K, (Þ▼,MoM▼-6.5% ,YoY▼-1.4%) – Appetite 74% – Turnover 37% – Consumption 49% – https://www.JayEmerson.com/folsom
Lincoln 95648 – Median $630K, (Þ▼,MoM▲2.3%,YoY◄►0.0%) – Appetite 76% – Turnover 37% – Consumption 49% – https://www.JayEmerson.com/lincoln
Orangevale 95662 – Median $525K, (Þ▼,MoM▼-4.0% ,YoY▼-5.4%) – Appetite 45% – Turnover 43% – Consumption 44% – https://www.JayEmerson.com/orangevale
Placerville 95667 – Median $548K, (Þ▼,MoM▲6.4%,YoY▲6.4%) – Appetite 75% – Turnover 32% – Consumption 43% – https://www.JayEmerson.com/placerville
Rancho Cordova 95670 – Median $549K (NEW HIGH) (Þ▼,MoM▲9.8%,YoY▲11.8%) – Appetite 97% – Turnover 46% – Consumption 64% – https://www.JayEmerson.com/rancho-cordova
Rancho Cordova 95742 – Median $608K, (Þ▼,MoM▼-6.5% ,YoY▲1.3%) – Appetite 56% – Turnover 23% – Consumption 33% – https://www.JayEmerson.com/rancho-cordova
Rocklin 95677 – Median $593K, (Þ▼,MoM▼-5.1% ,YoY▼-8.8%) – Appetite 75% – Turnover 30% – Consumption 45% – https://www.JayEmerson.com/rocklin
Rocklin 95765 – Median $660K, (Þ▼,MoM▼-7.7% ,YoY▼-1.6%) – Appetite 51% – Turnover 36% – Consumption 41% – https://www.JayEmerson.com/rocklin
Roseville 95661 – Median $685K, (Þ▼,MoM▲9.6%,YoY▲14.0%) – Appetite 52% – Turnover 53% – Consumption 53% – https://www.JayEmerson.com/roseville
Roseville 95678 – Median $527K, (Þ▼,MoM▼-12.9% ,YoY▲6.5%) – Appetite 76% – Turnover 56% – Consumption 63% – https://www.JayEmerson.com/roseville
Roseville 95747 – Median $625K, (Þ▼,MoM▼-3.8% ,YoY▼-3.3%) – Appetite 64% – Turnover 38% – Consumption 46% – https://www.JayEmerson.com/roseville
Newly added:
West Sac 95605 – Median $436K, (Þ▼,MoM▼-17.7% ,YoY▲5.1%) – Appetite 133% – Turnover 82% – Consumption 93% – https://www.JayEmerson.com/zip-codes/#W-Sac-95605
Loomis 95650 – Median $915K, (Þ▼,MoM▼-10.2% ,YoY▼-5.6%) – Appetite 35% – Turnover 33% – Consumption 34% – https://www.JayEmerson.com/zip-codes/#Loomis-95650
North Highlnds 95660 – Median $365K, (Þ▼,MoM▼-2.7% ,YoY▼-2.9%) – Appetite 68% – Turnover 36% – Consumption 46% – https://www.JayEmerson.com/zip-codes/#N-Highlands-95660
Rio Linda 95673 – Median $370K, (Þ▼,MoM▼-8.6% ,YoY▼-12.9%) – Appetite 83% – Turnover 60% – Consumption 68% – https://www.JayEmerson.com/zip-codes/#Rio-Linda-95673
Cameron Pk 95682 – Median $613K, (Þ▼,MoM▼-11.8% ,YoY▼-0.3%) – Appetite 84% – Turnover 14% – Consumption 35% – https://www.JayEmerson.com/zip-codes/#Cam-Park-95682
West Sacramento 95691 – Median $545K, (Þ▼,MoM▼-11.4% ,YoY▲2.1%) – Appetite 57% – Turnover 58% – Consumption 58% – https://www.JayEmerson.com/zip-codes/#W-Sac-95691
Pollock Pines 95726 – Median $365K, (Þ▼,MoM▼-1.4% ,YoY▲1.4%) – Appetite 100% – Turnover 33% – Consumption 47% – https://www.JayEmerson.com/zip-codes/#Pollock-Pines-95726
Granite Bay 95746 – Median $1,000K, (Þ▼,MoM▼-11.9% ,YoY▲11.1%) – Appetite 59% – Turnover 30% – Consumption 38% – https://www.JayEmerson.com/zip-codes/#Granite-Bay-95746
Arden 95815 – Median $290K, (Þ▲,MoM▼-13.4% ,YoY▼-13.4%) – Appetite 50% – Turnover 24% – Consumption 35% – https://www.JayEmerson.com/zip-codes/#Arden-95815
Downtown 95816 – Median $655K, (Þ▼,MoM▲2.5%,YoY▲0.3%) – Appetite 47% – Turnover 59% – Consumption 54% – https://www.JayEmerson.com/zip-codes/#Downtown-95816
Oak Park 95817 – Median $538K, (Þ▼,MoM▼-6.1% ,YoY▲12.1%) – Appetite 47% – Turnover 14% – Consumption 25% – https://www.JayEmerson.com/zip-codes/#Oak-Park-95817
Land Park 95818 – Median $683K, (Þ▼,MoM▲1.6%,YoY▲1.0%) – Appetite 88% – Turnover 15% – Consumption 36% – https://www.JayEmerson.com/zip-codes/#Land-Park-95818
East Sacramento 95819 – Median $720K, (Þ▲,MoM▼-4.0% ,YoY▼-7.3%) – Appetite 64% – Turnover 37% – Consumption 44% – https://www.JayEmerson.com/zip-codes/#E-Sac-95819
Elder Creek 95820 – Median $390K, (Þ▼,MoM▼-6.7% ,YoY▼-4.9%) – Appetite 79% – Turnover 26% – Consumption 45% – https://www.JayEmerson.com/zip-codes/#Elder-Crk-95820
Arden 95821 – Median $482K, (Þ▲,MoM▼-0.6% ,YoY▼-1.2%) – Appetite 68% – Turnover 70% – Consumption 69% – https://www.JayEmerson.com/zip-codes/#Arden-95821
Greenhaven 95822 – Median $435K, (Þ▼,MoM▲7.7%,YoY▲4.1%) – Appetite 79% – Turnover 48% – Consumption 58% – https://www.JayEmerson.com/zip-codes/#Greenhaven-95822
Franklin 95823 – Median $420K, (Þ▼,MoM▼-2.3% ,YoY▲1.2%) – Appetite 52% – Turnover 41% – Consumption 46% – https://www.JayEmerson.com/zip-codes/#Franklin-95823
Fruitridge 95824 – Median $370K, (Þ▼,MoM▼-3.9% ,YoY▲5.7%) – Appetite 50% – Turnover 37% – Consumption 42% – https://www.JayEmerson.com/zip-codes/#Fruitridge-95824
Arden 95825 – Median $499K, (Þ▼,MoM▲12.9%,YoY▲2.9%) – Appetite 46% – Turnover 69% – Consumption 59% – https://www.JayEmerson.com/zip-codes/#Arden-95825
College Greens 95826 – Median $505K, (Þ▼,MoM▲9.1%,YoY▲11.0%) – Appetite 83% – Turnover 42% – Consumption 57% – https://www.JayEmerson.com/zip-codes/#College-Grns-95826
Rosemont 95827 – Median $425K, (Þ▼,MoM▼-9.2% ,YoY▼-3.4%) – Appetite 57% – Turnover 48% – Consumption 51% – https://www.JayEmerson.com/zip-codes/#Rosemont-95827
Florin 95828 – Median $465K, (Þ▼,MoM▼-1.1% ,YoY▼-3.5%) – Appetite 76% – Turnover 57% – Consumption 63% – https://www.JayEmerson.com/zip-codes/#Florin-95828
Vineyard 95829 – Median $535K, (Þ▼,MoM▼-10.8% ,YoY▼-0.6%) – Appetite 79% – Turnover 45% – Consumption 52% – https://www.JayEmerson.com/zip-codes/#Vineyard-95829
Pocket 95831 – Median $671K, (Þ▼,MoM▼-0.6% ,YoY▲13.9%) – Appetite 83% – Turnover 36% – Consumption 53% – https://www.JayEmerson.com/zip-codes/#Pocket-95831
Natomas 95833 – Median $460K, (Þ▼,MoM▼-5.7% ,YoY▲3.8%) – Appetite 90% – Turnover 30% – Consumption 49% – https://www.JayEmerson.com/zip-codes/#Natomas-95833
Natomas 95834 – Median $516K, (Þ▲,MoM▼-8.3% ,YoY▼-1.3%) – Appetite 88% – Turnover 43% – Consumption 55% – https://www.JayEmerson.com/zip-codes/#Natomas-95834
Natomas 95835 – Median $536K, (Þ▼,MoM▼-1.7% ,YoY▼-2.5%) – Appetite 53% – Turnover 47% – Consumption 49% – https://www.JayEmerson.com/zip-codes/#Natomas-95835
Del Paso Heights 95838 – Median $350K, (Þ▼,MoM▼-9.6% ,YoY▼-7.2%) – Appetite 87% – Turnover 37% – Consumption 56% – https://www.JayEmerson.com/zip-codes/#DP-Hts-95838
North Sacramento 95841 – Median $414K, (Þ▼,MoM▼-12.8% ,YoY▼-14.6%) – Appetite 57% – Turnover 62% – Consumption 60% – https://www.JayEmerson.com/zip-codes/#N-Sac-95841
Foothill Farms 95842 – Median $410K, (Þ▼,MoM▲0.2%,YoY▼-1.0%) – Appetite 47% – Turnover 66% – Consumption 57% – https://www.JayEmerson.com/zip-codes/#Foothill-Farms-95842
Antelope 95843 – Median $465K, (Þ▼,MoM▼-3.1% ,YoY▼-7.6%) – Appetite 79% – Turnover 55% – Consumption 64% – https://www.JayEmerson.com/zip-codes/#Antelope-95843
Arden 95864 – Median $725K, (Þ▼,MoM▼-4.6% ,YoY▼-7.2%) – Appetite 62% – Turnover 30% – Consumption 43% – https://www.JayEmerson.com/zip-codes/#Arden-95864

Jay Emerson, Broker
Masters Club – Outstanding Life Member
916-517-9606
Emerson Real Estate
“A Guaranteed Smooth Experience”
CA DRE#1788488
Recent Posts
I’m never too busy for your referrals and I can connect you or your friends and family with excellent agents throughout the country. Please don’t hesitate to reach out if I can help in any way.
