July Fire And Ice
The temperature was high in the Sac Metro area during July. Supply suddenly got hot but demand almost disappeared and is still trending lower. There is data to prove it but charts do so much more. These charts show when supply and demand started deviating from their “pattern of behavior”. Each of the 52 zip codes that comprise the Composite Averages showed the same kinds of results and chart shapes.
Keep in mind, these are my opinions of how the data is depicted. I’m interested in what you see or how you would like to see it.
What is the life of a listing:
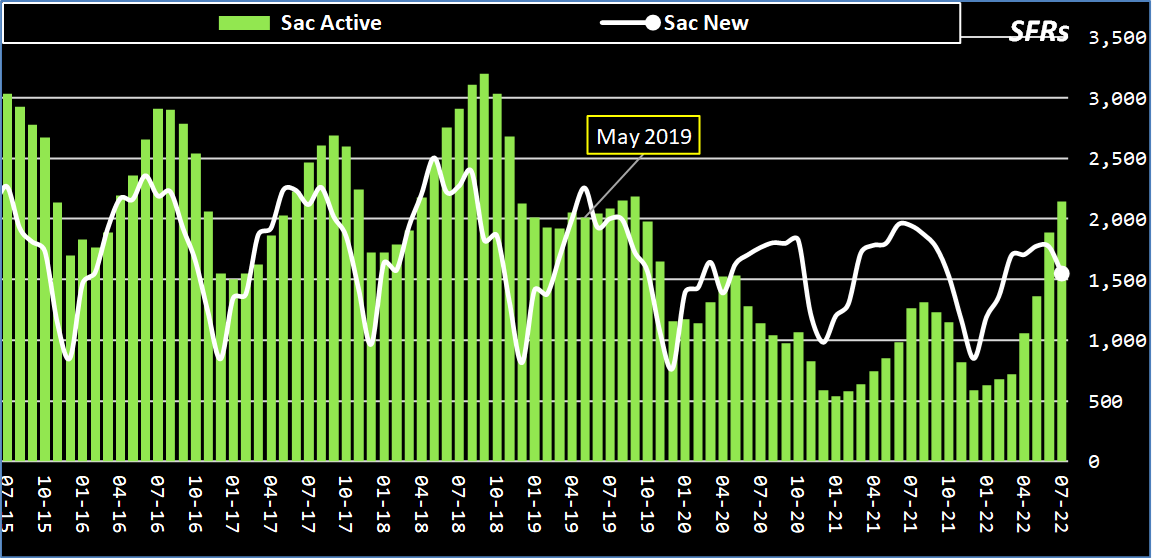
A listing entered on MLS is Active [and also New for the first 4-5 days] on the market.
Counted as New listings are all listings newly entered in that month. An Active listing may have been new in prior months.
If New is greater than Active, then some number of New/Active listings are becoming Pending before the end of the month and are not counted as Active any more.
(The pattern was disrupted in May 2019, I think. Active is returning but no thanks to New listings.)
Sacramento County
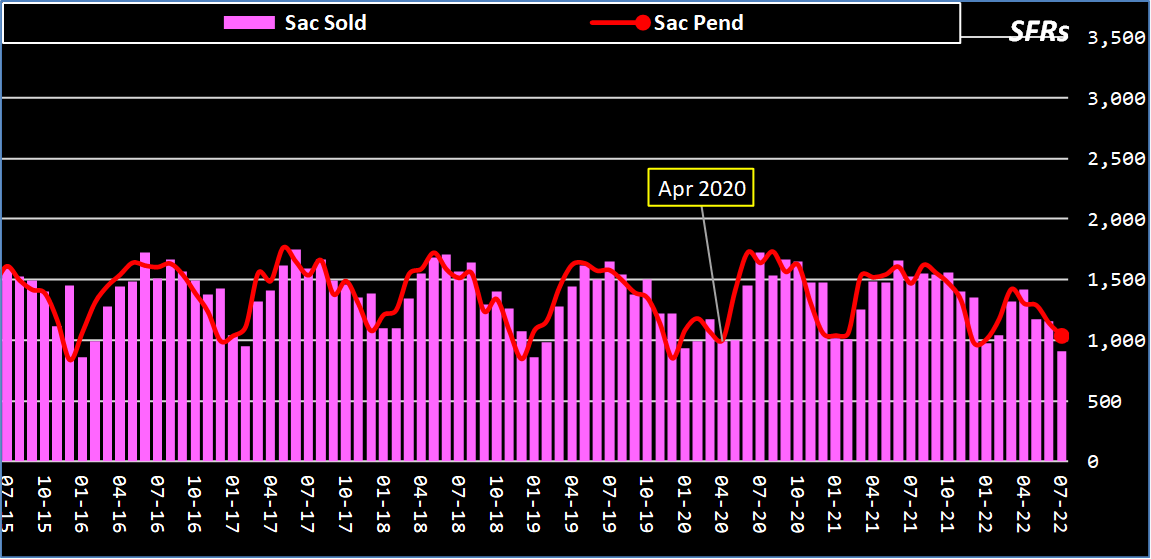
Pended listings are those which, at one time or more, became Pending (or Pending Bring Backup) during the month. When the majority of buyers are not cancelling the purchase, that majority will become Sold but maybe not in the same month.
A Pended listing can cancel and become Active again. It does not become New again.
All data entry is done by humans. That’s my caveat.
(This pattern was disrupted by ‘you know who’ in March/April 2020.)
Sacramento County
Instead of continuing to move to a “buyer’s” market in December 2019, there was a shift in Psychology and other market forces that, I think, moved the market back toward the BONKERS that started in 2020. That bonkers market continued until mortgage rates went up to 5% this year. (When the underlying Median Price is less than its 12-month moving average (EMA), it means the Median Price is decreasing. When the Price is less than the EMA for consecutive months, that trend is probably going to continue. Likewise, when the Price is greater than its EMA, the Price is appreciating. There is still no reason to believe Price will be less than its EMA next month but nothing goes up forever (except helium).
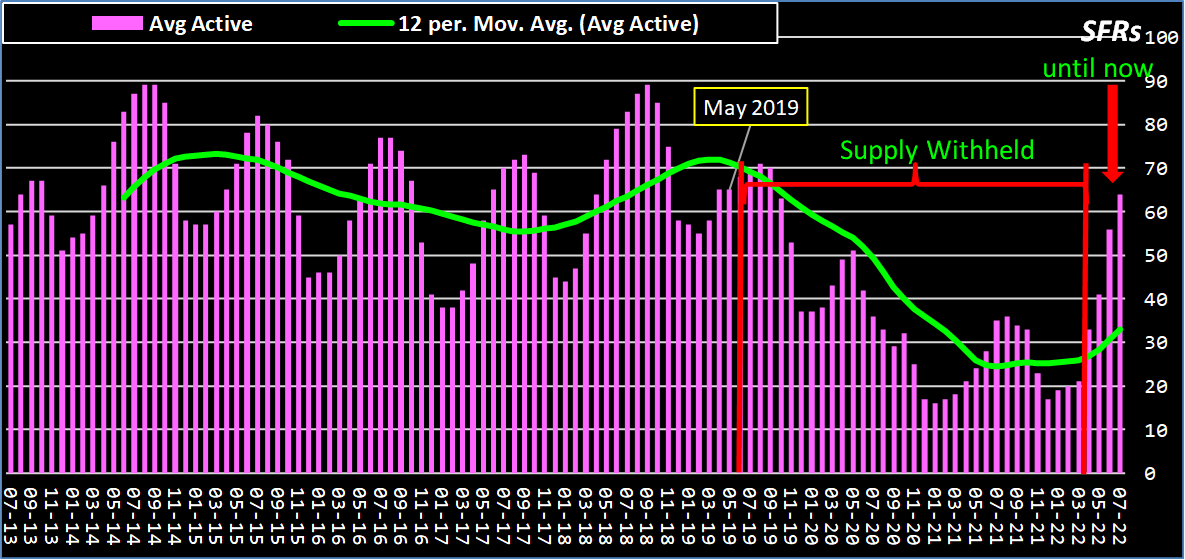
Composite Average

Supply, which is simply Active listings, took a well-known hiatus over the last several years. The chart makes the gap obvious and also shows the growing return of supply. Again, 2019 was the first evidence of a change in pattern.
Composite Average
Demand, also a simple definition of Sold listings, shows where there was NO gap while there was a supply gap. Demand really only increased relative to supply, not in its own right.
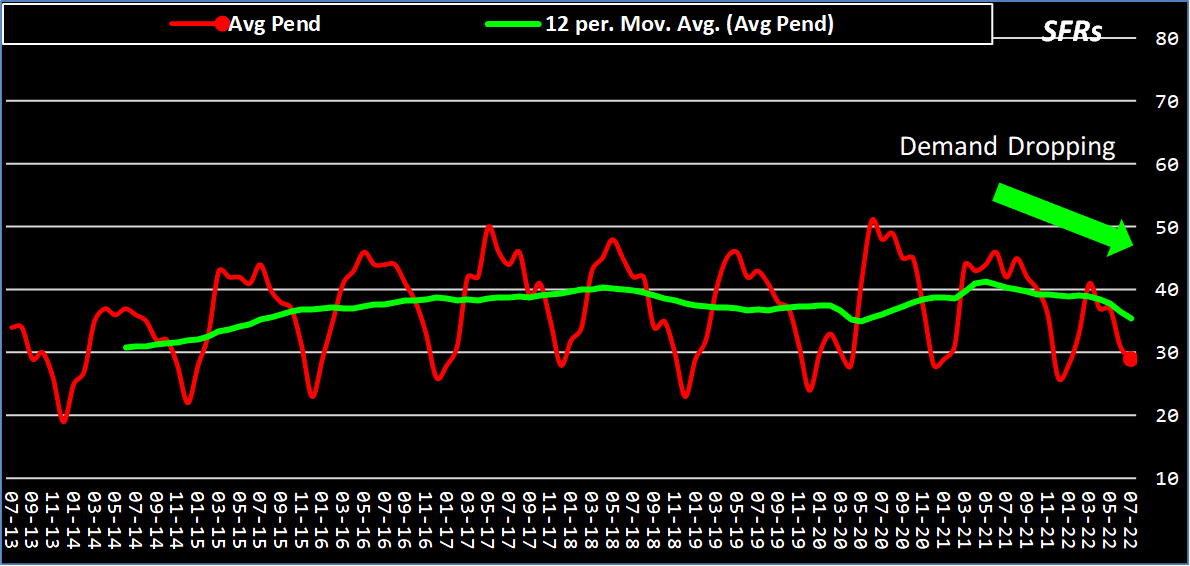
Composite Average

A leading data point for Demand is the volume of Pending listings. After all, given no escrow failures, a Pending listing becomes a Sold listing in about 30 days. So, as this chart intimates, the number of Sold listings will be lower next month.
Composite Average
So what? The market was heading down then money was poured into the market and real estate became the most desired asset. Sellers soon were confident that multiple offers and appraisers would agree to anything. The buyers’ psychology was “groomed” as well. Buyers dug into cash reserves to offer above and beyond asking prices. And sellers sat back as buyers refused to cancel. It was a seller’s market for sure.
If you are contemplating a purchase of a home, your family and plans need to be prepared. Yes, sometimes buyers purchase a home when prices are high. Given our history, appreciation will likely return after some depreciation. This is a normal growth and decay of a market.
If you are contemplating the sale of a home, there are 3 kinds of sellers in this market:
- Sellers who are serious about it and understand that we still don’t know if this is the “top”. But these sellers want the “next buyer” which means pricing, condition, and promotion matter. Are you willing to price the home to sell?
- Sellers who think they will set a new high and will not reduce their asking price. This kind of seller will likely be offended by a low offer from a buyer who has a different psychology than just 3 months ago.
- Sellers who might sell if the price is right. This kind of seller may sell at a reasonable price and even a reduced price. But they may not paint, clean, and primp for the new psychology.
If you are an investor, purchase if you can get a price that is low enough for the expected rent. Investors looking to sell have to understand: their true tax basis, that the “top” of the market may exist for several more months, and your competitors (other Active listings like yours) also want your buyer – does yours compare? And buyers are now limited in number. Your rental may need to be sold to a homeowner not an investor since investors need low prices to produce a monthly profit. Since investing in real estate can be for CASHFLOW or APPRECIATION – it’s only fortunate timing that makes an investment profit from both.
These are the 52 zip codes used to derive Composite Averages. Only those with hyperlinks are charted on my website.
Sacramento Metro Real Estate Jul 2022🚫 No B.S. Real Estate – https://jayemerson.com/market
(Þ = momentum)
- Composite Averages – Median $605K (Þ▼,MoM▼-2.1% ,YoY▲8.1%) – Appetite 67% – Turnover 39% – Consumption 50%
- Placerville 95667 – Median $573K, (Þ▼,MoM▼-10.0% ,YoY▲6.1%) – Appetite 132% – Turnover 37% – Consumption 63%
- Cameron Pk 95682 – Median $703K, (Þ▼,MoM▼-4.6% ,YoY▲0.6%) – Appetite 72% – Turnover 47% – Consumption 56%
- Pollock Pines 95726 – Median $399K, (Þ▼,MoM▼-5.0% ,YoY▼-9.3%) – Appetite 147% – Turnover 33% – Consumption 57%
- El Dorado Hills 95762 – Median $1,050K, (Þ▼,MoM▲9.9%,YoY▲12.7%) – Appetite 64% – Turnover 32% – Consumption 43%
- Auburn 95603 – Median $625K, (Þ▼,MoM▼-18.5% ,YoY▲0.8%) – Appetite 94% – Turnover 31% – Consumption 50%
- Lincoln 95648 – Median $668K, (Þ▼,MoM▼-6.3% ,YoY▲6.4%) – Appetite 58% – Turnover 41% – Consumption 47%
- Loomis 95650 – Median $727K, (Þ▲,MoM▼-42.1% ,YoY▼-23.9%) – Appetite 46% – Turnover 15% – Consumption 26%
- Roseville 95661 – Median $750K (NEW HIGH) (Þ▼,MoM▲7.1%,YoY▲15.4%) – Appetite 69% – Turnover 61% – Consumption 65%
- Rocklin 95677 – Median $732K, (Þ▼,MoM▲9.3%,YoY▲17.1%) – Appetite 45% – Turnover 30% – Consumption 35%
- Roseville 95678 – Median $632K, (Þ▲,MoM▲11.3%,YoY▲16.8%) – Appetite 73% – Turnover 56% – Consumption 64%
- Granite Bay 95746 – Median $1,411K, (Þ▼,MoM◄►0.0%,YoY▲12.9%) – Appetite 86% – Turnover 39% – Consumption 59%
- Roseville 95747 – Median $706K, (Þ▼,MoM▲0.9%,YoY▲12.1%) – Appetite 55% – Turnover 30% – Consumption 39%
- Rocklin 95765 – Median $750K, (Þ▼,MoM▼-2.0% ,YoY▲11.9%) – Appetite 48% – Turnover 38% – Consumption 42%
- Carmichael 95608 – Median $630K (NEW HIGH) (Þ▼,MoM▲5.0%,YoY▲11.3%) – Appetite 79% – Turnover 49% – Consumption 61%
- Citrus Heights 95610 – Median $550K, (Þ▼,MoM◄►0.0%,YoY▲14.6%) – Appetite 83% – Turnover 27% – Consumption 48%
- Citrus Heights 95621 – Median $465K, (Þ▲,MoM▼-10.6% ,YoY▲2.0%) – Appetite 58% – Turnover 49% – Consumption 54%
- Elk Grove 95624 – Median $675K, (Þ▼,MoM▲1.7%,YoY▲5.5%) – Appetite 54% – Turnover 29% – Consumption 39%
- Fair Oaks 95628 – Median $640K, (Þ▼,MoM▼-1.5% ,YoY▲0.8%) – Appetite 88% – Turnover 42% – Consumption 61%
- Folsom 95630 – Median $775K, (Þ▼,MoM▼-1.9% ,YoY▲6.9%) – Appetite 48% – Turnover 30% – Consumption 37%
- North Highlnds 95660 – Median $396K, (Þ▼,MoM▼-1.7% ,YoY▲7.0%) – Appetite 80% – Turnover 62% – Consumption 71%
- Orangevale 95662 – Median $549K, (Þ▲,MoM▼-10.6% ,YoY▲1.9%) – Appetite 94% – Turnover 71% – Consumption 81%
- Rancho Cordova 95670 – Median $515K, (Þ▼,MoM▲0.4%,YoY▲3.2%) – Appetite 67% – Turnover 60% – Consumption 63%
- Rio Linda 95673 – Median $483K, (Þ▲,MoM▲5.0%,YoY▲20.8%) – Appetite 42% – Turnover 34% – Consumption 37%
- Rancho Cordova 95742 – Median $630K, (Þ▼,MoM▼-2.6% ,YoY▲8.6%) – Appetite 57% – Turnover 35% – Consumption 42%
- Elk Grove 95757 – Median $720K, (Þ▼,MoM▼-0.7% ,YoY▲7.1%) – Appetite 64% – Turnover 36% – Consumption 47%
- Elk Grove 95758 – Median $605K, (Þ▼,MoM▼-1.0% ,YoY▲10.0%) – Appetite 85% – Turnover 59% – Consumption 71%
- Arden 95815 – Median $371K, (Þ▼,MoM▲9.8%,YoY▲14.9%) – Appetite 63% – Turnover 27% – Consumption 41%
- Downtown 95816 – Median $803K, (Þ▼,MoM▼-2.1% ,YoY▲21.1%) – Appetite 93% – Turnover 76% – Consumption 83%
- Oak Park 95817 – Median $530K, (Þ▼,MoM▲11.6%,YoY▲6.0%) – Appetite 89% – Turnover 30% – Consumption 59%
- Land Park 95818 – Median $755K, (Þ▲,MoM▼-6.8% ,YoY▲20.8%) – Appetite 89% – Turnover 43% – Consumption 63%
- East Sacramento 95819 – Median $890K, (Þ▲,MoM▲20.3%,YoY▲18.7%) – Appetite 72% – Turnover 71% – Consumption 72%
- Elder Creek 95820 – Median $418K, (Þ▲,MoM▼-11.1% ,YoY▲0.7%) – Appetite 63% – Turnover 32% – Consumption 47%
- Arden 95821 – Median $600K (NEW HIGH) (Þ▼,MoM▲17.6%,YoY▲24.5%) – Appetite 71% – Turnover 50% – Consumption 58%
- Greenhaven 95822 – Median $435K, (Þ▲,MoM▼-4.4% ,YoY◄►0.0%) – Appetite 51% – Turnover 39% – Consumption 44%
- Franklin 95823 – Median $428K, (Þ▼,MoM▼-5.9% ,YoY▲0.7%) – Appetite 75% – Turnover 64% – Consumption 69%
- Fruitridge 95824 – Median $375K, (Þ▲,MoM◄►0.0%,YoY▲4.2%) – Appetite 93% – Turnover 43% – Consumption 64%
- Arden 95825 – Median $470K, (Þ▼,MoM▲3.3%,YoY▲1.1%) – Appetite 80% – Turnover 40% – Consumption 57%
- College Greens 95826 – Median $500K, (Þ▼,MoM▼-4.8% ,YoY▲8.7%) – Appetite 64% – Turnover 56% – Consumption 60%
- Rosemont 95827 – Median $519K (NEW HIGH) (Þ▼,MoM▲9.5%,YoY▲10.9%) – Appetite 75% – Turnover 57% – Consumption 64%
- Florin 95828 – Median $489K, (Þ▼,MoM▲0.8%,YoY▲9.9%) – Appetite 58% – Turnover 36% – Consumption 45%
- Vineyard 95829 – Median $598K, (Þ▼,MoM▼-0.7% ,YoY▲10.9%) – Appetite 55% – Turnover 37% – Consumption 44%
- Pocket 95831 – Median $625K, (Þ▼,MoM▼-5.2% ,YoY▼-1.6%) – Appetite 68% – Turnover 41% – Consumption 54%
- Natomas 95833 – Median $480K, (Þ▼,MoM▼-8.2% ,YoY▲4.3%) – Appetite 57% – Turnover 38% – Consumption 44%
- Natomas 95834 – Median $552K, (Þ▼,MoM▼-3.2% ,YoY▲0.4%) – Appetite 64% – Turnover 51% – Consumption 56%
- Natomas 95835 – Median $585K, (Þ▼,MoM▼-6.3% ,YoY▲2.6%) – Appetite 57% – Turnover 40% – Consumption 47%
- Del Paso Heights 95838 – Median $385K, (Þ▼,MoM▲2.9%,YoY▼-1.3%) – Appetite 68% – Turnover 34% – Consumption 47%
- North Sacramento 95841 – Median $500K, (Þ▼,MoM▲6.8%,YoY▲13.6%) – Appetite 92% – Turnover 58% – Consumption 72%
- Foothill Farms 95842 – Median $465K (NEW HIGH) (Þ▼,MoM▲3.6%,YoY▲12.0%) – Appetite 84% – Turnover 50% – Consumption 65%
- Antelope 95843 – Median $505K, (Þ▼,MoM▼-7.0% ,YoY▲3.1%) – Appetite 54% – Turnover 33% – Consumption 44%
- Arden 95864 – Median $852K, (Þ▲,MoM▲0.2%,YoY▲48.7%) – Appetite 73% – Turnover 31% – Consumption 51%
- West Sac 95605 – Median $425K, (Þ▼,MoM◄►0.0%,YoY◄►0.0%) – Appetite 114% – Turnover 19% – Consumption 48%
- West Sacramento 95691 – Median $515K, (Þ▼,MoM▼-10.1% ,YoY▲5.3%) – Appetite 57% – Turnover 25% – Consumption 38%
Market Menu
Overview – Major – Financing – Averages – Momentum – Counties
Zip Codes Charted
Fair Oaks – Folsom – Roseville – Orangevale – El Dorado Hills – Carmichael – Citrus Heights – Elk Grove – Placerville – Auburn – Lincoln – Rocklin – Rancho Cordova