Swing Swung Hard
Mathematics and Expectations
When markets change, it’s usually gradual. It takes time for humans to adjust to the forces that affect supply of and demand for houses. As a buyer, the major force is the cost of money [if you are borrowing]. As a seller, the major force is finding a new ‘landing’ or home. Many of my sellers in the last 4 years have moved out of California – imagine that. But sellers are also affected by the cost of money since that will dictate who is qualified for their house. And when their neighbor just sold for $550k without a pool, it is human nature to expect even more for your house just 3 weeks later.
We are seeing how that is not a practical expectation. A buyer who was qualified for $600k last year at 3% must now be re-qualified at 5.5%. Math says their number will be lower. So sellers can insist on a new group of qualified buyers or cancel their listing.

Supply and Demand
The indicators I created called Appetite, Turnover, and Consumption are showing dramatic changes due to the basic changes in Supply and Demand. It is impractical to think the number of buyers is infinite. It is also impractical to think sellers will never sell. But we are seeing a sharp increase in Supply and a similar decrease in Demand.
Appetite compares the number of NEW listings to the number of PENDED listings during the month. When a market changes, these two ‘transient and temporary’ stages of a listing occur first since NEW and the lightly correlated PENDED numbers foretell the SOLD numbers at the end of the month.
Turnover compares the number of ACTIVE listings and the number of SOLD listings at the end of the month. As is also mathematically true, when we consistently sell more than we have on hand, we will soon run out of inventory.
Consumption is a combination of each indicator – compares the number of PENDED+SOLD to the number of NEW+ACTIVE listings to generally give a number for DEMAND/SUPPLY.
At the bottom of each “History” grid, like the one shown below, the “10yr Avg” is shown. (Month of each year used to preserve the seasonality of real estate.) That is, for June, the 10yr Average Appetite is 75% while this June the Appetite was 65%. These indicators were very high for the last 18 months and now are lower than their 10yr averages. Concerning?
If you are a home seller [,call me], you have to adjust your expectations. If you are a buyer [,call me], get in touch with your lender to determine HOW MUCH you need to adjust.
In either case, call me first. I’ll serve YOUR interests.

Jun 2022 – Composite Average
SUPPLY = [New] + [Active] listings was 105, 92% of its [10yr Jun Avg].
[New] listings was 49, DOWN 12.5% YoY, and is 91% of its [10yr Jun Avg], favoring SELLERS.
[Active] listings was 56, UP 100.0% YoY, and is 94% of its [10yr Jun Avg], favoring SELLERS.
DEMAND = [Pended] + [Sold] listings was 65, 79% of its [10yr Jun Avg].
[Pended] listings was 32, DOWN 30.4% YoY, and is 79% of its [10yr Jun Avg], favoring BUYERS.
[Sold] listings was 33, DOWN 29.8% YoY, and is 80% of its [10yr Jun Avg], favoring BUYERS.
Consumption of listings was 62% – ([DEMAND]/[SUPPLY]) or 65/105 – the [10yr Jun Avg] is 74%
Appetite for listings was 65% – [Pended]/[New] or 32/49 – the [10yr Jun Avg] is 75%
Turnover of listings was 59% – [Sold]/[Active] or 33/56 – the [10yr Jun Avg] is 77%
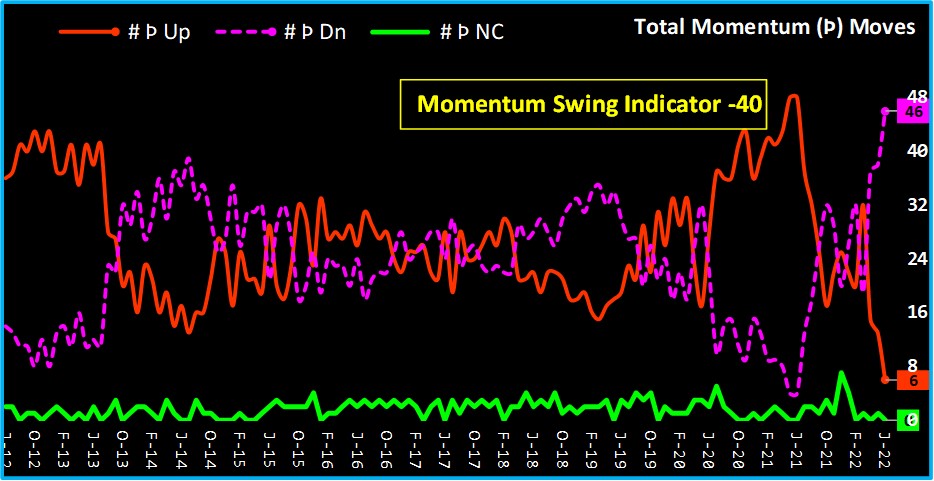
Swing Indicator
Using data from 52 zip codes, the price momenta are aggregated to show Momentum Swing. This view depicts market movement, price variability, and potential future triggers. My “Swing Indicator”, similar but not identical to an EKG because of the granular elements (zip codes), tells me when the general direction (via momentum) is increasing, decreasing, or unchanged in the current month.
Avg Momentum was 15.01, DOWN 7.3% from last month and DOWN 17.3% from last year.
[Maximum Momentum] was 28.24 in Loomis 95650.
[Minimum Momentum] was 5.83 in Roseville 95661.
Momentum depicts a 12-month moving average.
[# of Momenta Above Zero] was 52, unchanged 0.0% from last month and unchanged 0.0% from last year. A price whose momentum is positive is technically in the BUY range.
[# of Momenta Up] was 6, DOWN 53.8% from last month and DOWN 87.5% from last year.
[# of Momenta Down] was 46, UP 21.1% from last month and UP 1050.0% from last year.
[Swing Indicator] was -40, UP 60.0% from last month and DOWN 9.1% from last year. This is the result of subtracting 46 from [# of Momenta Down] from 6 [# of Momenta Up] and depicts swings in market behavior.
[Momentum Spread] was 22.41 and [Running Spread (12 mo.)] was 18.59. Spread depicts the variance between
Maximum and Minimum momenta for the month and, hence, the disparity of price changes and depth of market swings.
▓ Zip Codes Charted ▓
Fair Oaks – Folsom – Roseville – Orangevale – El Dorado Hills – Carmichael – Citrus Heights – Elk Grove – Placerville – Auburn – Lincoln – Rocklin – Rancho Cordova