External Forces Ensure Price Drops
Growth and decay are two natural events in the course of any lifeform. Some, like Sequoia trees and tortoises can grow for a century or more before decay starts. And the rate of each force is correlated to the rate of the other. There are laws describing and calculations to determine rates of growth and decay.
Real estate markets are comprised of human (mostly) sellers and buyers of single-family homes and condos. By association, their ‘bartering’ for a house makes this market organic and vulnerable to nature (psychology). A “free” market will grow and decay (“prices go up and then down, and repeat”) in nominal amounts. But because we have so many external forces that affect supply and demand, we cannot call ours a Free Market for sellers and buyers of homes.
The prices have grown in unnatural ways over the last 3 years. (Momentum was heading toward a negative value in late 2019 – almost every momentum charted shows this). This ‘bonkers’ market was good news for many sellers and, without fail, not good news for some buyers, although those buyers have yet to learn the poor timing of their purchase IF THEIR ‘MEANS’ DECAY. But their sellers had good timing. Wow. One market principal benefits by the growth while the other principal has yet to experience the price [and means] decay. Unnatural growth probably REQUIRES unnatural decay. There are physical laws that define how a consequence of an action is potentially equal to or greater than the action. These roles will flip when a market ‘bottom’ appears; the decay starts affecting sellers negatively.
But not all buyers chose their timing. Some established a new family, a new home, and a new chapter in their lives. And not all sellers chose their timing (“accidental fortune”) but were forced to sell, relocate, or leave California. (An agent’s marketing to past buyers presumes those buyers will be “move-up buyers” some day. But, instead, they left the State – thanks, Democrats.)
The reasons for our unnatural growth were fear, abundance of money, and lack of houses for sale. This is how inflation happens. And this is how much humans are affected by external forces. These forces rushed the appreciation which we knew was bonkers as it was happening. We were all surfing the waves of fear and money.
- Fear – kids must fear ‘outside’; everyone must fear ‘unmasked’; young must fear old; all must fear [and report] Trump voters.
- Money – free money to stay inside and unemployed; very low cost of money to buy real estate; more free money to vote for more free money.
- Houses – agents must be nurses; sellers must disinfect; (see Fear).
And the exodus from urbana has been remarkable since companies have let their workers WFH (Work From Home). Where do those remote workers go? Sacramento Metro, for one. The market for SF commercial and rental real estate has been decaying since BEFORE the lockdowns. Crime and the population of ‘unhoused’ has been chasing people out of downtowns. Then the lockdowns and ‘fear porn’ pushed by none other than the CDC, WHO, California Department of Public Health and Newsom. These criminals must be exposed and banned. I pray their forced ‘jabs’ don’t take our boys or their ability to thrive, prosper and procreate. (If there is a lawyer who knows how the lack of informed consent can win, call me. There are thousands of potential criminals in this population. I know of two ‘higher’ learning institutions that fall into the criminal category.)
There are several charts that show how some patterns have been ‘interrupted’ and how the market is responding to the unnatural growth, stemmed mostly from fear. There were some uncanny motivators since early 2020. The motivators have created a ‘whipsaw’, where supply gluts result from sudden shortages in a [brief] surge of demand. THAT results in too much supply. Money can be a motivator. Fear can be a motivator. A combination of both caused these shapes in charts. Tell me if you don’t see humps that seem ‘out of order’.
Timing, psychology, and location continue to be the most important 3 words in real estate. Fear works in any time and affects many psychologies. Fear can make location matter even less.
Fair Oaks Median Price
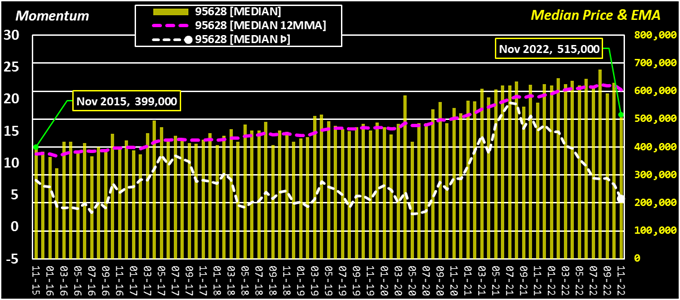
♦ [MEDIAN] = $515,000, -18.3% MoM, -7.9% YoY. Last high [MEDIAN] was $678,000 in Aug ’22. Last low [MEDIAN] was $325,000 in Feb ’16.
♦ [MEDIAN 12MMA] = $604,745, -2.6% MoM, +4.4% YoY. Last high [MEDIAN 12MMA] was $624,599 in Aug ’22. Last low [MEDIAN 12MMA] was $367,042 in Feb ’16.
♦ [MEDIAN Þ] = 4.41, -32.7% MoM, -70.8% YoY. Last high [MEDIAN Þ] was 19.40 in Jul ’21. Last low [MEDIAN Þ] was 2.1 in May ’20.
♦ [MEDIAN Þ] peaked in Jul ’21, [MEDIAN] peaked in Aug ’22, [MEDIAN 12MMA] peaked in Aug ’22.
Folsom Median Price
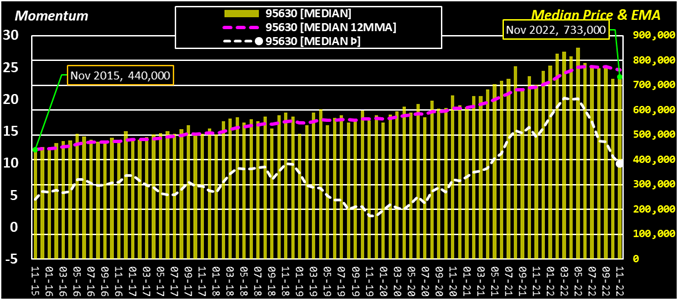
♦ [MEDIAN] = $733,000, +1.1% MoM, +4.6% YoY. Last high [MEDIAN] was $850,000 in May ’22. Last low [MEDIAN] was $440,000 in Nov ’15.
♦ [MEDIAN 12MMA] = $761,139, -0.7% MoM, +10.0% YoY. Last high [MEDIAN 12MMA] was $774,710 in Jul ’22. Last low [MEDIAN 12MMA] was $442,883 in Nov ’15.
♦ [MEDIAN Þ] = 9.97, -9.1% MoM, -29.3% YoY. Last high [MEDIAN Þ] was 20.18 in Mar ’22. Last low [MEDIAN Þ] was 1.7 in Dec ’19.
♦ [MEDIAN Þ] peaked in Mar ’22, [MEDIAN] peaked in May ’22, [MEDIAN 12MMA] peaked in Jul ’22.
Carmichael Median Price
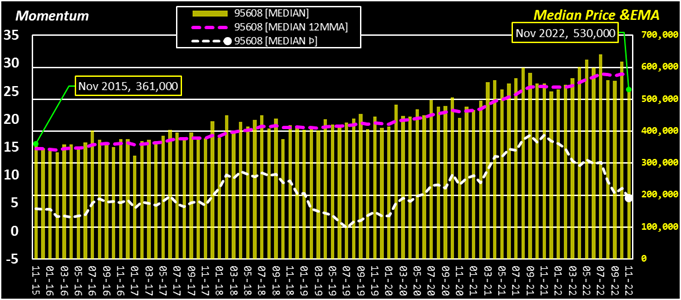
♦ [MEDIAN] = $530,000, -14.1% MoM, -3.6% YoY. Last high [MEDIAN] was $640,000 in Jul ’22. Last low [MEDIAN] was $324,000 in Jan ’17.
♦ [MEDIAN 12MMA] = $572,711, -1.3% MoM, +5.9% YoY. Last high [MEDIAN 12MMA] was $580,474 in Oct ’22. Last low [MEDIAN 12MMA] was $341,902 in Feb ’16.
♦ [MEDIAN Þ] = 5.87, -23.1% MoM, -65.7% YoY. Last high [MEDIAN Þ] was 17.20 in Sep ’21. Last low [MEDIAN Þ] was 0.6 in Jul ’19.
♦ [MEDIAN Þ] peaked in Sep ’21, [MEDIAN] peaked in Jul ’22, [MEDIAN 12MMA] peaked in Oct ’22.
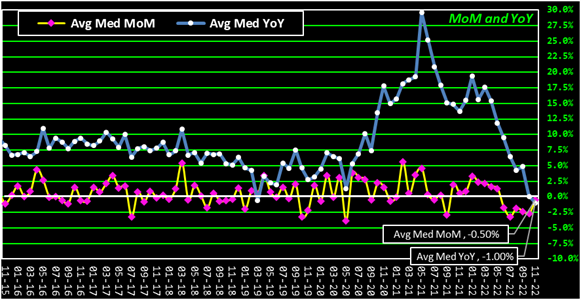
Composite Average Median Price MoM and YoY
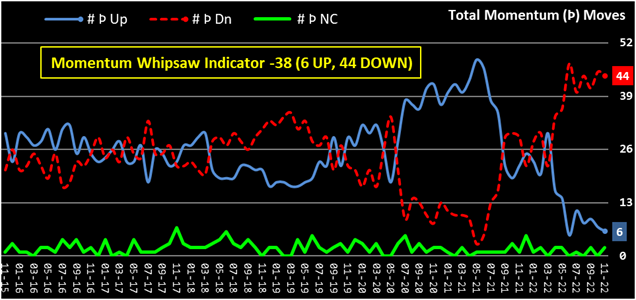
Composite Momentum ‘Whipsaw’ Indicator
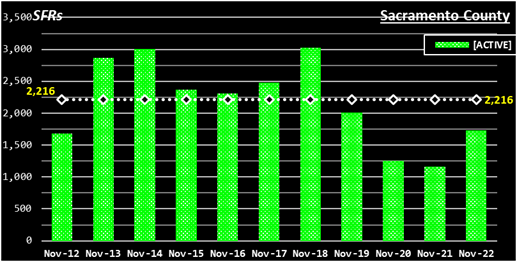
Sacramento County Inventory
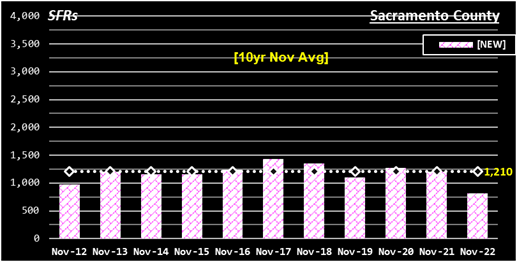
♦ [NEW] listings = 814, -28.0% MoM, -32.4% YoY, 67% of its [10yr Nov Avg] of 1,210.
♦ [ACTIVE] listings = 1,726, -16.3% MoM, +48.4% YoY, 78% of its [10yr Nov Avg] of 2,216.
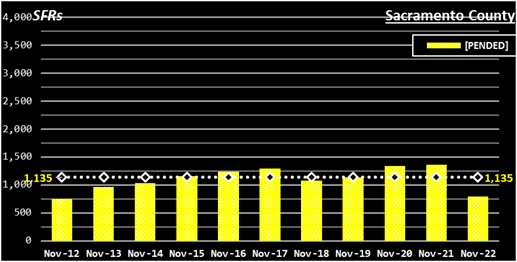
♦ [PENDED] listings = 791, -7.3% MoM, -42.2% YoY, 70% of its [10yr Nov Avg] of 1,135.
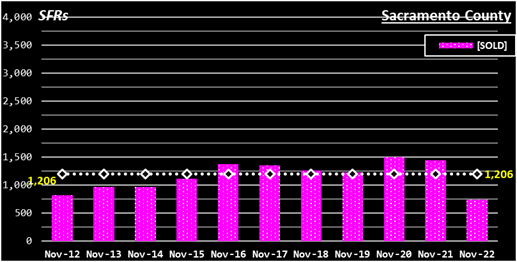
♦ [SOLD] listings = 746, -15.8% MoM, -48.4% YoY, 62% of its [10yr Nov Avg] of 1,206.
Sac Metro Zip Codes Charted
Fair Oaks 95628 – Folsom 95630 – Roseville 95661 95678 95747 – Orangevale 95662 – El Dorado Hills 95762 – Carmichael 95608 – Citrus Heights 95610 95621 – Elk Grove 95624 95757 95758 – Placerville 95667 – Auburn 95603 – Lincoln 95648 – Rocklin 95677 95765 – Rancho Cordova 95670 95742
(Zip Codes web page) West Sac 95605 – West Sac 95691 – Loomis 95650 – North Highlands 95660 – Rio Linda 95673 – Cameron Park 95682 – Pollock Pines 95726 – Granite Bay 95746 – Arden 95815 – Downtown 95816 – Oak Park 95817 – Land Park 95818 – East Sac 95819 – Elder Creek 95820 – Arden 95821 – Greenhaven 95822 – Franklin 95823 – Fruitridge 95824 – Arden 95825 – College Greens 95826 – Rosemont 95827 – Florin 95828 – Vineyard 95829 – Pocket 95831 – Natomas 95833 – Natomas 95834 – Natomas 95835 – Del Paso Hts 95838 – North Sac 95841 – Foothill Farms 95842 – Antelope 95843 – Arden 95864
Jay Emerson, Broker Masters Club – Outstanding Life Member – DRE#1788488 |