10 Facts About The Market
1
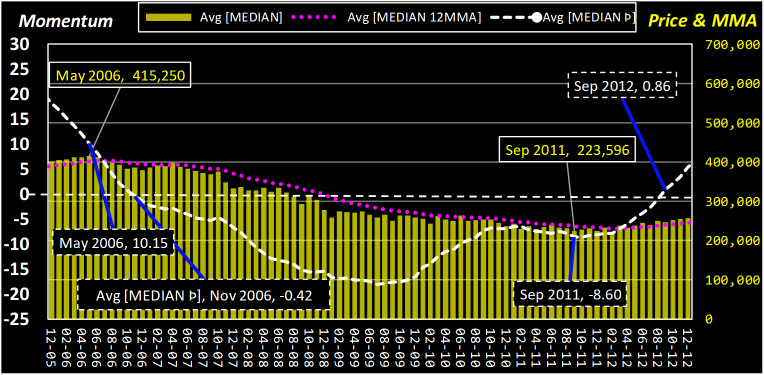
- The Average Median Price peaked May 2006 at $415,250
- Momentum was positive 10 and crossed below the zero axis 6 months later.
- The market trough occurred in Sep 2011 at $223,596, 5 years and 3 months later.
2
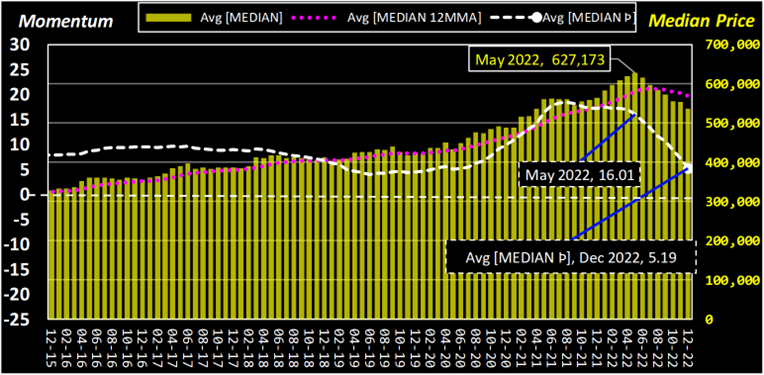
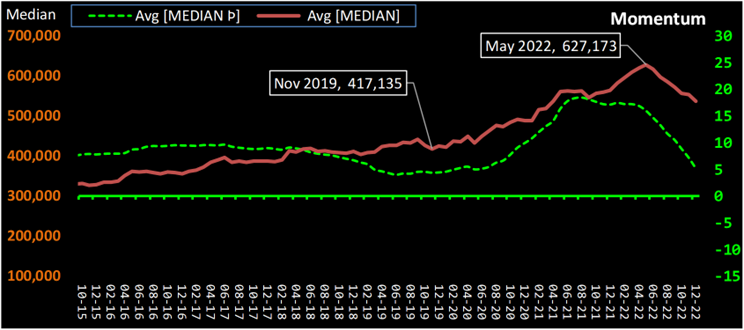
- The Average Median Price peaked in May 2022 at $627,173.
- Momentum was positive 16 and is now positive 5, 6 months later.
- The Price has decreased for the last 7 consecutive months.
3
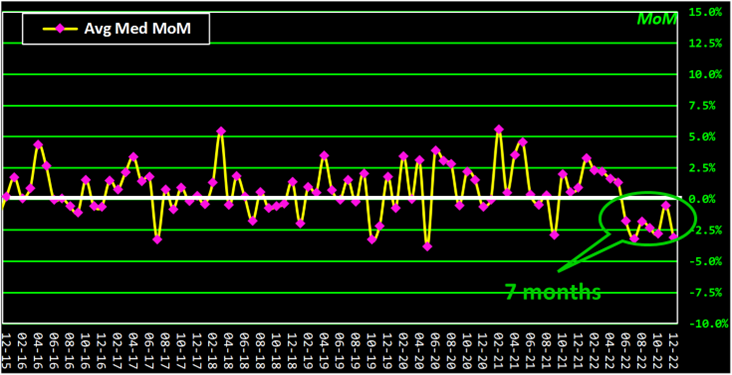
- For the first time in 25 years, the month-over-month rate of change for the Average Median Price was negative for 7 consecutive months.
4
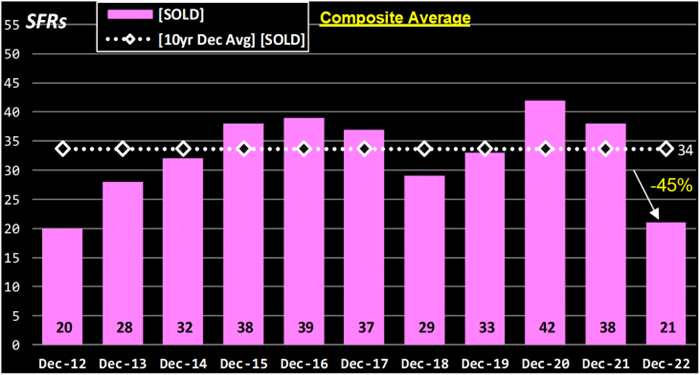
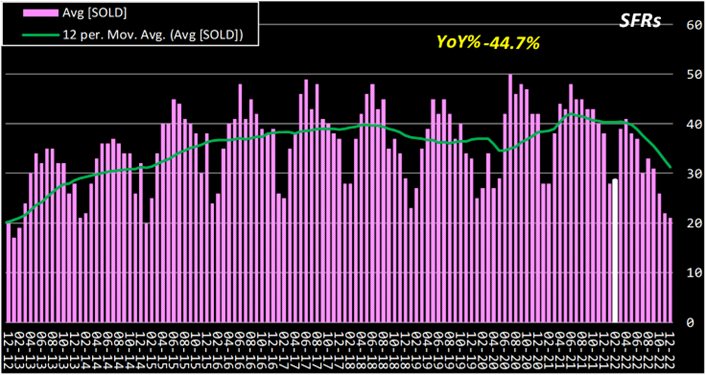
- Average SOLD listings for the last 10 years in December is 34.
- This Average decreased 45% from 2021.
5
- The 45% annual decrease of SOLD listings correlates to mortgage rates.
- Rate went above 5% in March 2022 for the 1st time since September 2009. The obvious pattern was abruptly changed.
6
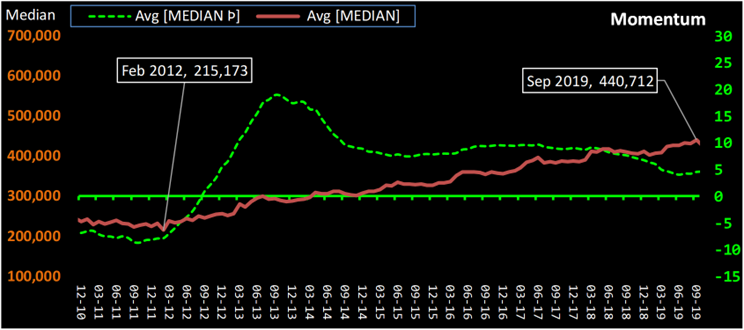
- From the low of $215,173 in February 2012, the Average Median Price appreciated over 100% to $440,712 in September 2019. (15% annually)
- Average Momentum was heading toward the zero axis at the end of 2019.
7
- From the 2019 low of $417,135 in November, the Average Median Price appreciated 50% to $627,173 in May 2022. (42% annually)
- Average Momentum spiked from 2019 through 2021 and has again headed toward zero.
8
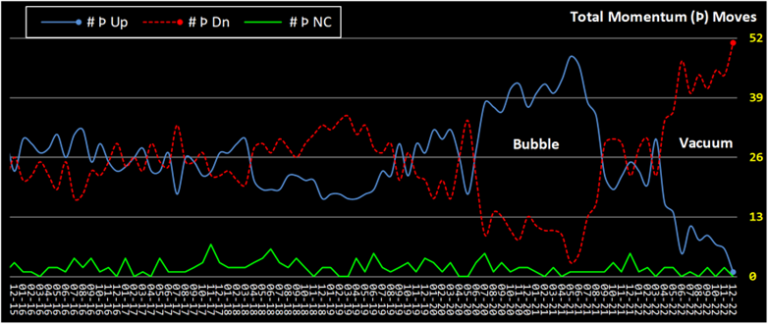
- My Momentum Swing Indicator shows the market bubbles and resulting vacuums. The “covid” bubble has created its own vacuum.
- Markets go through times of growth and decay. Inordinate growth begets inordinate decay.
9
- East Sacramento 95819 is the 1st zip code tracked where its Median Price Momentum has crossed the zero axis (less than zero).
- Commodity traders use this momentum value to trigger “sell” actions.
10
No other agent knows the data like I do.
Jay Emerson, Broker
Masters Club – Outstanding Life Member – DRE#1788488
Sac Metro Zip Codes Charted
Fair Oaks 95628 – Folsom 95630 – Roseville 95661 95678 95747 – Orangevale 95662 – El Dorado Hills 95762 – Carmichael 95608 – Citrus Heights 95610 95621 – Elk Grove 95624 95757 95758 – Placerville 95667 – Auburn 95603 – Lincoln 95648 – Rocklin 95677 95765 – Rancho Cordova 95670 95742
(Zip Codes web page) West Sac 95605 – West Sac 95691 – Loomis 95650 – North Highlands 95660 – Rio Linda 95673 – Cameron Park 95682 – Pollock Pines 95726 – Granite Bay 95746 – Arden 95815 – Downtown 95816 – Oak Park 95817 – Land Park 95818 – East Sac 95819 – Elder Creek 95820 – Arden 95821 – Greenhaven 95822 – Franklin 95823 – Fruitridge 95824 – Arden 95825 – College Greens 95826 – Rosemont 95827 – Florin 95828 – Vineyard 95829 – Pocket 95831 – Natomas 95833 – Natomas 95834 – Natomas 95835 – Del Paso Hts 95838 – North Sac 95841 – Foothill Farms 95842 – Antelope 95843 – Arden 95864

