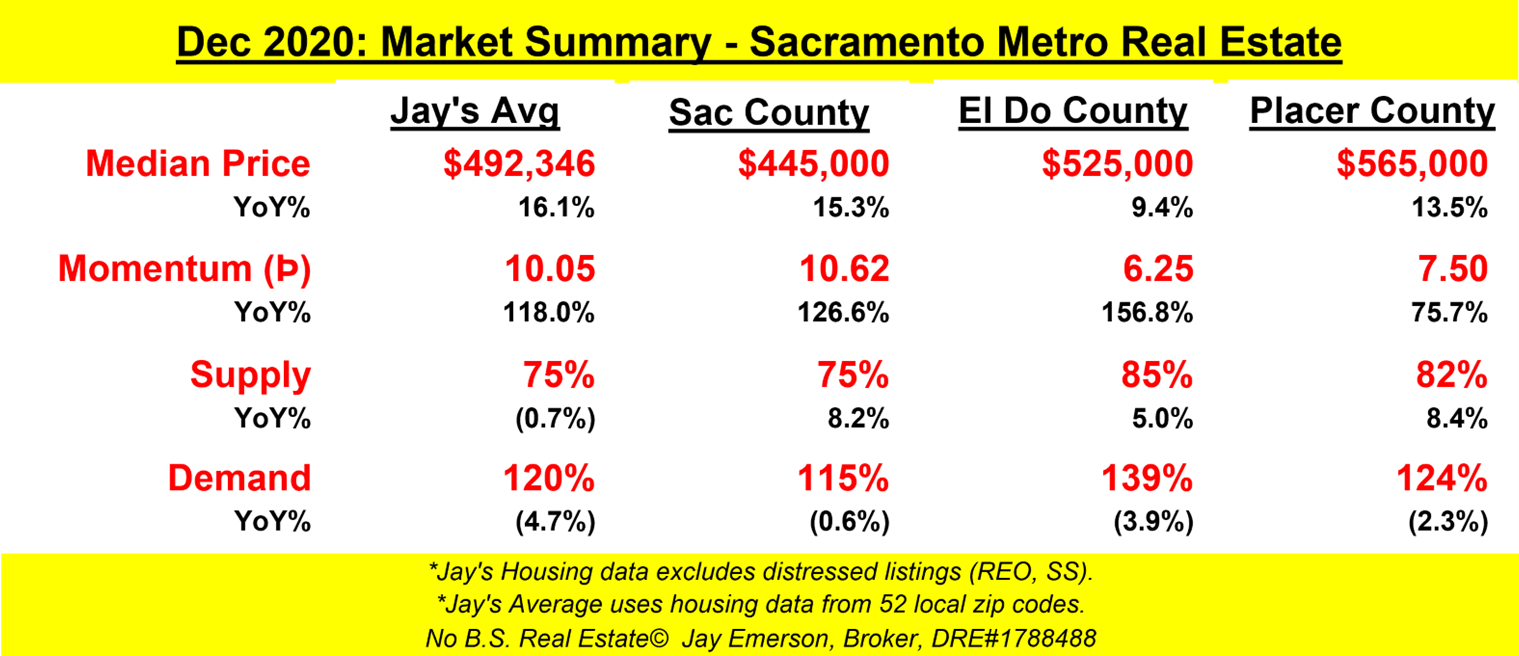
January 2021 - Sacramento Metro
Real Estate Market Update
“Months” or “Days” of Inventory, the year has given us more to ponder. Market resilience and weakness are frequently confused. In any market, someone is selling and / or buying real estate. This market is no different. Rates are low and portfolio choices are motivating the use of cash to buy residential or rental real estate. When a market defies gravity, it should not be construed as resilient. (Money is cheap; dirt is better than bitcoin.)
The year 2020, in hindsight (), presented unique circumstances and tragedies for most real estate sellers and buyers. The utter disappearance of housing supply, whether due to the virus or other reasons, caused a flurry of activity from buyers who were NOT at risk and felt the urge to buy. When the urge to buy exceeds the urge to sell, prices go up and appraisers can’t dampen it on their own.
Speaking of appraisers, they are in a tight spot. Beyond me showing my clients data on sales prices on a price-trend-analysis, knowing they are paying high prices just to win a seller’s favor, appraisers must do extra investigations to know if comparables used appraisals or all-cash. And whether that appraiser adjusts the appraisal results based on that investigation is another question. The first question is if the general appraisal process feels a “need to dampen” the consequences of supply and demand.
“Natural results” is a term that can be a “misnomer”. This market and year was not natural. And the market participants don’t know what to expect. The data screams “sellers market” at these levels. If you are a seller and you have a clean house, there are multiple buyers waiting for you to list. Buyers are watching every internet site they know to see new listings quicker than others. Buyers are weary from losing. (I don’t get paid to write offers.)
Sellers are cocooning or have already moved out of California. Migration from the Bay Area is an obvious source of demand and money. The cost of living is lower in the Sacramento Metropolitan area and many can work exclusively from a remote location. My preference would be to work from my ramada in the backyard.
People, however, are my business. Without personal (belly to belly) interactions, it defies the fundamental benefits in having your own representation in a litigious endeavor. And the law requires my “belly to property” interaction since I’m guilty if there is no visual inspection DONE BY ME.
The real estate market is easy to explain — seller trades product (house) for buyer product (money) — but not easy to navigate. When sellers have to disclose their natural hazards, their property history and defects, whether water fixtures are compliant, whether detectors are installed, whether the permits were finalized, etcetera, there are many areas that can be left exposed to angry buyers and their hungry lawyers. When buyers have competition that is flush with cash, pre-approved, waives contingencies, and closes quickly, that creates a mass psychology among buyers to either sit out or compete with fervor.
What are your experiences in this market? Do you get to sit and watch?
Call or refer me to your friends and family. I’m never too busy for your referrals.
County real estate results can be found here: https://www.jayemerson.com/counties
Jay’s Averages can be found here: https://www.jayemerson.com/averages
P.S., my website only points to Parler and Pinterest for sharing. Please do that.
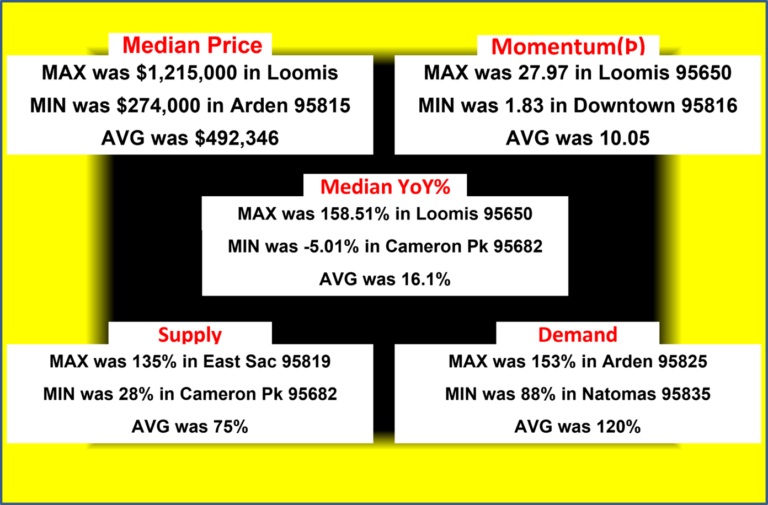
Max Min and Avg for the Month
Maximizing your profits as a home seller requires the exclusive use of TIME to trigger your selling decision (if you choose to sell). Real estate is still the only asset which has never gone to zero. Plenty of common stocks, hedge-funds, and other vehicles have a “risk of principle loss”. While there are theories that contest my experience, I have yet to see any home reach a value of $0.00. But being forced to sell at a relatively bad time can mean lower profit or, in extreme cases (Short Sale), a loss. The housing market is not forgiving.
Because of the physical nature of a real parcel (“dirt”), it is considered a commodity like precious metals. And like a seller of precious metals, the momentum of the price change is used to more accurately time (verb) the buying and selling actions a seller makes. Unless the trader or seller has different reasons to sell, it is preferable to sell at exactly the highest point possible. And that is VERY hard to foresee. Even momentum typically lags the top and bottom.
To use momentum, a seller can’t have other reasons to sell. Rather, the seller must ONLY trigger their Sell/Buy actions based on the momentum value and direction. Being forced to sell at any other time would thereby miss the peak or trough indicated by the area’s momentum. Momentum value, when positive, tells a trader to “buy”. When it’s negative, it’s time to “sell”. When momentum crosses that Zero axis, it is the sign/trigger for the sell/buy action. But, peaks may occur before or after the trigger. So perfection is only possible using Time Travel. They don’t offer a license for that profession.
Sacramento County area details
- Carmichael 95608, 12/2020 – Median $488K, (Þ▲,MoM▲10.7%,YoY▲19.0%) – 71% of avg 7Yr December Supply – 130% of avg 7Yr December Demand – 0.6 months of inventory
- Citrus Hts 95610, 12/2020 – Median $435K (NEW HIGH), (Þ▲,MoM▲1.4%,YoY▲13.9%) – 62% of avg 7Yr December Supply – 109% of avg 7Yr December Demand – 0.3 months of inventory
- Citrus Hts 95621, 12/2020 – Median $400K (NEW HIGH), (Þ▲,MoM▲1.5%,YoY▲17.6%) – 60% of avg 7Yr December Supply – 122% of avg 7Yr December Demand – 0.1 months of inventory
- Elk Grove 95624, 12/2020 – Median $509K, (Þ▲,MoM▼-1.2% ,YoY▲13.4%) – 50% of avg 7Yr December Supply – 108% of avg 7Yr December Demand – 0.4 months of inventory
- Fair Oaks 95628, 12/2020 – Median $520K, (Þ▼,MoM▼-5.8% ,YoY▲6.8%) – 63% of avg 7Yr December Supply – 119% of avg 7Yr December Demand – 0.5 months of inventory
- Folsom 95630, 12/2020 – Median $618K, (Þ▼,MoM▼-4.6% ,YoY▲6.6%) – 77% of avg 7Yr December Supply – 126% of avg 7Yr December Demand – 0.4 months of inventory
- North Hilnds 95660, 12/2020 – Median $340K (NEW HIGH), (Þ▲,MoM▲3.0%,YoY▲25.5%) – 64% of avg 7Yr December Supply – 100% of avg 7Yr December Demand – 0.3 months of inventory
- Orangevale 95662, 12/2020 – Median $435K, (Þ▼,MoM▼-6.5% ,YoY▲2.8%) – 57% of avg 7Yr December Supply – 126% of avg 7Yr December Demand – 0.3 months of inventory
- Rancho Cord 95670, 12/2020 – Median $395K, (Þ▲,MoM▼-6.6% ,YoY▲12.5%) – 60% of avg 7Yr December Supply – 109% of avg 7Yr December Demand – 0.3 months of inventory
- Rio Linda 95673, 12/2020 – Median $360K, (Þ▼,MoM▼-1.4% ,YoY▲5.9%) – 72% of avg 7Yr December Supply – 93% of avg 7Yr December Demand – 0.5 months of inventory
- Rancho Cord 95742, 12/2020 – Median $513K, (Þ◄►,MoM▲0.6%,YoY▲9.1%) – 51% of avg 7Yr December Supply – 128% of avg 7Yr December Demand – 0.2 months of inventory
- Elk Grove 95757, 12/2020 – Median $538K, (Þ▲,MoM▼-2.2% ,YoY▲11.2%) – 46% of avg 7Yr December Supply – 91% of avg 7Yr December Demand – 0.1 months of inventory
- Elk Grove 95758, 12/2020 – Median $460K, (Þ▲,MoM▼-0.2% ,YoY▲10.8%) – 51% of avg 7Yr December Supply – 116% of avg 7Yr December Demand – 0.2 months of inventory
- Arden 95815, 12/2020 – Median $274K, (Þ▼,MoM▼-8.7% ,YoY▲0.7%) – 74% of avg 7Yr December Supply – 130% of avg 7Yr December Demand – 1.0 months of inventory
- Downtown 95816, 12/2020 – Median $675K, (Þ▲,MoM▲12.5%,YoY▲19.5%) – 72% of avg 7Yr December Supply – 118% of avg 7Yr December Demand – 0.7 months of inventory
- Oak Park 95817, 12/2020 – Median $467K (NEW HIGH), (Þ▲,MoM▲6.1%,YoY▲35.8%) – 84% of avg 7Yr December Supply – 117% of avg 7Yr December Demand – 0.8 months of inventory
- Land Park 95818, 12/2020 – Median $620K, (Þ▼,MoM▲7.8%,YoY▲4.2%) – 83% of avg 7Yr December Supply – 136% of avg 7Yr December Demand – 0.5 months of inventory
- East Sac 95819, 12/2020 – Median $769K (NEW HIGH), (Þ▲,MoM▲9.9%,YoY▲31.9%) – 135% of avg 7Yr December Supply – 145% of avg 7Yr December Demand – 0.9 months of inventory
- Elder Creek 95820, 12/2020 – Median $340K, (Þ▲,MoM▼-11.0% ,YoY▲21.9%) – 76% of avg 7Yr December Supply – 93% of avg 7Yr December Demand – 0.6 months of inventory
- Arden 95821, 12/2020 – Median $405K, (Þ▼,MoM▼-4.0% ,YoY▲5.7%) – 44% of avg 7Yr December Supply – 124% of avg 7Yr December Demand – 0.2 months of inventory
- Greenhaven 95822, 12/2020 – Median $390K, (Þ▲,MoM▲2.6%,YoY▲23.8%) – 48% of avg 7Yr December Supply – 91% of avg 7Yr December Demand – 0.3 months of inventory
- Franklin 95823, 12/2020 – Median $350K, (Þ▲,MoM▼-1.7% ,YoY▲16.7%) – 55% of avg 7Yr December Supply – 103% of avg 7Yr December Demand – 0.3 months of inventory
- Fruitridge 95824, 12/2020 – Median $295K, (Þ▼,MoM▼-1.7% ,YoY▲10.5%) – 66% of avg 7Yr December Supply – 101% of avg 7Yr December Demand – 0.8 months of inventory
- Arden 95825, 12/2020 – Median $419K, (Þ▼,MoM▲5.0%,YoY▼-2.1%) – 91% of avg 7Yr December Supply – 153% of avg 7Yr December Demand – 0.6 months of inventory
- College Greens 95826, 12/2020 – Median $403K (NEW HIGH), (Þ▲,MoM▲2.8%,YoY▲17.5%) – 66% of avg 7Yr December Supply – 99% of avg 7Yr December Demand – 0.2 months of inventory
- Rosemont 95827, 12/2020 – Median $410K (NEW HIGH), (Þ▲,MoM▲6.5%,YoY▲25.8%) – 37% of avg 7Yr December Supply – 105% of avg 7Yr December Demand – 0.1 months of inventory
- Florin 95828, 12/2020 – Median $391K (NEW HIGH), (Þ▲,MoM▲4.3%,YoY▲27.4%) – 60% of avg 7Yr December Supply – 98% of avg 7Yr December Demand – 0.4 months of inventory
- Vineyard 95829, 12/2020 – Median $470K, (Þ▼,MoM▼-10.5% ,YoY▲5.6%) – 71% of avg 7Yr December Supply – 95% of avg 7Yr December Demand – 0.8 months of inventory
- Pocket 95831, 12/2020 – Median $570K, (Þ▼,MoM▲4.6%,YoY▲6.9%) – 56% of avg 7Yr December Supply – 96% of avg 7Yr December Demand – 0.4 months of inventory
- Freeport 95832, 12/2020 – Median $400K, (Þ▲,MoM▲21.2%,YoY▲48.1%) – 49% of avg 7Yr December Supply – 91% of avg 7Yr December Demand – 0.7 months of inventory
- Natomas 95833, 12/2020 – Median $415K (NEW HIGH), (Þ▲,MoM▲7.2%,YoY▲18.6%) – 66% of avg 7Yr December Supply – 131% of avg 7Yr December Demand – 0.3 months of inventory
- Natomas 95834, 12/2020 – Median $428K, (Þ▲,MoM▼-0.7% ,YoY▲14.1%) – 67% of avg 7Yr December Supply – 106% of avg 7Yr December Demand – 0.4 months of inventory
- Natomas 95835, 12/2020 – Median $477K, (Þ▲,MoM▲5.3%,YoY▲17.8%) – 56% of avg 7Yr December Supply – 88% of avg 7Yr December Demand – 0.3 months of inventory
- Del Paso Hts 95838, 12/2020 – Median $330K (NEW HIGH), (Þ▲,MoM▲0.6%,YoY▲13.8%) – 69% of avg 7Yr December Supply – 105% of avg 7Yr December Demand – 0.9 months of inventory
- North Sac 95841, 12/2020 – Median $389K, (Þ▲,MoM▲7.8%,YoY▲15.1%) – 35% of avg 7Yr December Supply – 116% of avg 7Yr December Demand – 0.4 months of inventory
- Foothill Frms 95842, 12/2020 – Median $360K, (Þ▲,MoM▼-2.2% ,YoY▲13.2%) – 77% of avg 7Yr December Supply – 135% of avg 7Yr December Demand – 0.1 months of inventory
- Antelope 95843, 12/2020 – Median $432K (NEW HIGH), (Þ▲,MoM▲4.3%,YoY▲17.7%) – 35% of avg 7Yr December Supply – 116% of avg 7Yr December Demand – 0.2 months of inventory
- Arden 95864, 12/2020 – Median $524K, (Þ▼,MoM▼-18.8% ,YoY▼-4.7%) – 77% of avg 7Yr December Supply – 129% of avg 7Yr December Demand – 0.8 months of inventory
El Dorado County area details
- Placerville 95667, 12/2020 – Median $431K, (Þ▼,MoM▼-7.5% ,YoY▲8.0%) – 65% of avg 7Yr December Supply – 144% of avg 7Yr December Demand – 0.8 months of inventory
- Cameron Pk 95682, 12/2020 – Median $531K, (Þ▼,MoM▼-10.3% ,YoY▼-5.0%) – 28% of avg 7Yr December Supply – 106% of avg 7Yr December Demand – 0.2 months of inventory
- El Dorado Hills 95762, 12/2020 – Median $789K (NEW HIGH), (Þ▲,MoM▲4.1%,YoY▲25.6%) – 64% of avg 7Yr December Supply – 126% of avg 7Yr December Demand – 0.6 months of inventory
Placer County area details
- Auburn 95603, 12/2020 – Median $568K, (Þ▲,MoM▼-4.2% ,YoY▲13.8%) – 73% of avg 7Yr December Supply – 124% of avg 7Yr December Demand – 1.2 months of inventory
- Lincoln 95648, 12/2020 – Median $515K, (Þ▲,MoM◄►0.0%,YoY▲8.4%) – 84% of avg 7Yr December Supply – 122% of avg 7Yr December Demand – 0.6 months of inventory
- Loomis 95650, 12/2020 – Median $1,215K (NEW HIGH), (Þ▲,MoM▲13.0%,YoY▲158.5%) – 94% of avg 7Yr December Supply – 148% of avg 7Yr December Demand – 0.9 months of inventory
- Roseville 95661, 12/2020 – Median $598K, (Þ▲,MoM▲4.0%,YoY▲8.9%) – 55% of avg 7Yr December Supply – 107% of avg 7Yr December Demand – 0.2 months of inventory
- Rocklin 95677, 12/2020 – Median $585K, (Þ▲,MoM▼-2.5% ,YoY▲27.2%) – 77% of avg 7Yr December Supply – 133% of avg 7Yr December Demand – 0.4 months of inventory
- Roseville 95678, 12/2020 – Median $475K, (Þ▲,MoM▲3.9%,YoY▲11.2%) – 60% of avg 7Yr December Supply – 91% of avg 7Yr December Demand – 0.2 months of inventory
- Granite Bay 95746, 12/2020 – Median $905K, (Þ▼,MoM▼-15.5% ,YoY▲6.1%) – 57% of avg 7Yr December Supply – 130% of avg 7Yr December Demand – 0.8 months of inventory
- Roseville 95747, 12/2020 – Median $546K (NEW HIGH), (Þ▲,MoM▲4.0%,YoY▲8.3%) – 46% of avg 7Yr December Supply – 117% of avg 7Yr December Demand – 0.2 months of inventory
- Rocklin 95765, 12/2020 – Median $565K, (Þ▲,MoM▼-3.1% ,YoY▲6.6%) – 55% of avg 7Yr December Supply – 125% of avg 7Yr December Demand – 0.3 months of inventory