December 2020 - Sacramento Metro
Real Estate Market Update
Emerson Real Estate is my new brokerage, if you haven’t heard. From the day I earned my Broker’s license, it was just a matter of time for me to “fly my own flag”. Some day, there may be sub-agents.
Over the years, Steve Galster had been my broker and me an Associate Broker (still a sub-agent). He is the best to learn from and I will always trust his agents to be ethical and responsive. He made me that way.
The time had come for me to entertain the suffering that comes with the blessing of flying my flag. These are interesting times to choose this path. But if not now, when? Please let me know your feedback on this newsletter. And I’m never too busy for you or your referrals.
Current Market
This commentary is my opinion of the Sacramento Metro real estate housing market using history, current conditions, and the market forces. This is not a crystal ball. If I had guarantees, I would not be writing this piece.
Selling a home is easy although there are some which are over-priced and must wait for their first showing. Everyone is selling except those who are waiting. Now that winter is here, “cocoons” begin to form and listings dwindle. But that has been our market for 9+ months — NO LISTINGS. If you have one, clean it up, price it well, make it available, and have a place to move in 30 days, it will sell.
Interest rates and people opting to put money in “dirt” are driving prices to new highs each month. There were 16 new highs this month. Momentum is positive for 54 of the 55 prices tracked. That tells a trader to buy or to sell if the trader thinks the market is turning. It’s these months that momentum needs a forecast tool.
Real estate is still being corrupted by State regulations, taxes, and demographic changes forced by irregular or illogical costs and opportunities. We are truly experiencing an exodus from California because thriving is harder.
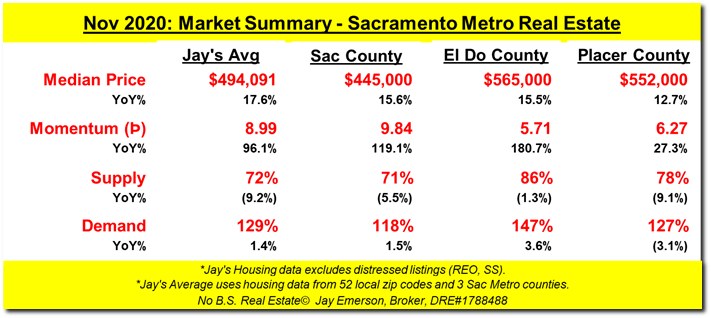
Max Min and Avg for the Month
Median Price
MAX was $1,150,000 in Loomis 95650,
MIN was $300,000 in Arden 95815,
AVG was $494,091
Median MoM%
MAX was 21.05% in Loomis 95650,
MIN was -20.53% in North Sac 95841,
AVG was 2.3%
Median YoY%
MAX was 106.09% in Loomis 95650,
MIN was -9.59% in Freeport 95832,
AVG was 17.6%
Months of Inventory
MAX was 2.0 in Fruitridge 95824,
MIN was 0.2 in Elk Grove 95757,
AVG was 0.7
Supply
MAX was 116% in East Sac 95819,
MIN was 33% in Greenhaven 95822,
AVG was 72%
Demand
MAX was 167% in Arden 95825,
MIN was 86% in Downtown 95816,
AVG was 129%
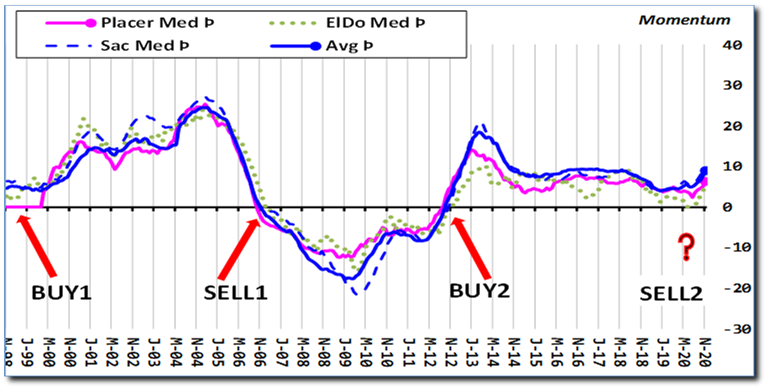
Using Momentum to Maximize Profits
Maximizing your profits as a home seller requires the exclusive use of TIME to trigger your selling decision (if you choose to sell). Real estate is still the only asset which has never gone to zero. Plenty of common stocks, hedge-funds, and other vehicles have a “risk of principle loss”. While there are theories that contest my experience, I have yet to see any home reach a value of $0.00. But being forced to sell at a relatively bad time can mean lower profit or, in extreme cases (Short Sale), a loss. The housing market is not forgiving.
Because of the physical nature of a real parcel (“dirt”), it is considered a commodity like precious metals. And like a seller of precious metals, the momentum of the price change is used to more accurately time (verb) the buying and selling actions a seller makes. Unless the trader or seller has different reasons to sell, it is preferable to sell at exactly the highest point possible. And that is VERY hard to foresee. Even momentum typically lags the top and bottom.
To use momentum, a seller can’t have other reasons to sell. Rather, the seller must ONLY trigger their Sell/Buy actions based on the momentum value and direction. Being forced to sell at any other time would thereby miss the peak or trough indicated by the area’s momentum. Momentum value, when positive, tells a trader to “buy”. When it’s negative, it’s time to “sell”. When momentum crosses that Zero axis, it is the sign/trigger for the sell/buy action. But, peaks may occur before or after the trigger. So perfection is only possible using Time Travel. They don’t offer a license for that profession.
Sacramento County area details
Carmichael 95608, 11/2020 – Median $439K, (Þ▼,MoM▼-12.7% ,YoY▼-2.4%) – 63% of avg 7Yr November Supply – 131% of avg 7Yr November Demand
Citrus Hts 95610, 11/2020 – Median $425K, (Þ▲,MoM▼-0.2% ,YoY▲16.4%) – 69% of avg 7Yr November Supply – 109% of avg 7Yr November Demand
Citrus Hts 95621, 11/2020 – Median $397K (NEW HIGH), (Þ▲,MoM▲6.1%,YoY▲17.1%) – 66% of avg 7Yr November Supply – 127% of avg 7Yr November Demand
Fair Oaks 95628, 11/2020 – Median $568K, (Þ▲,MoM▲17.1%,YoY▲21.4%) – 62% of avg 7Yr November Supply – 145% of avg 7Yr November Demand
Folsom 95630, 11/2020 – Median $644K (NEW HIGH), (Þ▲,MoM▲7.2%,YoY▲15.2%) – 75% of avg 7Yr November Supply – 124% of avg 7Yr November Demand
Orangevale 95662, 11/2020 – Median $465K, (Þ▲,MoM▼-2.7% ,YoY▲19.5%) – 76% of avg 7Yr November Supply – 138% of avg 7Yr November Demand
Rancho Cord 95670, 11/2020 – Median $423K, (Þ▲,MoM▲7.1%,YoY▲16.5%) – 57% of avg 7Yr November Supply – 96% of avg 7Yr November Demand
Rancho Cord 95742, 11/2020 – Median $505K, (Þ▲,MoM▲1.8%,YoY▲16.1%) – 79% of avg 7Yr November Supply – 149% of avg 7Yr November Demand
Rosemont 95827, 11/2020 – Median $385K, (Þ▲,MoM▼-2.0% ,YoY▲13.2%) – 74% of avg 7Yr November Supply – 115% of avg 7Yr November Demand
Vineyard 95829, 11/2020 – Median $525K (MATCHED HIGH), (Þ▲,MoM◄►0.0%,YoY▲31.3%) – 57% of avg 7Yr November Supply – 101% of avg 7Yr November Demand
El Dorado County area details
Cameron Pk 95682, 11/2020 – Median $594K (NEW HIGH), (Þ▲,MoM▲12.7%,YoY▲13.1%) – 54% of avg 7Yr November Supply – 115% of avg 7Yr November Demand
El Dorado Hills 95762, 11/2020 – Median $760K, (Þ▲,MoM▲3.4%,YoY▲10.1%) – 68% of avg 7Yr November Supply – 140% of avg 7Yr November Demand
Placerville 95667, 11/2020 – Median $466K, (Þ▼,MoM▲2.0%,YoY▲8.4%) – 74% of avg 7Yr November Supply – 160% of avg 7Yr November Demand
Placer County area details
Auburn 95603, 11/2020 – Median $593K (NEW HIGH), (Þ▲,MoM▲8.0%,YoY▲21.3%) – 74% of avg 7Yr November Supply – 122% of avg 7Yr November Demand
Granite Bay 95746, 11/2020 – Median $1,071K, (Þ▲,MoM▲1.5%,YoY▲52.3%) – 70% of avg 7Yr November Supply – 121% of avg 7Yr November Demand
Lincoln 95648, 11/2020 – Median $515K, (Þ▼,MoM▼-1.0% ,YoY▲2.0%) – 74% of avg 7Yr November Supply – 105% of avg 7Yr November Demand
Loomis 95650, 11/2020 – Median $1,150K, (Þ▲,MoM▲21.1%,YoY▲106.1%) – 71% of avg 7Yr November Supply – 128% of avg 7Yr November Demand
Rocklin 95677, 11/2020 – Median $600K (NEW HIGH), (Þ▲,MoM▲11.3%,YoY▲29.0%) – 80% of avg 7Yr November Supply – 154% of avg 7Yr November Demand
Rocklin 95765, 11/2020 – Median $575K, (Þ▲,MoM▲0.5%,YoY▲15.2%) – 61% of avg 7Yr November Supply – 162% of avg 7Yr November Demand
Roseville 95661, 11/2020 – Median $580K, (Þ▲,MoM▼-1.4% ,YoY▲10.9%) – 60% of avg 7Yr November Supply – 125% of avg 7Yr November Demand
Roseville 95678, 11/2020 – Median $457K, (Þ▲,MoM▼-0.7% ,YoY▲11.5%) – 64% of avg 7Yr November Supply – 92% of avg 7Yr November Demand
Roseville 95747, 11/2020 – Median $525K, (Þ▲,MoM▼-2.8% ,YoY▲11.7%) – 55% of avg 7Yr November Supply – 133% of avg 7Yr November Demand