Fair Oaks Market Update
Momentum Starts a Vacuum
As though physics is involved, a “bubble” in momenta is followed by a “vacuum” of equivalent height and duration. If that is true, we will see a vacuum over the next year. Vacuums indicate persistent price reductions.

Most likely helpful to that happening is another “gut punch” for market participants. Sellers and buyers are motivated to participate but now must adjust to the changes forced by the recent NAR settlement. We don’t need another punch in the gut. The exodus from California, the change in the Presidency, the spike in mortgage rate and the unjustified lockdown are still affecting the market. We don’t need another.
My Swing Indicator is a combination of all momentum moves. Each price momentum measurement has 3 possible values — up, down, no change. Commodity traders use momentum of the price change to determine buy, sell, or hold of the commodity. The trigger, though, is when momentum crosses the zero axis. (Negative = sell, Positive = buy). Real estate is a commodity. The future value can be (in theory) projected. But real estate is not as liquid nor does it trade in short durations.
The shapes in this chart are results of the corruption of the market by external forces. AKA “gut punches”.
Fair Oaks Median and Momentum
The Fair Oaks median price, its 12-month moving average, and its momentum are charted below. Median price, as indicated by its momentum, spiked when the lockdowns created a fear (FOMO) in buyers. The psychology of buyers quickly created a flurry of sales BUT sellers were motivated to NOT list their houses (or the CA exodus exhausted normal inventories).
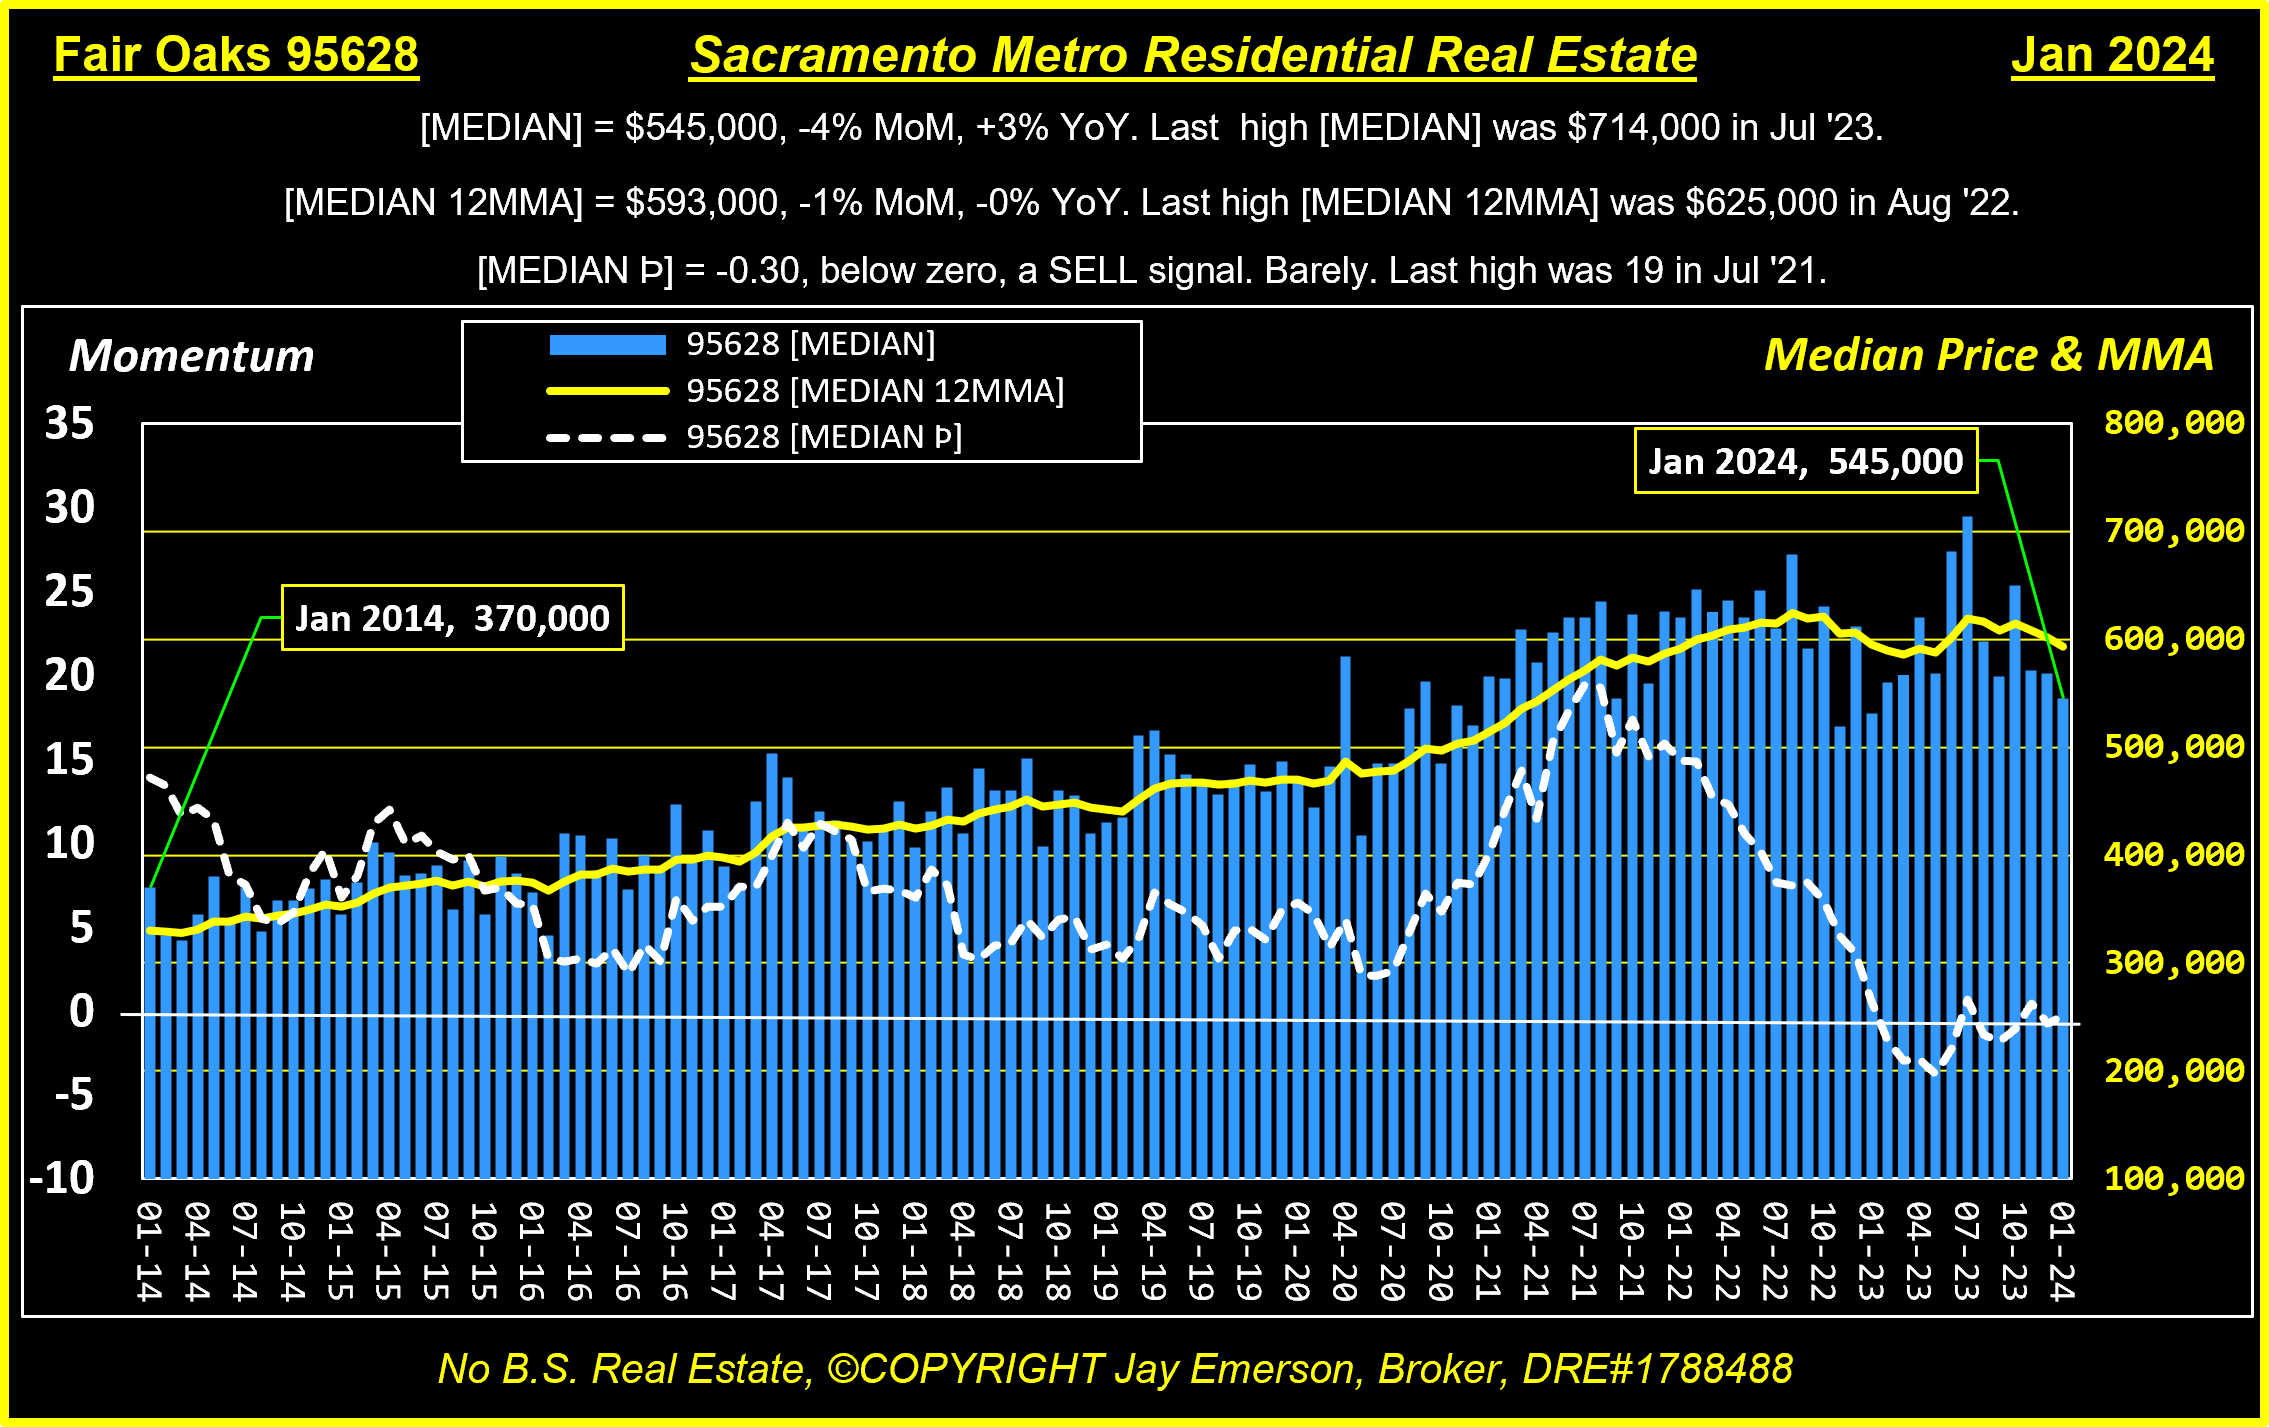
[MEDIAN] = $640,000, +4% MoM, -10% YoY. Last high [MEDIAN] was $714,000 in Jul ’23.
[MEDIAN 12MMA] = $610,000, +1% MoM, -1% YoY. Last high [MEDIAN 12MMA] was $625,000 in Aug ’22.
[MEDIAN Þ] = -1.46, below zero, a SELL signal. Last high was 19 in Jul ’21.
[MEDIAN Þ] peaked in Jul ’21, [MEDIAN] peaked in Jul ’23,
[MEDIAN 12MMA] peaked in Aug ’22.
Fair Oaks 95628 Median Appreciation Jul-2014 to Jul-2024 = 72%
Months of Inventory
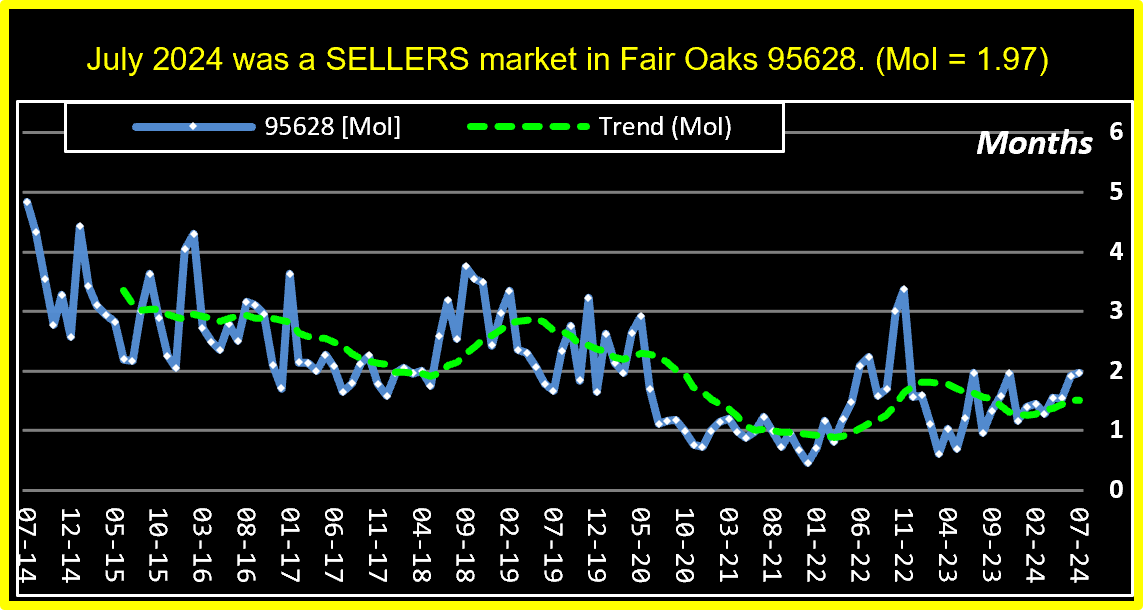
July 2024 was a SELLERS market in Fair Oaks. (MoI = 1.97). Months of Inventory (MoI, right), a calculation used to quickly indicate for whom the real estate market favors, is less than 2. It is a seller’s market by definition. A buyer’s market is indicated by a MoI indicator above 5 or 6. A neutral market is between 3 and 5. This market hasn’t seen 4 Months of Inventory since 2015. We have been in a seller’s market for almost 10 years. Neutral and stable markets have more inventory and activity than we are seeing. There are many forces that affect supply and demand. Sellers are fleeing California which leaves fewer sellers AND buyers. And now a NAR settlement is sure to have some affect on activity. (Whoever lacks tax receipts will yell loudest and soonest.)
Lean Score
Lean Score a proprietary indicator for each zip code tracked in my system. Much like MoI, my intent is to show “who is favored”. As a seller’s house starts as a [NEW] listing, becomes [PENDED], and then likely [SOLD], each “phase” represents a result of supply and/or demand. At the end of the month, remaining inventory of [ACTIVE] and even [CANC] (canceled) help tell the story of activity. These are all statuses that a listing will be in the life of that listing (but never at the same time). So the mass and movement of a market’s listings through each status is important to the story. We have to go beyond “Months of Inventory”, although the resulting conclusion could be identical.
When comparing historical data for each “phase” a listing traverses, calculations help tell the story of how that data item is “leaning”, whether toward sellers, buyers, or neither.
For example in July,
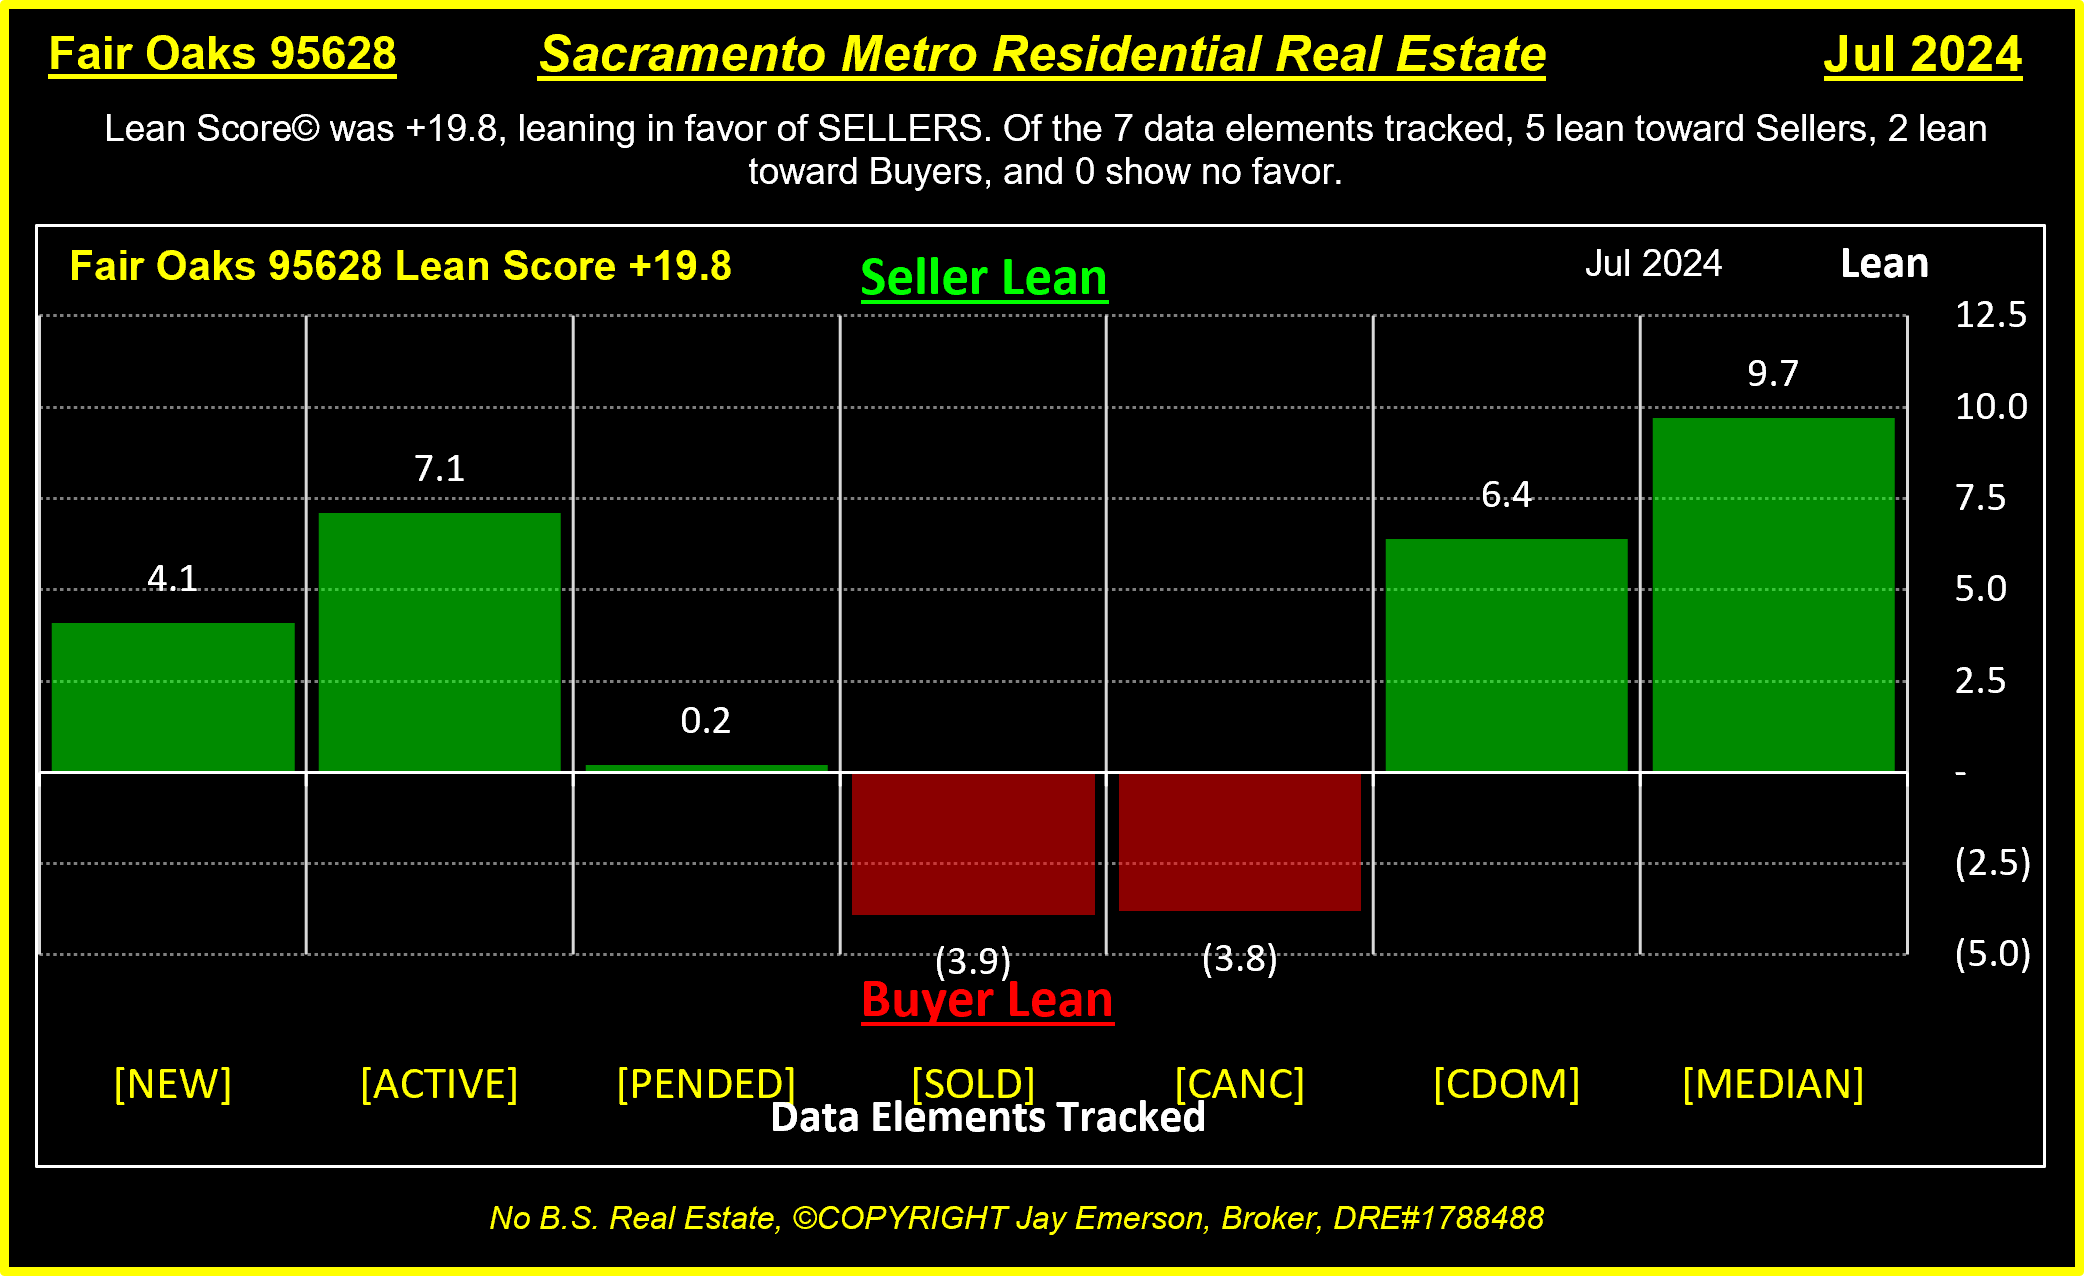
- [NEW] listings 10-Yr Avg = 61 which is 79% of the Curr Mo of 48 giving it a 10-Yr Lean of 2.1, leaning toward sellers
- [NEW] listings 26-Yr Avg = 60 which is 80% of the Curr Mo of 48 giving it a 26-Yr Lean of 2, leaning toward sellers
- [NEW] listings Lean Score = 4.1, leaning toward sellers.
(The other 6 data elements are similarly compared with their histories. The chart is shown above.) - Lean Score© was +19.8, leaning in favor of SELLERS. Of the 7 data elements tracked, 5 lean toward Sellers, 2 lean toward Buyers, and 0 show no favor.
Gut Punch
A free market we don’t have. Forces abound that motivate selling and buying behaviors which don’t occur in free markets. In a free market, sellers are free to sell without being forced to answer to the State when escrow opens and closes. Buyers are free to buy a house without being forced to meet a lender’s checklist of tasks and deliverables. Home owners aren’t “chased” out of the state. Home buyers aren’t in fear of missing out.
There are a myriad of forces that surround our real estate market: rates, employment, regulation, taxes and safety are just a handful. The cost of money is critical to buyers who aren’t flush with cash. Good jobs are important to the health of the market and the ongoing concern called “ownership”. Legislators continue to show their ignorance by creating “point of sale” fees and regulations that impede timely success. And taxes, they get you coming and going. Likewise, increases in crime, without the desired increase in policing, are aiding in the erosion of allure in many local zip codes. Sellers are leaving the downtown areas. But gas prices are bringing sellers closer to their workplaces — IF they go to a workplace any more.
In comes a hoard of lawyers who think I have been participating in anti-trust behavior. They really can’t tell me why it’s anti-trust when most agents explain the math to their clients. Commission has become a dirty word. It wasn’t, and shouldn’t be, such a critical forethought in our market. Now a fiduciary has to violate their duties and make their compensation AS IMPORTANT as their client’s success. To clarify a commission before an offer is submitted is, in my opinion, a deviation from professionalism.
But one thing is for sure, the lawyers got paid. (They don’t work on commission — they get paid, success or not.)

Employment
Gross Domestic Product (GDP) is commonly used to indicate the health of our economy. It’s “gross” because there are no deductions [that would make it “net”]. But I believe it is misleading because we shouldn’t include government employment wages, pensions, and spending. They should also subtract taxes since both represent money that can no longer be used in “production”.
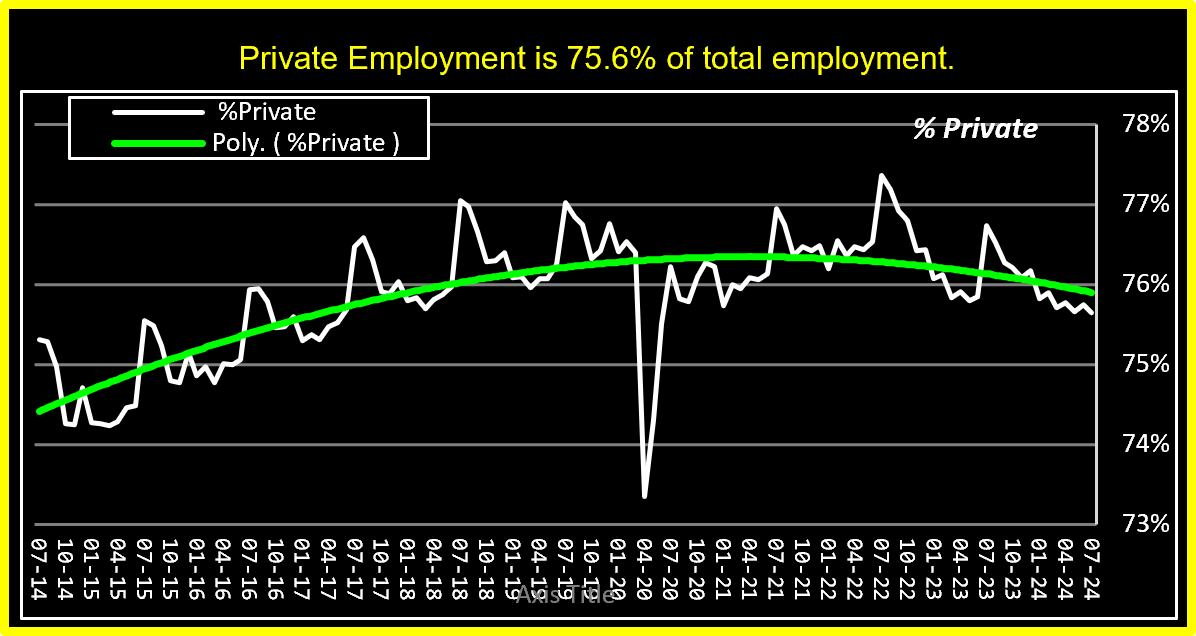
Since government employment, pensions and taxes (administering and collecting) are funded by tax payers (private), I have tracked and charted both Private and Government employment for decades. In my opinion, the ratio should NEVER exceed 20%. Here we are at 24%, and it’s getting worse. Soon, there will be 2 workers supporting 8 government pensioners. This will cause a crash when the government runs out of our money. And the $35 trillion debt will punctuate the crash. How do we pay that debt? What if my VISA card had a balance of even $250k? (Can you say “bankruptcy”?)
My opinion of government is not that it shouldn’t exist. Rather,
- public servants should be temporary workers,
- colleges should not offer a degree for “Public Administration/Service”,
- government workers, being temporary, should not rely on that stint for a pension [Lois Lerner],
- if a legislature leads a municipality into “the red”, their pay should be ceased,
- every new law requires that an old law be revoked,
- every program should measure and PROVE its return on spending EVERY year.
We will have to get serious about this absence of logic. The math doesn’t work.

Jay Emerson, Broker Masters Club – Outstanding Life Member – DRE#1788488 |