Market Update
Perspective
Fire is devastating lives and memories as I write this. Prayer is all I can give people affected by avoidable disasters. “Scorched earth” comes to mind. My professional colleagues need to remain ethical and moral. Fire is the ultimate “block-buster”.
December Update
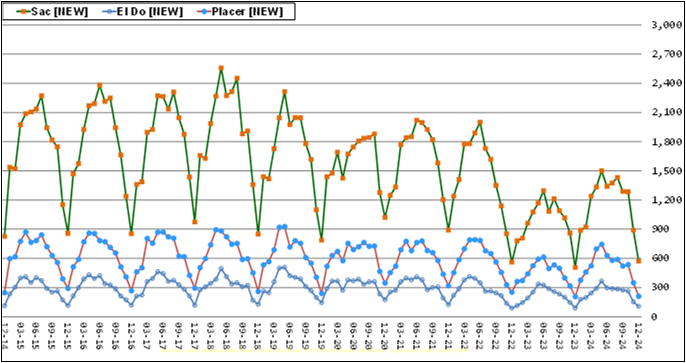
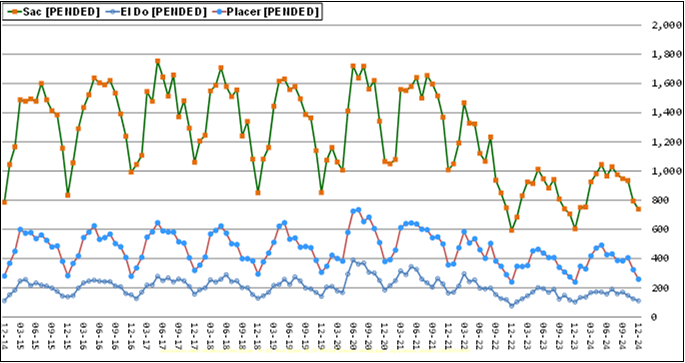
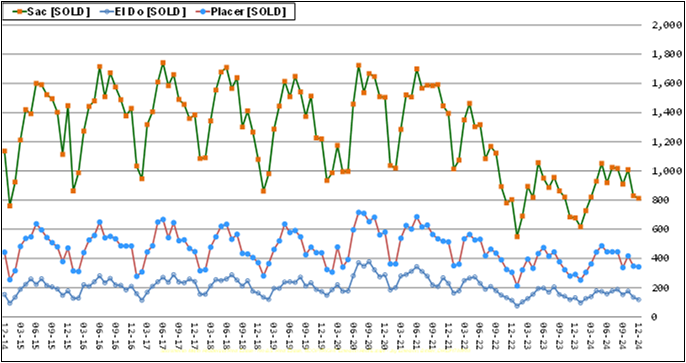
December 2024 Months of Inventory was 1.4, a SELLERS market in Sacramento County. Lean Score = 2.8, leaning toward Sellers. [MEDIAN] = $546,000, -2% MoM, +2% YoY. Last high was $575,000 in May ’22. Monthly Payment = $2,927. Qualifying Income = $140,477. Median Income = $84,000, HAI = 60%.
December 2024 Months of Inventory was 3.4, a SELLERS market in El Dorado County. Lean Score = 1.4, leaning toward Sellers. [MEDIAN]= $742,000, +14% MoM, +18% YoY. Last high was $758,000 in Apr ’24. Monthly Payment = $3,977. Qualifying Income = $190,905. Median Income = $99,000, HAI = 52%.
December 2024 Months of Inventory was 1.8, a SELLERS market in Placer County. Lean Score = 1.3, leaning toward Sellers. [MEDIAN]= $640,000, -1% MoM, +2% YoY. Last high was $738,000 in May ’22. Monthly Payment = $3,030. Qualifying Income = $145,461. Median Income = $109,375, HAI = 75%.
Market Forces
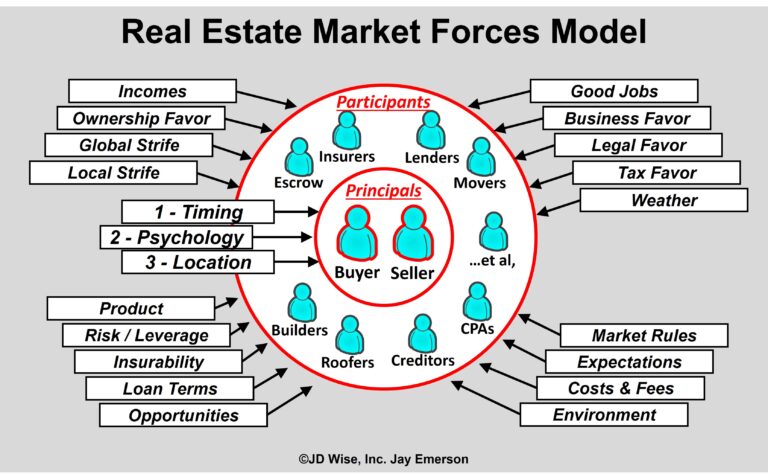
Selling a home is not easy. From preparation to exposure, negotiation and moving, pitfalls await those who dare it alone. There are many personal and external forces that affect housing supply (Sellers) and demand (Buyers). Over-priced and ill-prepared supply usually must wait longer for their first hint of demand. Price reductions are signs that the suppliers want or need to attract demand. Now that winter is here, “cocoons” begin to form and existing supply is canceled and new supply naturally dwindles. While supply dwindles, the demand, which doesn’t dwindle as much, thos who reduce or are priced at “that buyer’s equilibrium” have a better chance. But that has been our market for 3+ years — NO SUPPLY and Demand is still present. If you have a home and you wish to sell, clean it up, price it well, make it available, and have a place to move in 30 days. It will sell. (By the way, hire me first. I know the best way to minimize your risk and maximize your leverage.)
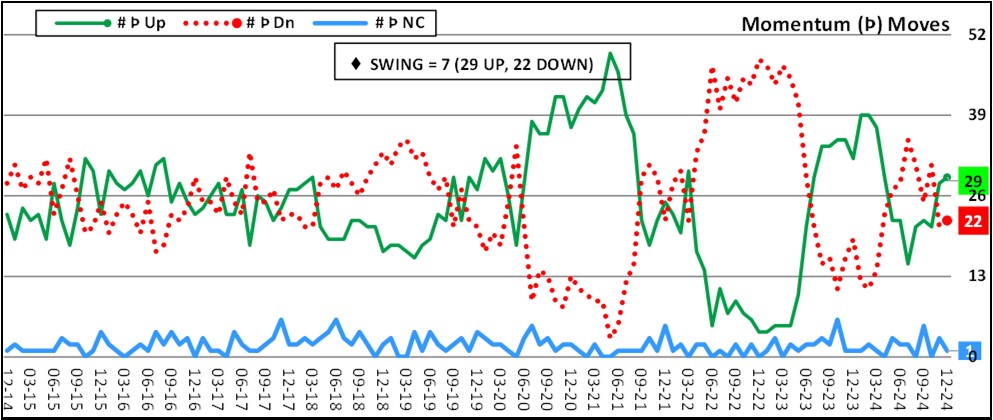
“Dirt” has become the new “gold” for people fleeing their failing coastal cities. High interest rates are making the “cash” option a preferable opportunity for buyers. This option to put money in “dirt” is driving prices to new highs each month. (Property Tax Assessors’ bank reserves will be thankful.) There were 5 new high Median Prices this month. Momentum is positive for 29 of the 52 prices tracked. Momentum tells a commodity trader to buy or to sell if the trader thinks the market is turning. It’s these months that momentum needs a forecast tool.
Real estate is still being corrupted by regulations, taxes, silly legislators, and demographic changes forced by irregular or illogical costs and opportunities. We are still experiencing an exodus from California because thriving is harder.
Momentum
The many forces that exist are trumped by those that affect Sellers and Buyers supremely: Timing, Psychology, Location. All forces result in the “fair market” conveyance of a commodity we call real property (residential, re-sale, non-distressed). I track and aggregate 52 local zip code metrics.
The Timing of a buyer and a seller are the first “spark” in demand and supply. Their “timing” has to be right. Then the Psychology of that buyer and seller are in support or defiance of their timing. And then it’s Location. Proximity to water and desired amenities and the product itself help both suppliers and buyers.
The result of a sale at a price can be plotted. I measure the momentum of those monthly changes to prices. Charting those monthly momentum changes gives the chart shown here. I call it the “Swing” Indicator because it depicts the market swings and shifts in close prices. This is and EKG-like depiction.
Bubbles beget vacuums.
Risk
Driving to work exposes us to risk. Signing up for solar panels on our rooves exposes us to risk. Investing in a restaurant business exposes us to risk. Selling and buying a house exposes us to risk.
Some risks in real estate are unavoidable (risk of giving a buyer exclusive right while other buyers might offer more), and some are avoidable (disclosing the recent rat infestation in your attic). My job is not as critical as fire-fighter or airplane mechanic, but I must help my clients avoid the avoidable. Preparation of your mindset, product, and destination will be the best way to minimize the avoidable risk called STRESS. Stress makes real estate expensive. It makes us err. Don’t err. Hire me.
Data Boundaries
Our metro area consists of many micro-markets. Even within a zip code, there are fluctuations in activity and value. While the readiness and “timing” of a principal is most important. “psychology” and “location” can drive much of the variation. These are the boundaries that show interesting data points. Housing is still not very affordable. Yet homes are selling. This is proof that the market doesn’t care what anyone thinks about it.
[MEDIAN] – Dec 24
Highest [MEDIAN] = $1,600,000 in Granite Bay 95746
Lowest [MEDIAN] = $367,000 in Pollock Pines 95726
[MEDIAN] Range = $1,233,000
Average [MEDIAN] = $599,596
New [MEDIAN] High – Dec 24
New [MEDIAN] High $657,000 in Placerville 95667.
New [MEDIAN] High $1,600,000 in Granite Bay 95746.
New [MEDIAN] High $565,000 in Arden 95821.
New [MEDIAN] High $408,000 in Fruitridge 95824.
New [MEDIAN] High $677,000 in Vineyard 95829.
[NEW] – Dec 24
Highest [NEW] = 58 in Lincoln 95648
Lowest [NEW] = 1 in Arden 95825
Average [NEW] = 15
[ACTIVE] – Dec 24
Highest [ACTIVE] = 161 in Lincoln 95648
Lowest [ACTIVE] = 4 in Arden 95825
Average [ACTIVE] = 35
[PENDED] – Dec 24
Highest [PENDED] = 69 in Roseville 95747
Lowest [PENDED] = 3 in Loomis 95650
Average [PENDED] = 19
[SOLD] – Dec 24
Highest [SOLD] = 99 in Roseville 95747
Lowest [SOLD] = 3 in Downtown 95816
Average [SOLD] = 23
[CANC] – Dec 24
Highest [CANC] = 37 in El Dorado Hills 95762
Lowest [CANC] = 1 in Oak Park 95817
Average [CANC] = 9
[#Offers] – Dec 24
Highest [#Offers] = 131 in Roseville 95747
Lowest [#Offers] = 4 in Downtown 95816
Average [#Offers] = 44
MoI – Dec 24
Highest MoI = 9.0 in Pollock Pines 95726
Lowest MoI = .5 in Oak Park 95817
Average MoI = 1.6
HAI – Dec 24
Highest HAI = 91% in Rancho Cordova 95742
Lowest HAI = 35% in Loomis 95650
Average HAI = 60%
Housing Affordability Index (HAI)
The media is comfortable using HAI to describe a real estate market. Ours is NOT affordable using the “textbook” calculation of Housing Affordability. It is simply the Price, the cost of money (rate), and the income of the buyer. That tells us how “affordable” that house would be. There is a MAJOR assumption in calculating the “Median Income”. Just use your income, the mortgage rate, and the expected price of your house. Your buyer, if borrowing at that Rate, must make the “qualifying” amount.
Jay Emerson, Broker Masters Club – Outstanding Life Member – DRE#1788488 |

