Pattern Interrupted
When life gives ME lemons, I try to understand the pattern to 1) why, 2) how, and 3) where I get them. The patterns INSIDE a lemon are always the same – never identical and obviously natural.
The data I collect and analyze consists of MLS reported data for listing statuses, the number of days they were marketed before they entered contract, and the resulting prices after the contract is executed (and becomes public information). The data happens in patterns. You have probably heard of the “seasonal” nature of real estate – that’s a pattern. And the best time to put your house on the market, if you have a choice, is when the buyers are flocking in the highest numbers; Spring and Summer – this is a specific application of knowledge (= “wisdom”). And as we notice these patterns, we propagate them by telling everyone who asks [even if they don’t ask].
Yes, my telling you something can create a mass belief in that something that begets that something which makes me correct [and really smart]. It’s called Social Proof and really it only proves you trust someone’s opinion. But, to be sure, you need to see the data and understand the patterns before you believe what someone tells you [even if someone is me].
Charts are graphical depictions of data. Showing time-based data items together helps highlight correlations and patterns. They also expose how markets are heading. Historically, patterns are more obvious in a chart (canvas) and they can give us knowledge of the future, ceteris parabis. But all things (ceteris) don’t remain the same (parabis). And what I noticed is an “interrupted” pattern.
Month-over-Month “gain” is only meaningful to a seller. And in the years 2014-2018, the pattern reflected that Spring and Summer months saw the highest MoM changes in prices. Something happened in 2019 or, rather, something was organically going to happen in 2019 that got interrupted.
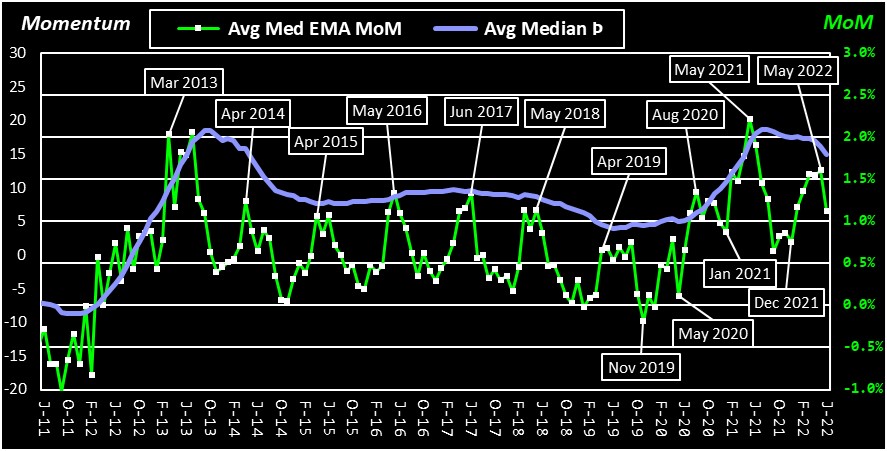
The direction and force of Momentum (Þ) tells me we were headed toward a “down market” that would have started mid-2019 and early 2020 by crossing its Zero axis. Down markets are not a bad thing. A living and “free market” goes through changes up and down. Organisms like markets go through the gyrations of growth and decay. The more unnatural the growth, the deeper the decay. That’s my opinion.
As you recall, March 2020, human lives were interrupted by lockdowns and the conundrum we have ignored for decades – how fragile is our Republic and is our demise inevitable. Our market exists for human sellers and buyers so it was also interrupted.
Another obvious point of divergence from a pattern is “Active Listings”, or Supply that invites Demand. Turnover (“Sold/Active”) is a rough determination of growth or depletion of Supply during the month. According to the pattern, Active listings in the month of May has NEVER (in 10 years) been LESS THAN the previous month of April. Suddenly in May 2019, it went flat and then soon went almost away. Turnover is merely the mathematical representation of the other two lines (Sold divided by Active). Between May 2019 and January 2021, Supply disappeared, almost.
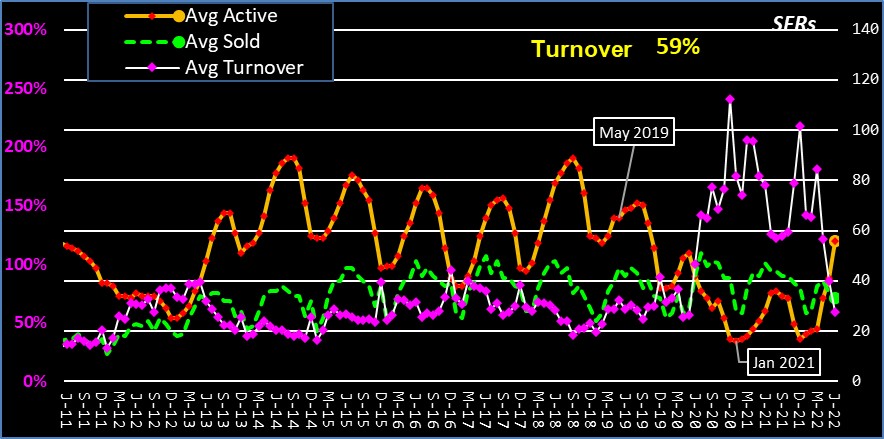
As Supply was disappearing, Demand was only constrained by the paltry Supply. Cash was the “old investment” and real estate was the new one. Rather than refinancing (“cash out”) and building a portfolio of cashflow properties, owners were selling and ZOOMing away for cheaper and less crowded. Hence the mini-exodus from the Bay Area to our Metro Area (Sacramento, El Dorado, Placer).
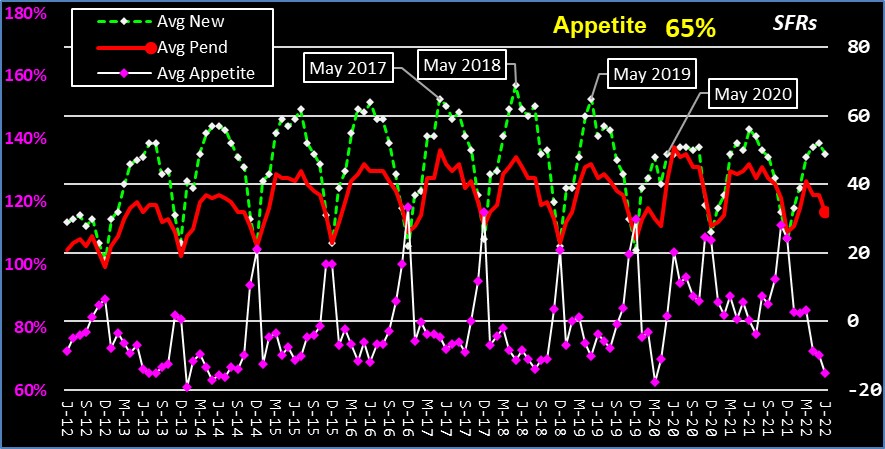
New listings are the source of new Supply. It follows that a decrease in Supply should have started with a decrease in New Supply. This pattern shows the marked difference between the seasonal HIGH number of New listings in the month of May from 2019 to 2020. And the Pending pattern is now showing a drastic change in its pattern since mortgage rates interrupted Demand. Appetite is my indicator showing, in general, how New listings are being “eaten” as they come on the market. When Pending is equal or greater than New, it doesn’t bode well for Supply. Yes, we need more than 1 month of inventory and it should take more than 30 days to market a listing. “Should”.
The bottom line is that we have to get back to a free market; no more government intervention into every part of the real estate process. That wouldn’t result in a bad thing so not only is it my opinion, it qualifies as a truth.
Hire and refer me to others who want truth in their lives.
I’m never too busy for your referrals and I can connect you or your friends and family with excellent agents throughout the country. Please don’t hesitate to reach out if I can help in any way.
Approaching $80 million in sales volume after 15 years!

Recent Posts
Please subscribe to my blog: https://jayemerson.com/blog/