February 2021 - Sacramento Metro
Real Estate Market Update
We still have less than 1 month of homes available for buyers. We have had markets like this; low inventory, high demand, low rates. What is new, I think, is the migration from urban to rural areas. This migration is driven by remote-access “rights” of employees and people fleeing the poorly managed municipalities. Financing is not overwhelmed by all-cash buyers but high-priced and nice homes are getting a lot of attention (“multiple offers”).
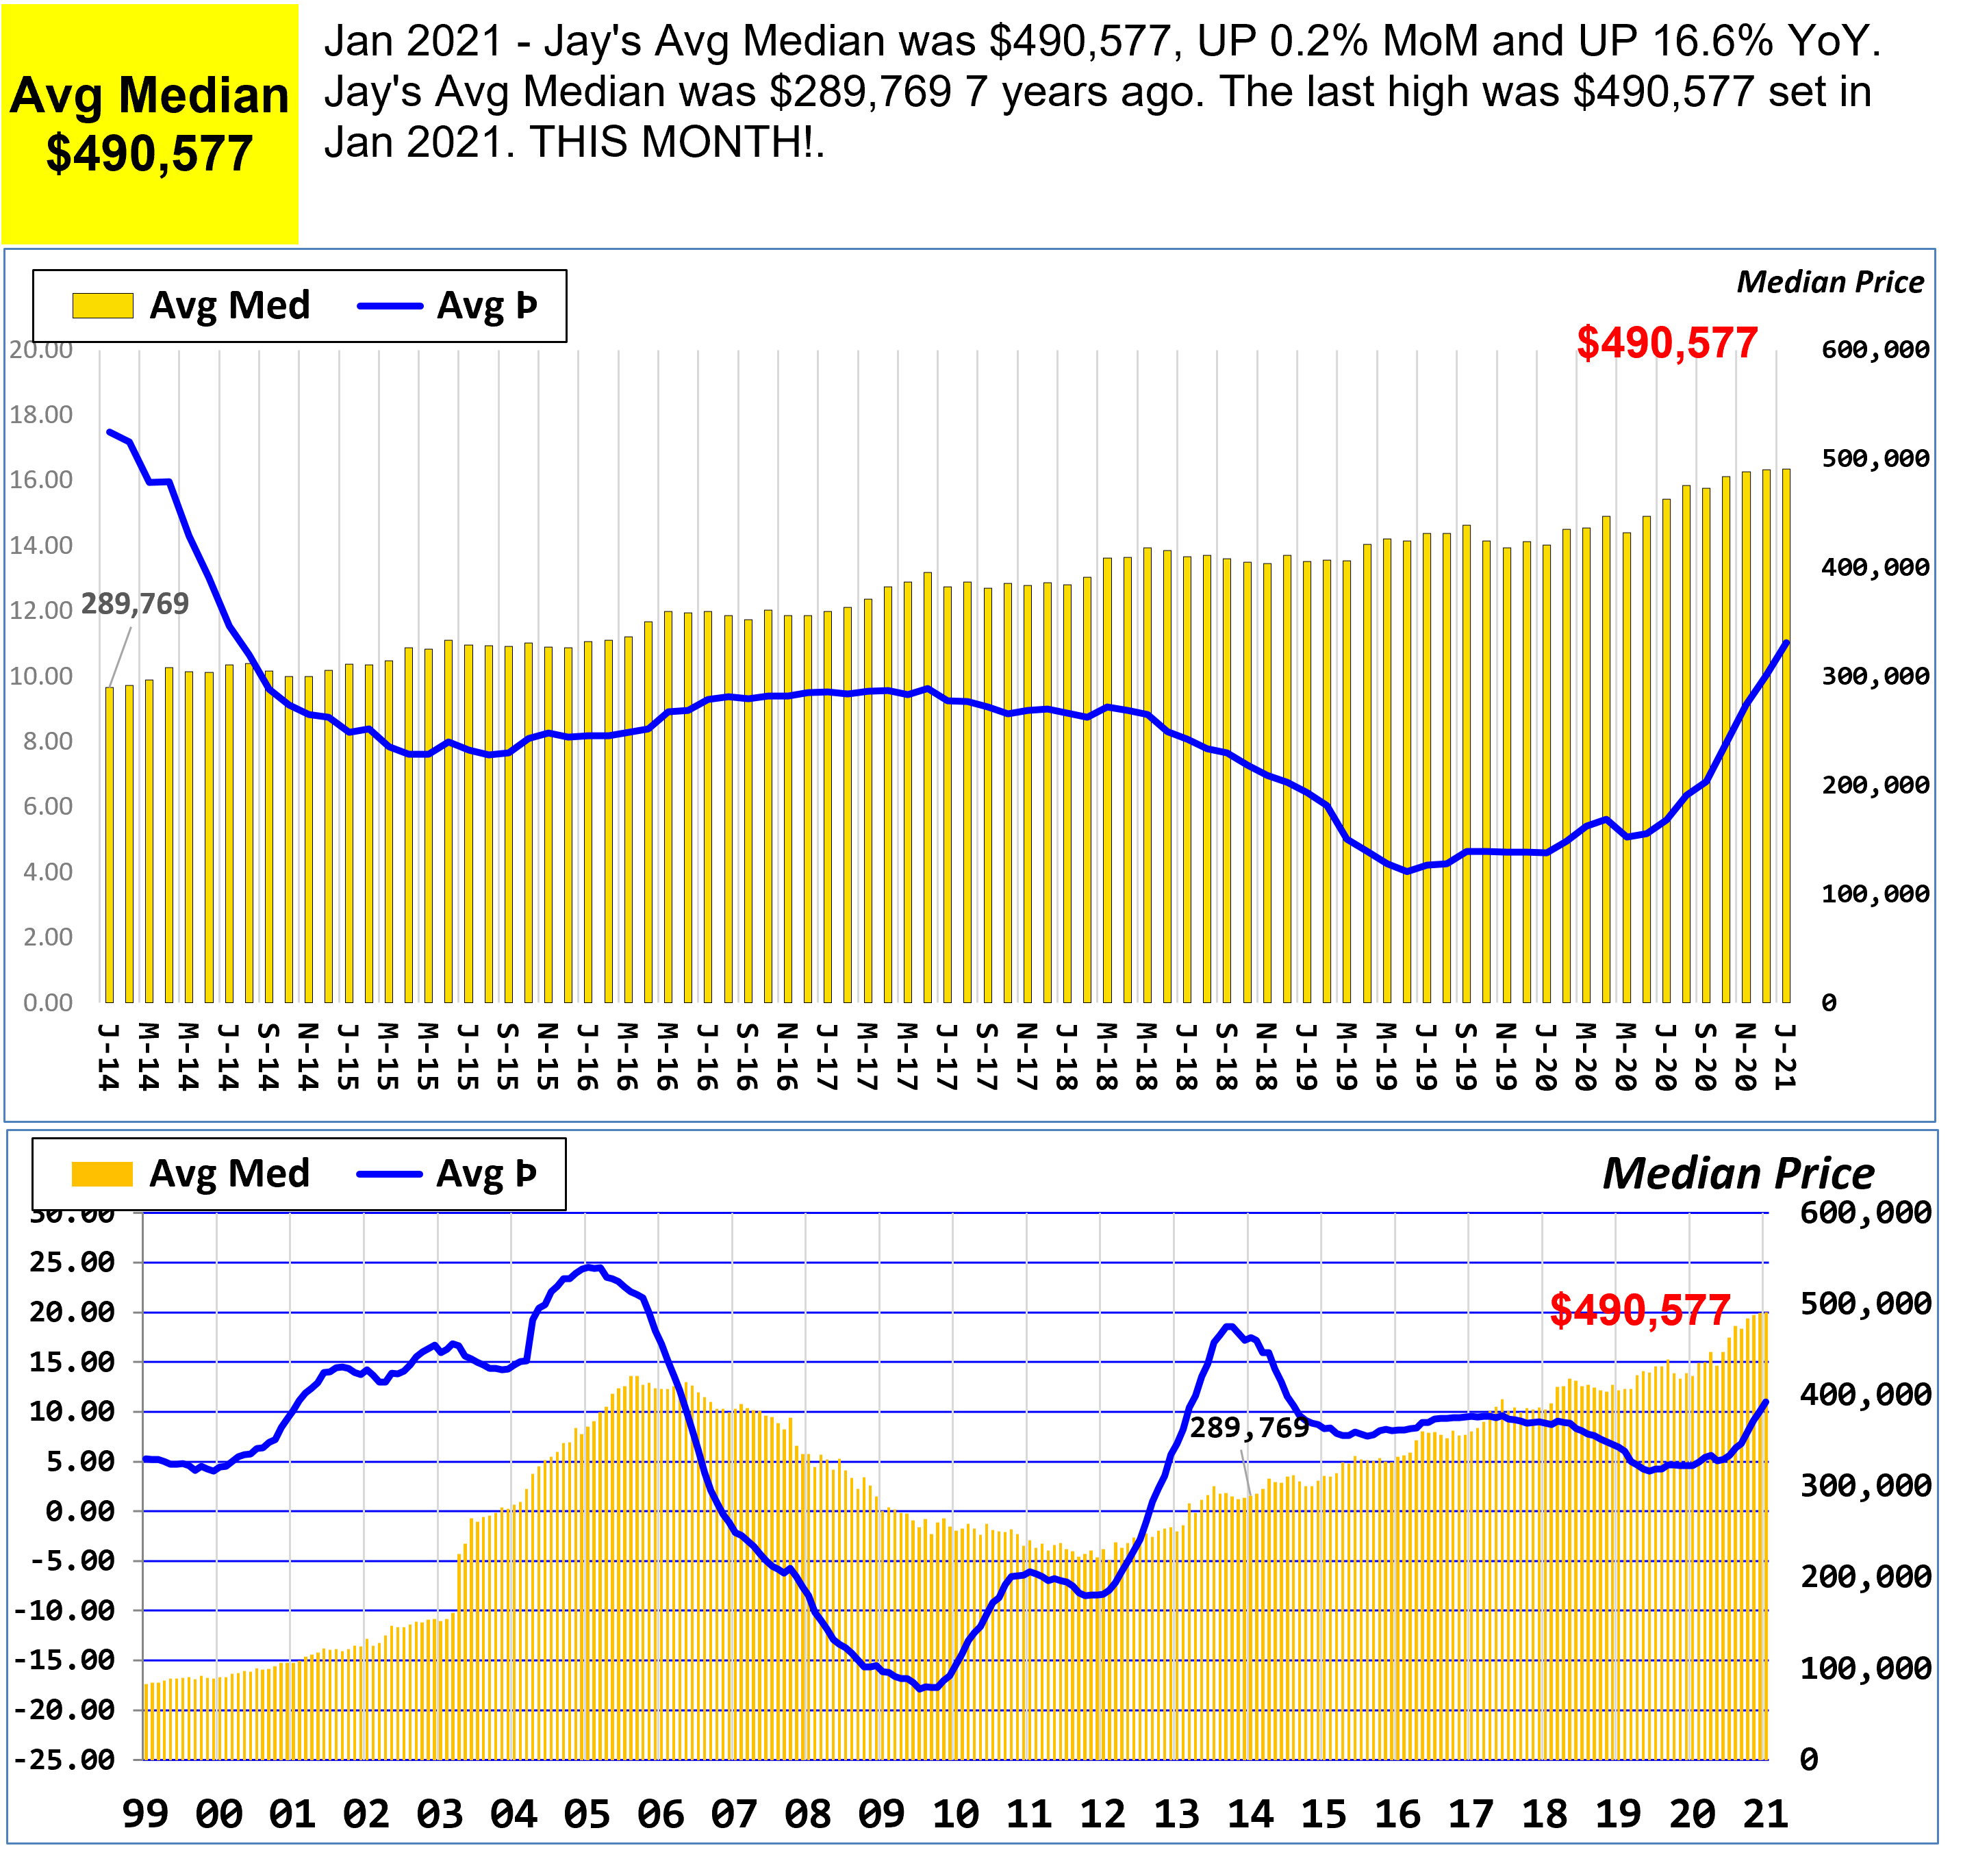
Even the “hockey sticks” which depict the surge of price momenta in almost every zip code and County have not shown a slowing or retreat. Sellers, if blessed to sell now, are “taking profits”. Like the stock market, if the masses start selling, prices will plateau or decline. Momentum is a measure of the force and direction of the price change and it has quickly moved up since March 2020. It has been higher, recently, but hasn’t gotten to the current heights so quickly.
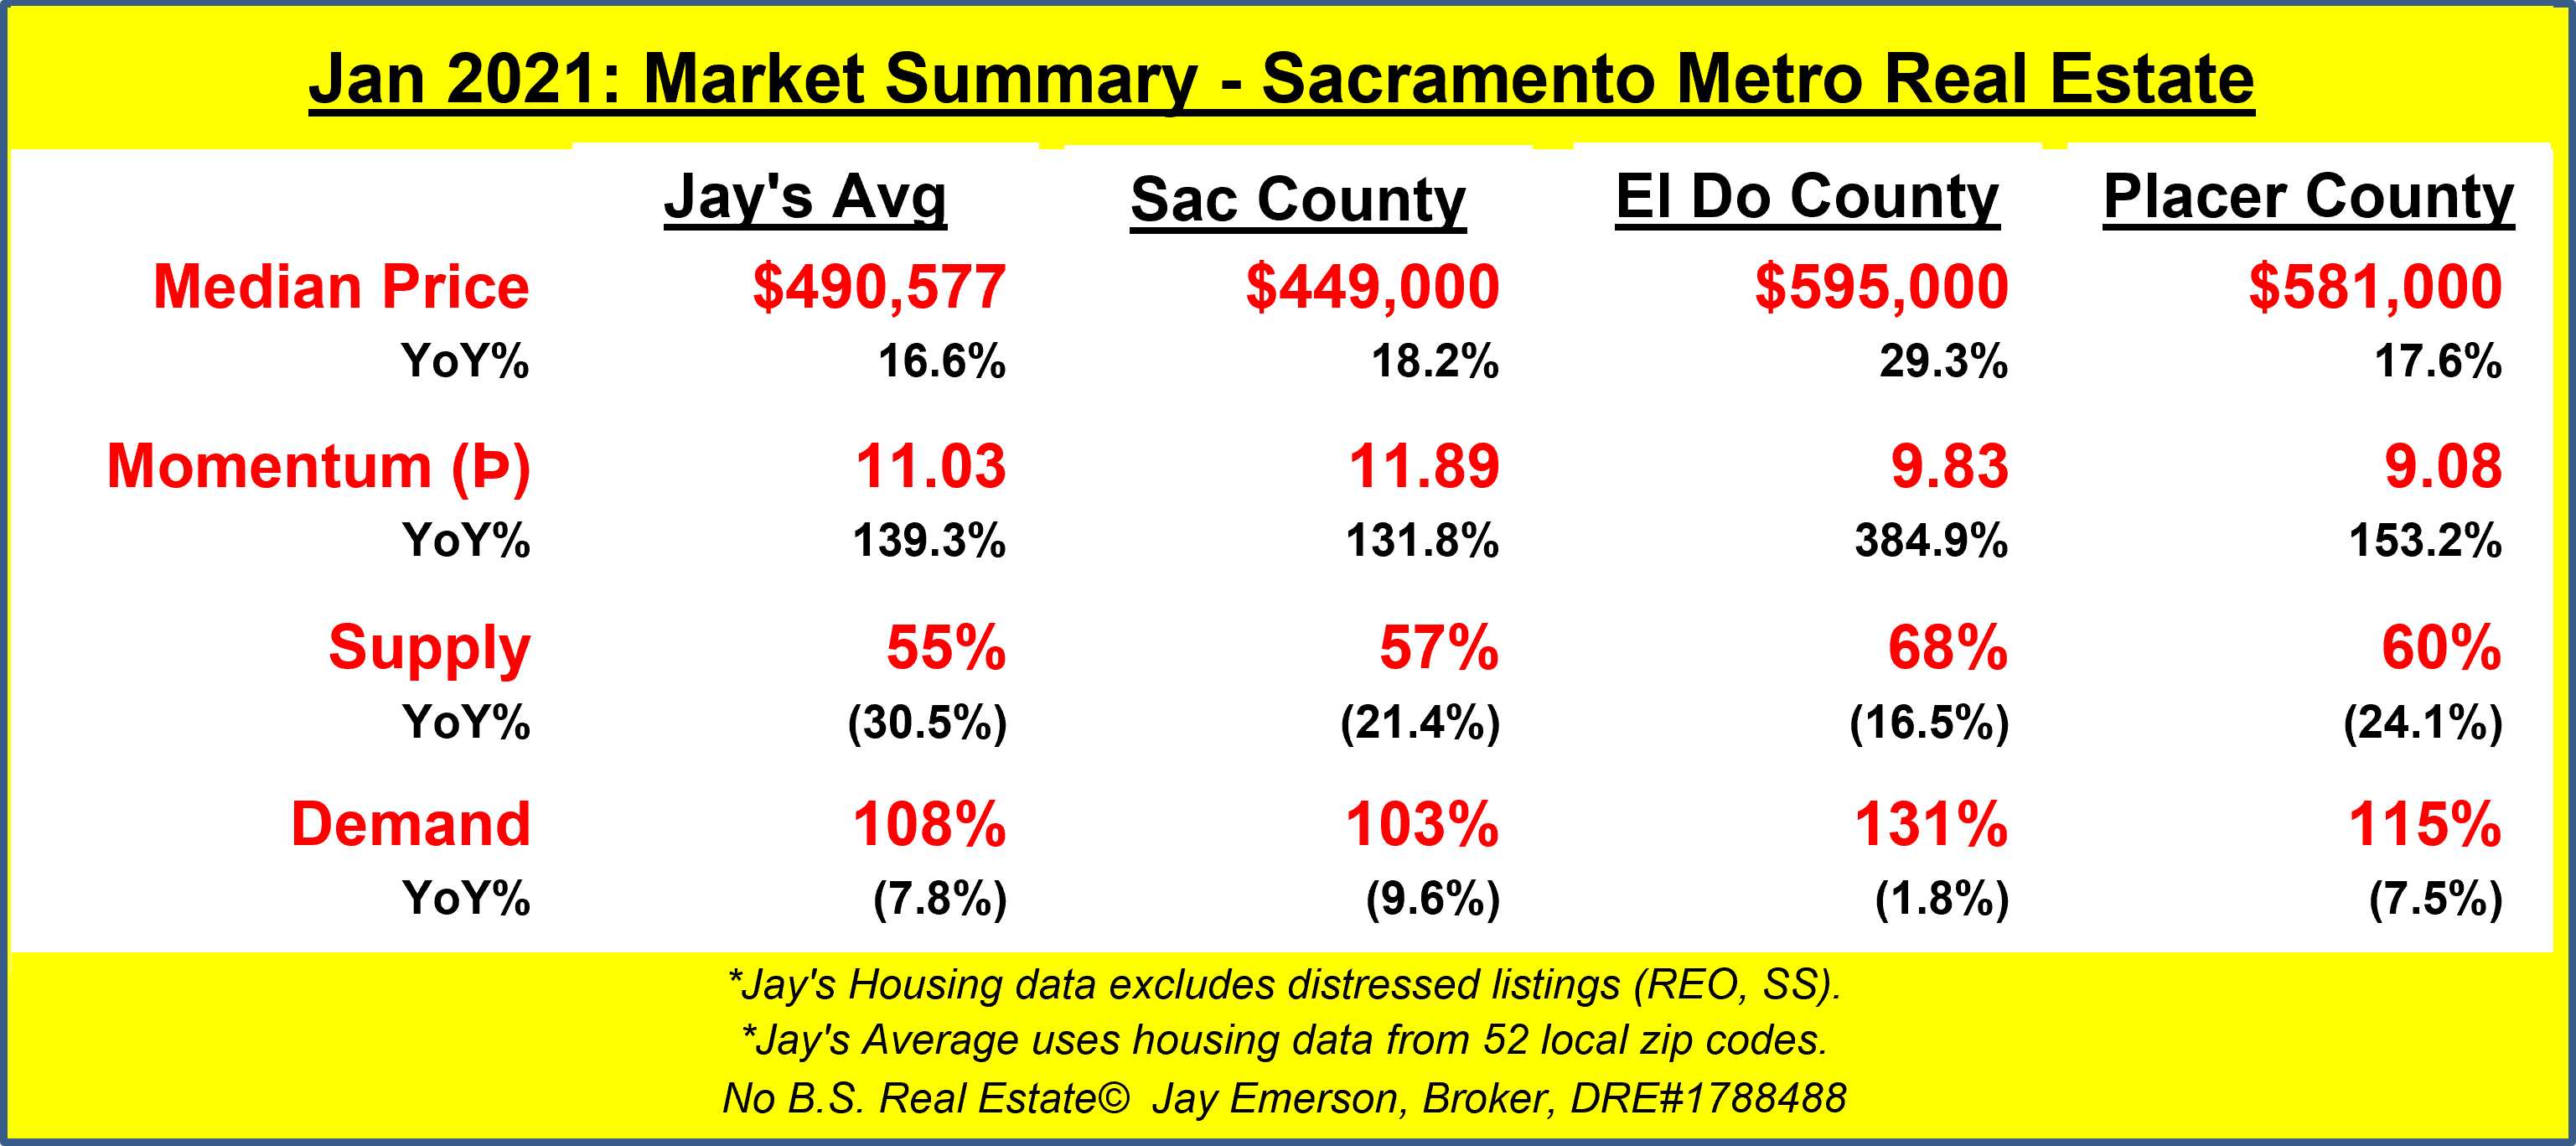
Similar but better than the S&P CoreLogic Case-Shiller model is Jay’s Averages. Not only do these Averages reflect a composite of prices (LOCAL prices) but also shows momentum, supply, and demand.
Call or refer me to your friends and family. I’m never too busy for your referrals.
County real estate results can be found here: https://www.jayemerson.com/counties
Jay’s Averages can be found here: https://www.jayemerson.com/averages
P.S., my website only points to Parler and Pinterest for sharing. Please do that.

Sacramento County area details
- Carmichael 95608, 01/2021 – Median $467K, (Þ▲,MoM▲0.4%,YoY▲12.3%) – 50% of avg 7Yr January Supply – 103% of avg 7Yr January Demand – 0.8 months of inventory
- Citrus Hts 95610, 01/2021 – Median $445K (NEW HIGH), (Þ▲,MoM▲2.3%,YoY▲20.6%) – 66% of avg 7Yr January Supply – 101% of avg 7Yr January Demand – 0.6 months of inventory
- Citrus Hts 95621, 01/2021 – Median $400K (MATCHED HIGH), (Þ▲,MoM◄►0.0%,YoY▲18.3%) – 71% of avg 7Yr January Supply – 107% of avg 7Yr January Demand – 0.2 months of inventory
- Elk Grove 95624, 01/2021 – Median $505K, (Þ▲,MoM▲1.0%,YoY▲13.5%) – 62% of avg 7Yr January Supply – 92% of avg 7Yr January Demand – 0.7 months of inventory
- Fair Oaks 95628, 01/2021 – Median $585K (NEW HIGH), (Þ▲,MoM▲12.5%,YoY▲20.6%) – 48% of avg 7Yr January Supply – 111% of avg 7Yr January Demand – 0.6 months of inventory
- Folsom 95630, 01/2021 – Median $605K, (Þ▲,MoM▼-2.1% ,YoY▲10.6%) – 62% of avg 7Yr January Supply – 120% of avg 7Yr January Demand – 0.4 months of inventory
- North Hilnds 95660, 01/2021 – Median $330K, (Þ▲,MoM▼-2.9% ,YoY▲19.6%) – 82% of avg 7Yr January Supply – 101% of avg 7Yr January Demand – 0.6 months of inventory
- Orangevale 95662, 01/2021 – Median $461K, (Þ▲,MoM▲4.8%,YoY▲18.8%) – 69% of avg 7Yr January Supply – 110% of avg 7Yr January Demand – 0.6 months of inventory
- Rancho Cord 95670, 01/2021 – Median $440K (NEW HIGH), (Þ▲,MoM▲10.0%,YoY▲11.4%) – 76% of avg 7Yr January Supply – 97% of avg 7Yr January Demand – 0.5 months of inventory
- Rio Linda 95673, 01/2021 – Median $342K, (Þ▼,MoM▼-5.0% ,YoY▲3.6%) – 49% of avg 7Yr January Supply – 103% of avg 7Yr January Demand – 0.6 months of inventory
- Rancho Cord 95742, 01/2021 – Median $515K, (Þ▲,MoM▲1.2%,YoY▲17.8%) – 60% of avg 7Yr January Supply – 119% of avg 7Yr January Demand – 0.5 months of inventory
- Elk Grove 95757, 01/2021 – Median $590K (NEW HIGH), (Þ▲,MoM▲6.5%,YoY▲18.7%) – 31% of avg 7Yr January Supply – 76% of avg 7Yr January Demand – 0.2 months of inventory
- Elk Grove 95758, 01/2021 – Median $478K (NEW HIGH), (Þ▲,MoM▲3.9%,YoY▲9.4%) – 46% of avg 7Yr January Supply – 87% of avg 7Yr January Demand – 0.4 months of inventory
- Arden 95815, 01/2021 – Median $295K, (Þ▲,MoM▲5.4%,YoY▲19.4%) – 57% of avg 7Yr January Supply – 117% of avg 7Yr January Demand – 0.5 months of inventory
- Downtown 95816, 01/2021 – Median $635K, (Þ▲,MoM▼-5.9% ,YoY▲22.1%) – 82% of avg 7Yr January Supply – 107% of avg 7Yr January Demand – 0.8 months of inventory
- Oak Park 95817, 01/2021 – Median $439K, (Þ▼,MoM▼-6.0% ,YoY▲5.5%) – 63% of avg 7Yr January Supply – 101% of avg 7Yr January Demand – 0.7 months of inventory
- Land Park 95818, 01/2021 – Median $661K, (Þ▲,MoM▲6.6%,YoY▲18.5%) – 51% of avg 7Yr January Supply – 123% of avg 7Yr January Demand – 0.6 months of inventory
- East Sac 95819, 01/2021 – Median $706K, (Þ▼,MoM▼-17.2% ,YoY▲10.3%) – 73% of avg 7Yr January Supply – 139% of avg 7Yr January Demand – 0.7 months of inventory
- Elder Creek 95820, 01/2021 – Median $355K, (Þ▲,MoM▲4.1%,YoY▲30.5%) – 62% of avg 7Yr January Supply – 110% of avg 7Yr January Demand – 0.8 months of inventory
- Arden 95821, 01/2021 – Median $415K, (Þ▲,MoM▲2.5%,YoY▲13.7%) – 60% of avg 7Yr January Supply – 122% of avg 7Yr January Demand – 0.4 months of inventory
- Greenhaven 95822, 01/2021 – Median $350K, (Þ▼,MoM▼-6.7% ,YoY▲9.4%) – 39% of avg 7Yr January Supply – 75% of avg 7Yr January Demand – 0.3 months of inventory
- Franklin 95823, 01/2021 – Median $370K (NEW HIGH), (Þ▲,MoM▲4.5%,YoY▲21.3%) – 49% of avg 7Yr January Supply – 92% of avg 7Yr January Demand – 0.3 months of inventory
- Fruitridge 95824, 01/2021 – Median $315K (NEW HIGH), (Þ▲,MoM▲7.9%,YoY▲18.9%) – 76% of avg 7Yr January Supply – 93% of avg 7Yr January Demand – 1.0 months of inventory
- Arden 95825, 01/2021 – Median $411K, (Þ▲,MoM▼-1.9% ,YoY▲32.2%) – 75% of avg 7Yr January Supply – 125% of avg 7Yr January Demand – 0.8 months of inventory
- College Greens 95826, 01/2021 – Median $425K (NEW HIGH), (Þ▲,MoM▲5.2%,YoY▲25.4%) – 96% of avg 7Yr January Supply – 110% of avg 7Yr January Demand – 0.5 months of inventory
- Rosemont 95827, 01/2021 – Median $410K (MATCHED HIGH), (Þ▲,MoM◄►0.0%,YoY▲18.2%) – 36% of avg 7Yr January Supply – 88% of avg 7Yr January Demand – 0.2 months of inventory
- Florin 95828, 01/2021 – Median $375K, (Þ◄►,MoM▼-2.1% ,YoY▲11.9%) – 51% of avg 7Yr January Supply – 90% of avg 7Yr January Demand – 0.5 months of inventory
- Vineyard 95829, 01/2021 – Median $435K, (Þ▲,MoM▼-8.0% ,YoY▲16.0%) – 39% of avg 7Yr January Supply – 86% of avg 7Yr January Demand – 0.6 months of inventory
- Pocket 95831, 01/2021 – Median $547K, (Þ▼,MoM▼-4.0% ,YoY▲8.3%) – 59% of avg 7Yr January Supply – 97% of avg 7Yr January Demand – 0.7 months of inventory
- Freeport 95832, 01/2021 – Median $329K, (Þ▲,MoM▼-13.0% ,YoY▲22.3%) – 40% of avg 7Yr January Supply – 67% of avg 7Yr January Demand – 0.6 months of inventory
- Natomas 95833, 01/2021 – Median $430K (NEW HIGH), (Þ▲,MoM▲4.1%,YoY▲18.1%) – 47% of avg 7Yr January Supply – 107% of avg 7Yr January Demand – 0.2 months of inventory
- Natomas 95834, 01/2021 – Median $481K (NEW HIGH), (Þ▲,MoM▲11.9%,YoY▲22.1%) – 73% of avg 7Yr January Supply – 112% of avg 7Yr January Demand – 0.4 months of inventory
- Natomas 95835, 01/2021 – Median $465K, (Þ▼,MoM▼-2.1% ,YoY▲8.1%) – 52% of avg 7Yr January Supply – 75% of avg 7Yr January Demand – 0.3 months of inventory
- Del Paso Hts 95838, 01/2021 – Median $315K, (Þ▲,MoM▼-3.1% ,YoY▲18.9%) – 51% of avg 7Yr January Supply – 115% of avg 7Yr January Demand – 0.6 months of inventory
- North Sac 95841, 01/2021 – Median $385K, (Þ▼,MoM▼-1.0% ,YoY▲10.0%) – 90% of avg 7Yr January Supply – 145% of avg 7Yr January Demand – 0.7 months of inventory
- Foothill Frms 95842, 01/2021 – Median $356K, (Þ▲,MoM▼-1.1% ,YoY▲12.3%) – 32% of avg 7Yr January Supply – 85% of avg 7Yr January Demand – 0.1 months of inventory
- Antelope 95843, 01/2021 – Median $430K, (Þ▲,MoM▼-0.5% ,YoY▲17.8%) – 90% of avg 7Yr January Supply – 145% of avg 7Yr January Demand – 0.3 months of inventory
- Arden 95864, 01/2021 – Median $537K, (Þ▼,MoM▲4.1%,YoY▼-12.8%) – 57% of avg 7Yr January Supply – 117% of avg 7Yr January Demand – 1.3 months of inventory
El Dorado County area details
- Placerville 95667, 01/2021 – Median $559K (NEW HIGH), (Þ▲,MoM▲28.2%,YoY▲36.7%) – 58% of avg 7Yr January Supply – 129% of avg 7Yr January Demand – 1.1 months of inventory
- Cameron Pk 95682, 01/2021 – Median $563K, (Þ▲,MoM▲5.0%,YoY▲21.1%) – 58% of avg 7Yr January Supply – 81% of avg 7Yr January Demand – 0.8 months of inventory
- El Dorado Hills 95762, 01/2021 – Median $760K, (Þ▲,MoM▼-5.6% ,YoY▲10.6%) – 59% of avg 7Yr January Supply – 124% of avg 7Yr January Demand – 0.9 months of inventory
Placer County area details
- Auburn 95603, 01/2021 – Median $637K (NEW HIGH), (Þ▲,MoM▲8.9%,YoY▲29.5%) – 67% of avg 7Yr January Supply – 131% of avg 7Yr January Demand – 1.1 months of inventory
- Lincoln 95648, 01/2021 – Median $565K (NEW HIGH), (Þ▲,MoM▲9.9%,YoY▲21.0%) – 51% of avg 7Yr January Supply – 109% of avg 7Yr January Demand – 0.5 months of inventory
- Loomis 95650, 01/2021 – Median $828K, (Þ▲,MoM▼-20.4% ,YoY▲57.7%) – 48% of avg 7Yr January Supply – 146% of avg 7Yr January Demand – 0.5 months of inventory
- Roseville 95661, 01/2021 – Median $560K, (Þ▲,MoM▼-6.4% ,YoY▲11.3%) – 45% of avg 7Yr January Supply – 128% of avg 7Yr January Demand – 0.3 months of inventory
- Rocklin 95677, 01/2021 – Median $550K, (Þ▼,MoM▼-6.5% ,YoY▼-1.1%) – 91% of avg 7Yr January Supply – 136% of avg 7Yr January Demand – 0.7 months of inventory
- Roseville 95678, 01/2021 – Median $448K, (Þ▼,MoM▼-8.4% ,YoY▲6.7%) – 61% of avg 7Yr January Supply – 88% of avg 7Yr January Demand – 0.4 months of inventory
- Granite Bay 95746, 01/2021 – Median $968K, (Þ▲,MoM▲11.9%,YoY▲32.6%) – 60% of avg 7Yr January Supply – 131% of avg 7Yr January Demand – 1.3 months of inventory
- Roseville 95747, 01/2021 – Median $595K (NEW HIGH), (Þ▲,MoM▲7.0%,YoY▲21.4%) – 54% of avg 7Yr January Supply – 92% of avg 7Yr January Demand – 0.6 months of inventory
- Rocklin 95765, 01/2021 – Median $615K (NEW HIGH), (Þ▲,MoM▲8.8%,YoY▲14.3%) – 55% of avg 7Yr January Supply – 111% of avg 7Yr January Demand – 0.6 months of inventory
