
Wise MIS™ Metrics
Lows and Highs in August 2026
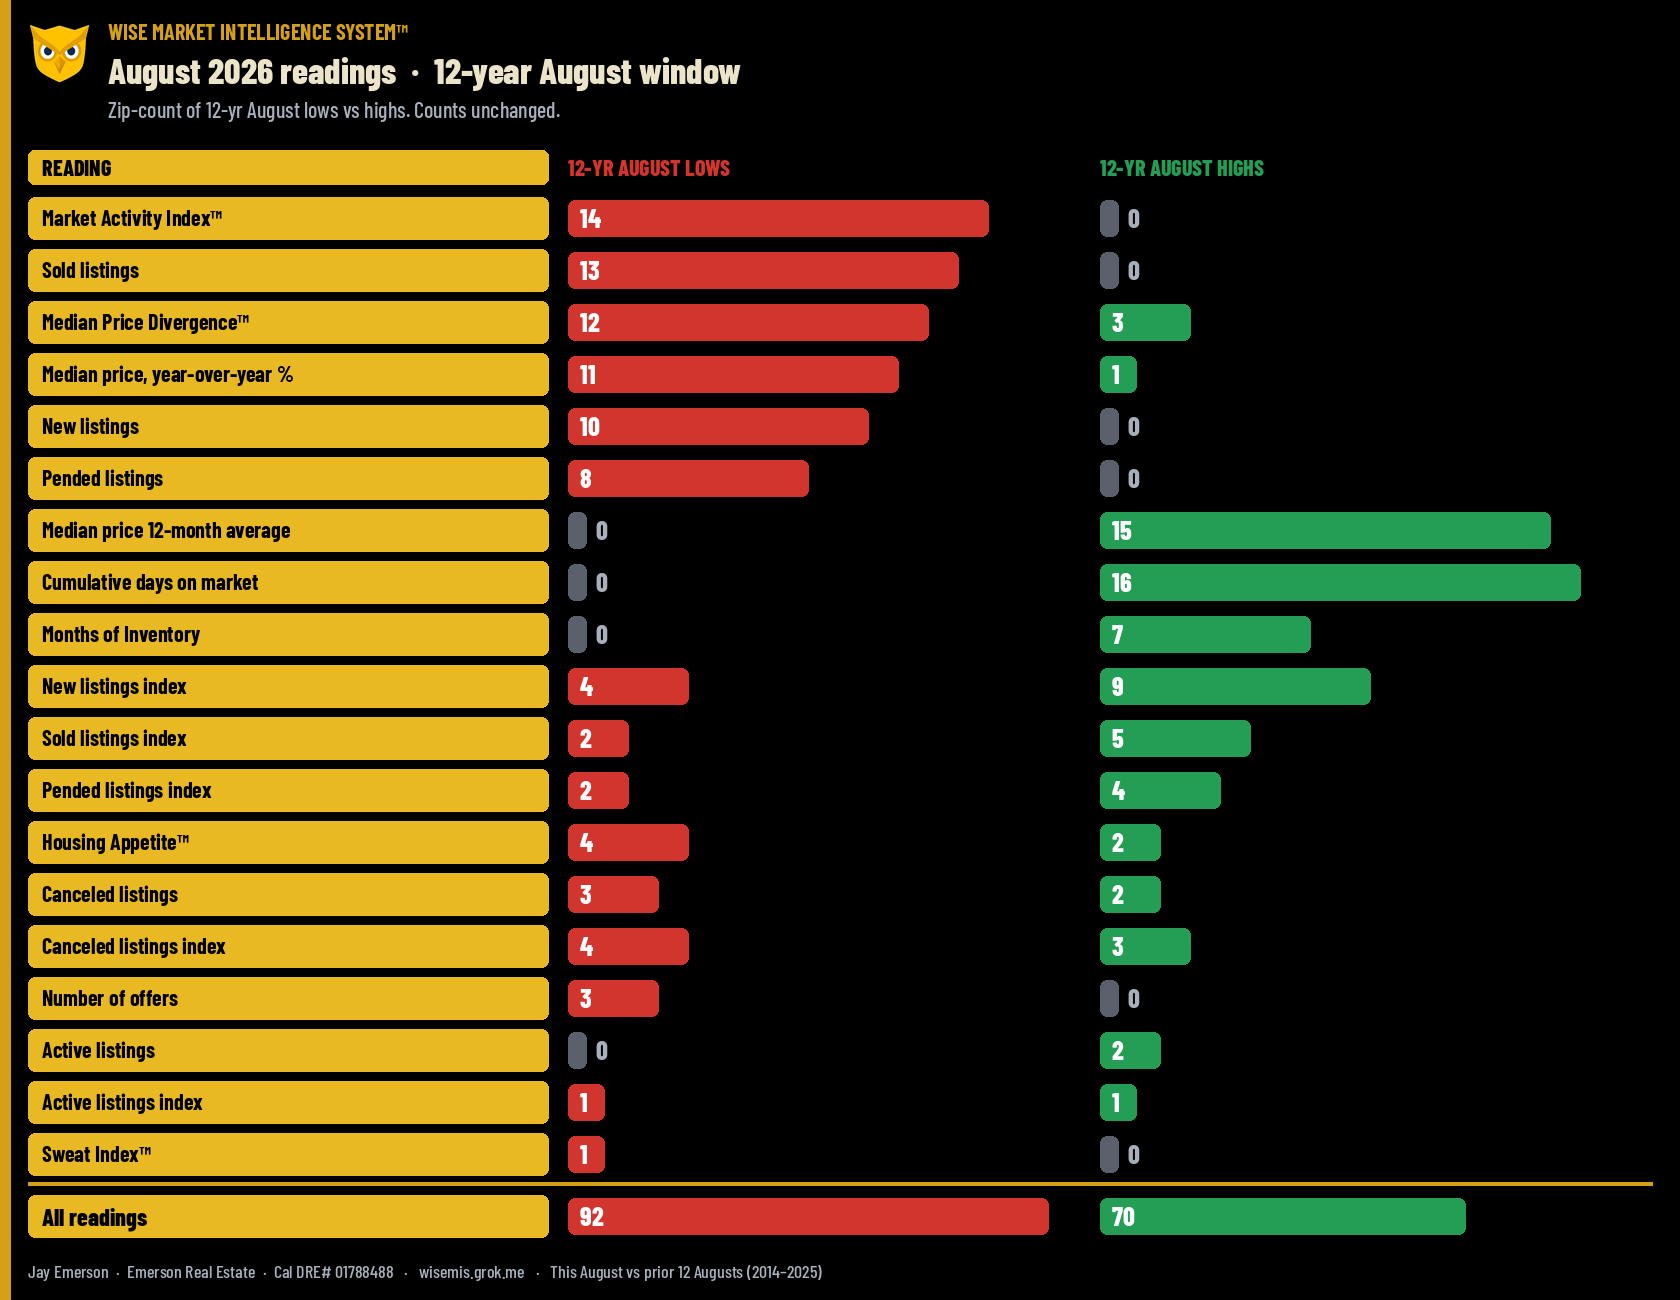
August 2026 set 92 twelve-year August lows and 70 twelve-year August highs across the tracked Sacramento Metro readings. The price level is not what went low. The pace did.
These are month-matching-month readings: this August against the prior 12 Augusts, 2014 through 2025. A low or a high is that August print, not a 12-month average. One zip code can carry several readings. 92 and 70 are readings, not zip codes.
**The split**
The 12-month moving average of median price printed 15 highs and no lows. Year-over-year median change printed 11 lows and 1 high. Smoothed prices are at a 12-year August high in those 15 readings. The annual rate of change is at a 12-year August low in those 11. Median price itself is not in this extreme tally.
Sales are thin. Sold listings printed 13 lows and no highs on the count. New listings printed 10 lows and no highs. Pended listings printed 8 lows and no highs. Offer counts printed 3 lows and no highs. Market Activity Index™ printed 14 lows and no highs, the widest activity low in the set. That index is activity against a 50 baseline. These 14 are the lowest August prints in the window. The favoring call still depends on whether the reading is under, at, or over 50.
Time is long. Cumulative days on market printed 16 highs and no lows, the largest high in the month. Months of Inventory printed 7 highs and no lows. A higher inventory duration means the active stock would last longer at the current sales pace. It favors buyers only when it is over 6 months. These seven are 12-year August highs. That is the comparison, not the favoring call.
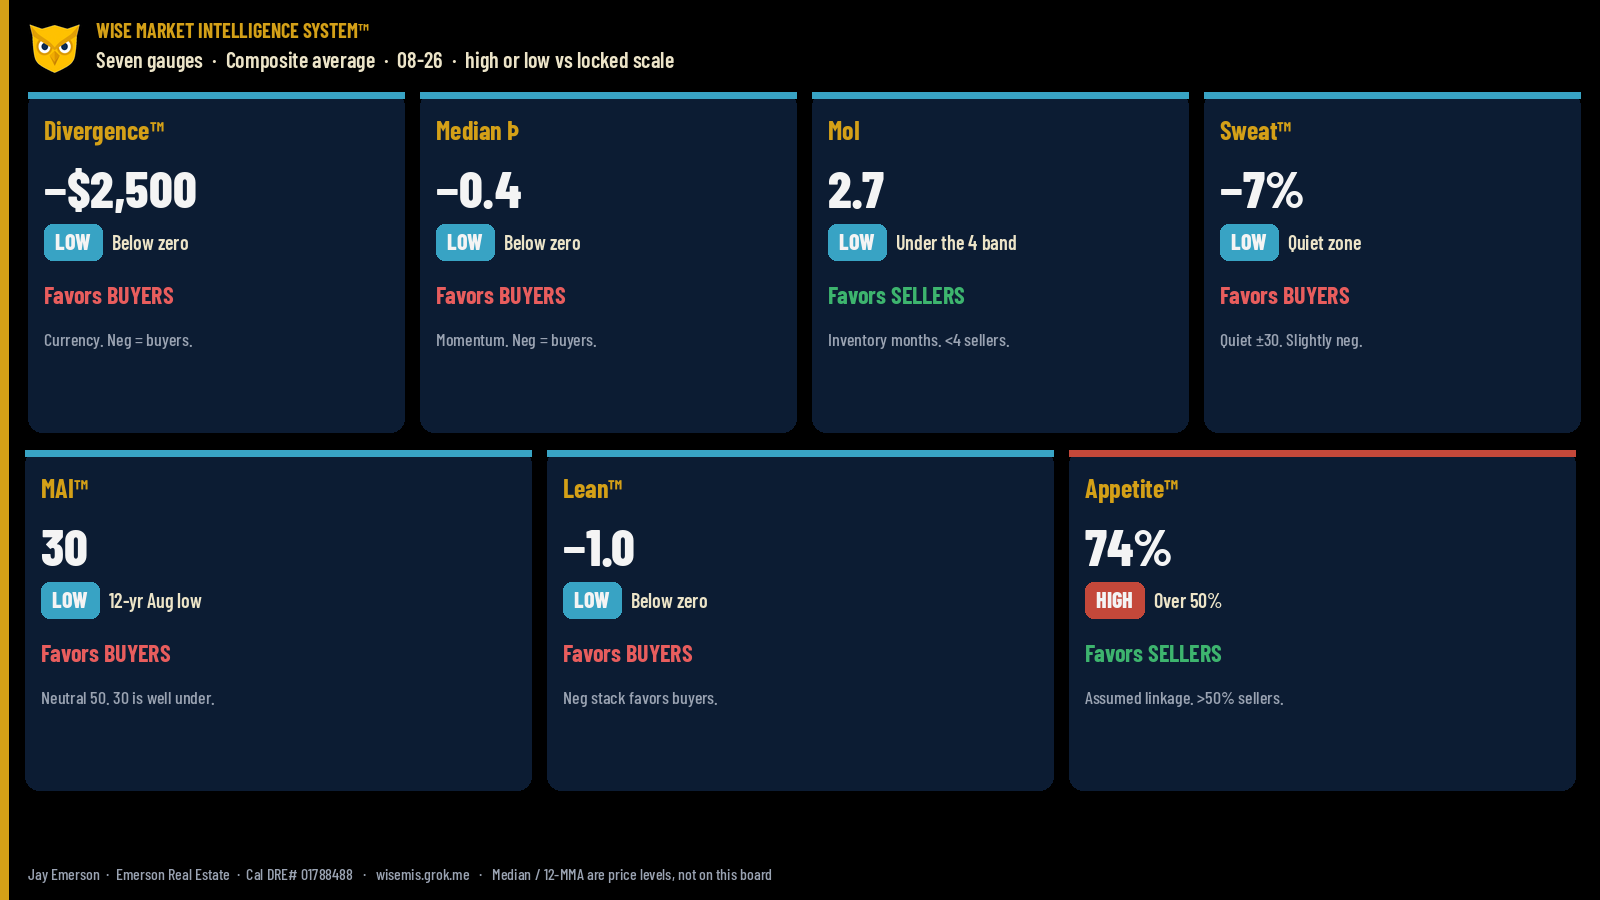
Median Price Divergence™ printed 12 lows and 3 highs. Divergence is median minus the 12-month average, in dollars. A low print is the smallest August gap in the window. Negative divergence favors buyers. Positive favors sellers.
**Smaller counts**
(see table above)
Counts and indexes do not tell the same story. New listings are low on the count in 10 readings and high on the index in 9. Sold listings are low on the count in 13 and high on the index in 5. Report both. Do not swap them.
Sweat Index™ printed one low and no highs. That is one reading, not a metro-wide stress signal. Housing Appetite™, pended listings divided by new listings, printed 4 lows and 2 highs.
August 2026 in this tally: smoothed prices still high against prior Augusts, the year-over-year gain mostly not, closings and new listings scarce, market time and inventory duration at the highs, and Divergence™ mostly at the lows. No single reading is the market. This is not a prediction and not advice.
Wise Market Intelligence System™
