What is the key to making wise decisions? Knowledge.
Monthly Data through August 31, 2026
No single metric tells the market story. The press likes to scream about “months of inventory” or “pending listings”. But even the 7 metrics I have developed can tell a mixed story.
August 2026 in one sentence
Sellers rarely get multiple offers and you should have sold last year.
Wise MIS™
Wise MIS™
Two decades of data collection, analysis, metric development and publication have given rise to my new application (Wise MIS™). More than just a display of charts and jibberish, this application is intended to give buyers and sellers the knowledge they need to make good decisions.
The seven metrics developed over the last 20 years (none tell the future):
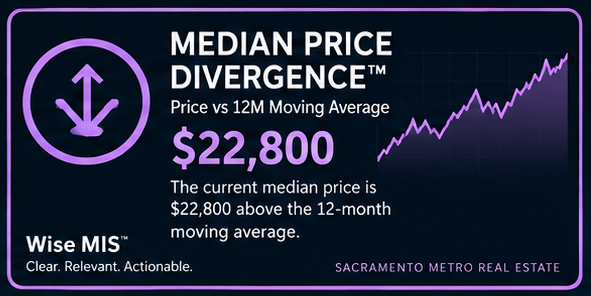
Divergence™ – The Median Price and its 12-month moving average have an obvious relationship. When there is a difference in these two (a “divergence”), it can mean the Median Price is moving up or down (or unchanged). When divergence is persistently positive, it implies a persistent increase in the Median Price (good for sellers). When divergence is peristently negative, it implies a persistent decrease in the Median (good for buyers).
Are the prices consistently above or below its average?
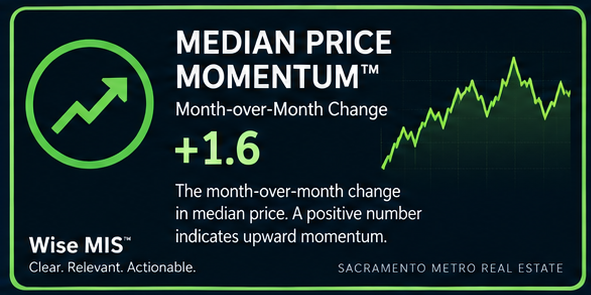
Momentum (Þ) – The Median Price and its momentum also have an obvious relationship. The momentum of the price gives direction and force indications.
Which way are prices moving, and with what strength?
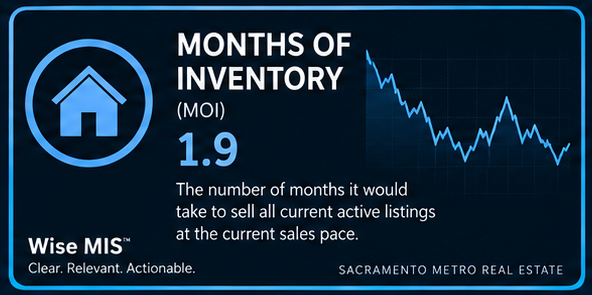
Months of Inventory (MoI) – Long touted as the “metric of metrics” by the national press, it indeed tells if inventory is ample enough. It cannot tell if sales are going to increase or decrease.
How long would it take to sell all active listings?
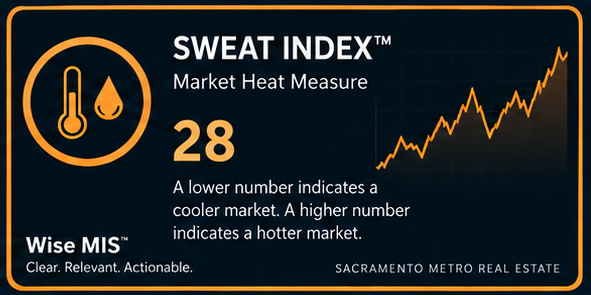
Sweat Index™ – An amalgam of listing throughput and durations, this proprietary index tells “who is sweating”.
How intense is the transaction environment?
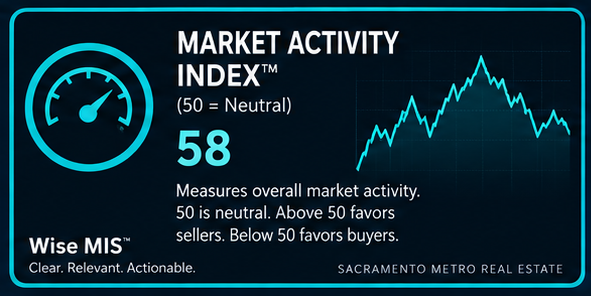
Market Activity Index (MAI) – A proprietary index that tells how active the market is.
How active is the marketplace?
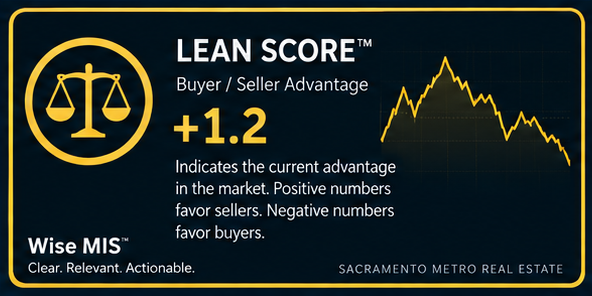
Lean Score™ – Measure of deviation from average for New, Pended, Sold, Canceled and Active listings, Cumulative Days on Market, Number of Offers.
Who has leverage in each listing phase?
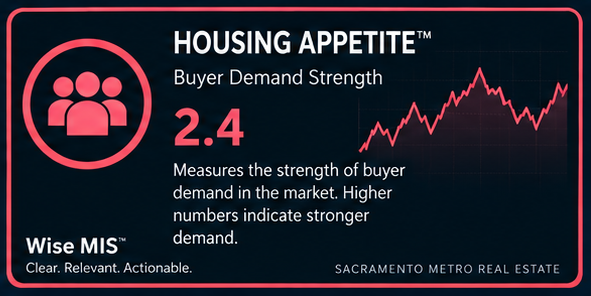
Housing Appetite™ – Measures the “uptake” of New listings.
Are buyers accepting the new supply coming to market?