The market is hopping. Investors, first-time buyers, and folks moving up are coming out of the woodwork. Are you poised to jump on this opportunity?
All of this and I find time to make YOU a new indicator. See the Swing indicator (#7). The movement of these data points tell a lot of the story. Simple Ups and Downs depict the swings and gaps between Up ticks and Down ticks. I love it when simple truths are depicted in simple pictures.
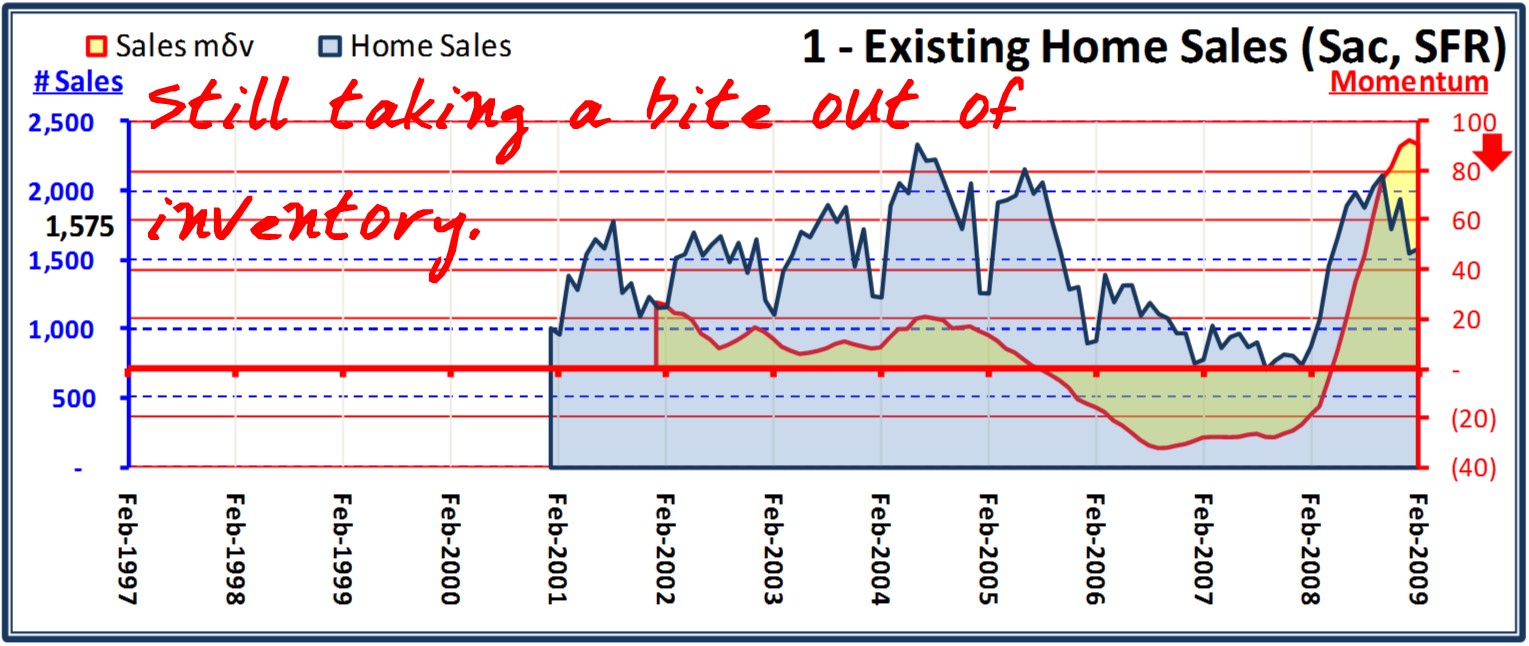
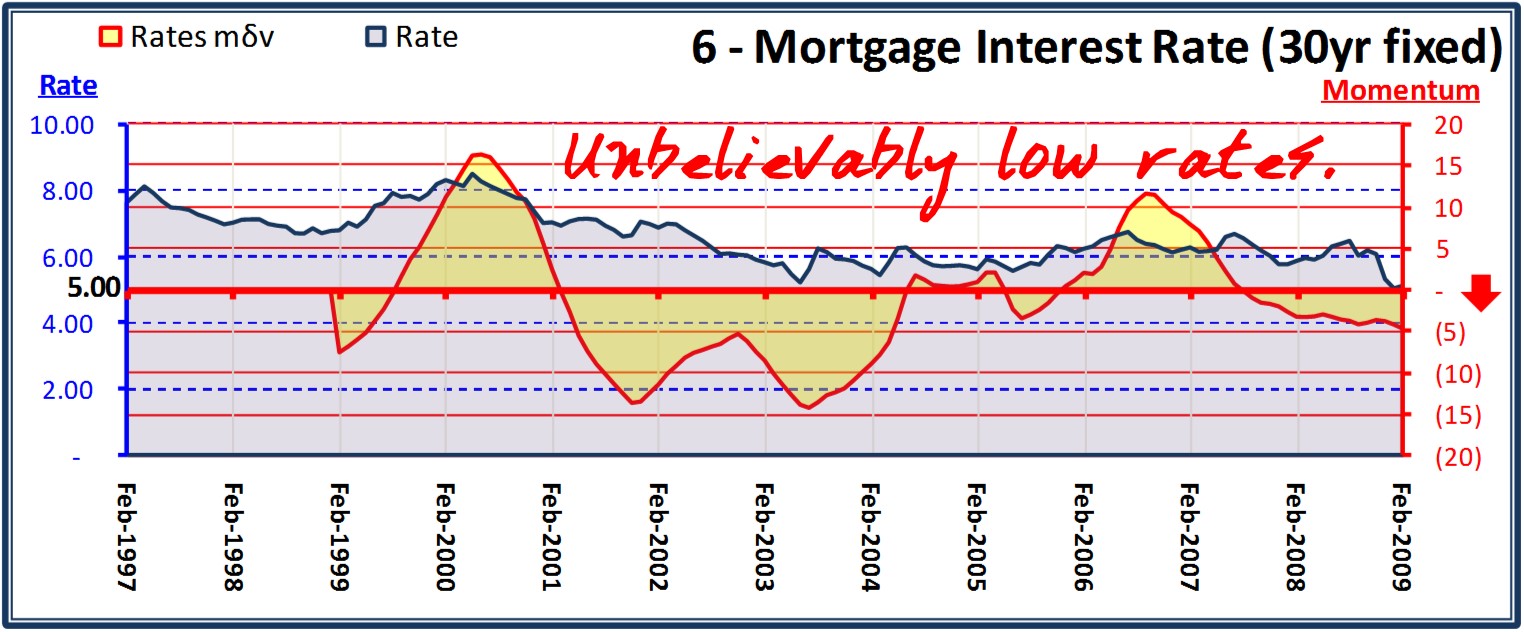
Supply is declining and demand is increasing. If there were no other corrupt forces in our market, prices would be increasing. Alas, we have some corruption. And that is intended literally and figuratively. The supply-demand driven market is being hampered by policies. Mortgage rates are staying low but there’s no telling how long that will or can remain true.
Buyers are indeed getting a sweet deal. There are buckets of money to use (if you know the right lenders) and banks that are not emotionally tied to the listing prices. While that doesn’t help the neighbors’ comparable sales prices, it does help get product off the market to make room for stabilization of prices.
In fact, of the 51 zip codes and 3 counties I now track, 24 of them had momentum increases in February (see the Swing indicator). That’s the highest number since March of ‘05 when 36 of the 40 median price histories had a momentum spike. And August ‘06 was the trough when only 1 of the 51 price histories experienced a momentum increase. This is a mighty fine swing in this month.
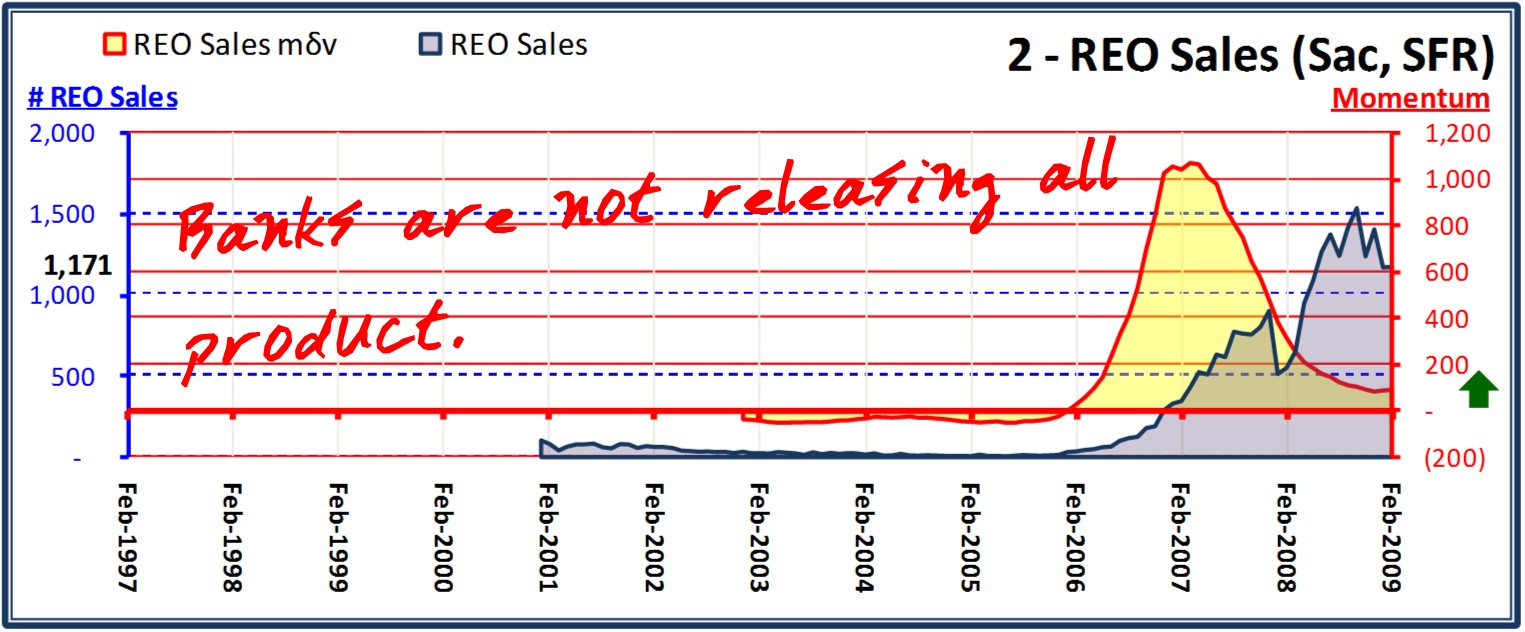
There were, however, a large number of NODs filed in February. On a per-day basis, this month has set a record in NOD filings. This means, statistically, that 80-90% of the 3,311 homes with NODs in February will be foreclosed in May or June. November and December NODs are being held off the market by many banks. The Feds have “requested” a moratorium and many lenders are just confused and don’t know what to sell and what to work out.
Our local market is supposed to improve sooner than those who have been slow to see the impact. I’m seeing a lot of activity for both Short Sales and REOs. More people are able to buy and most of them are jumping at the opportunity. If you are renting and have no other reason than affordability, now is the time to get off the fence. Build your own equity rather than your landlord’s. If you know someone who is renting, has some savings, and has a stable income, do them a favor and send them my contact information. We both will thank you.
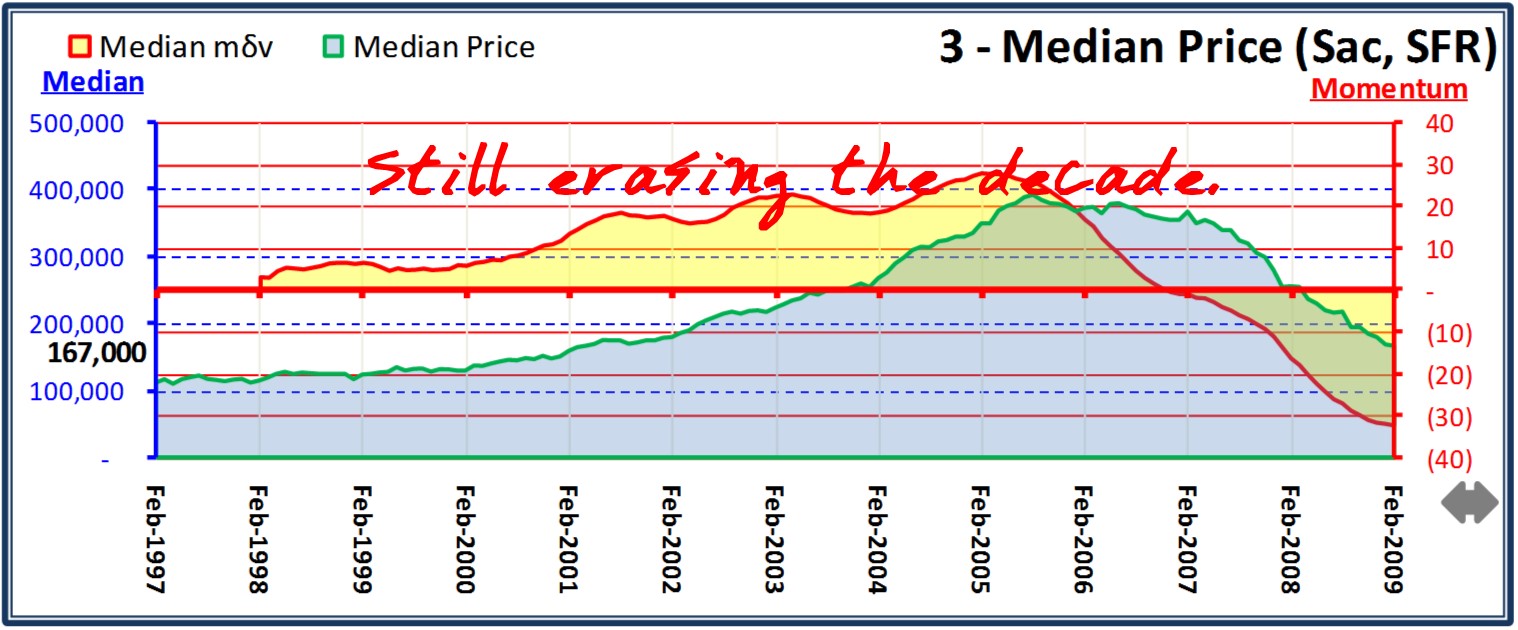
Sacramento’s median price ($167,000) is now the same as it was in April 2001. Rates had just climbed above 7% and the money was flowing. It may have been bad money, but it was getting printed. Someone on the news will soon say “the bubble has deflated”. You heard it here first.
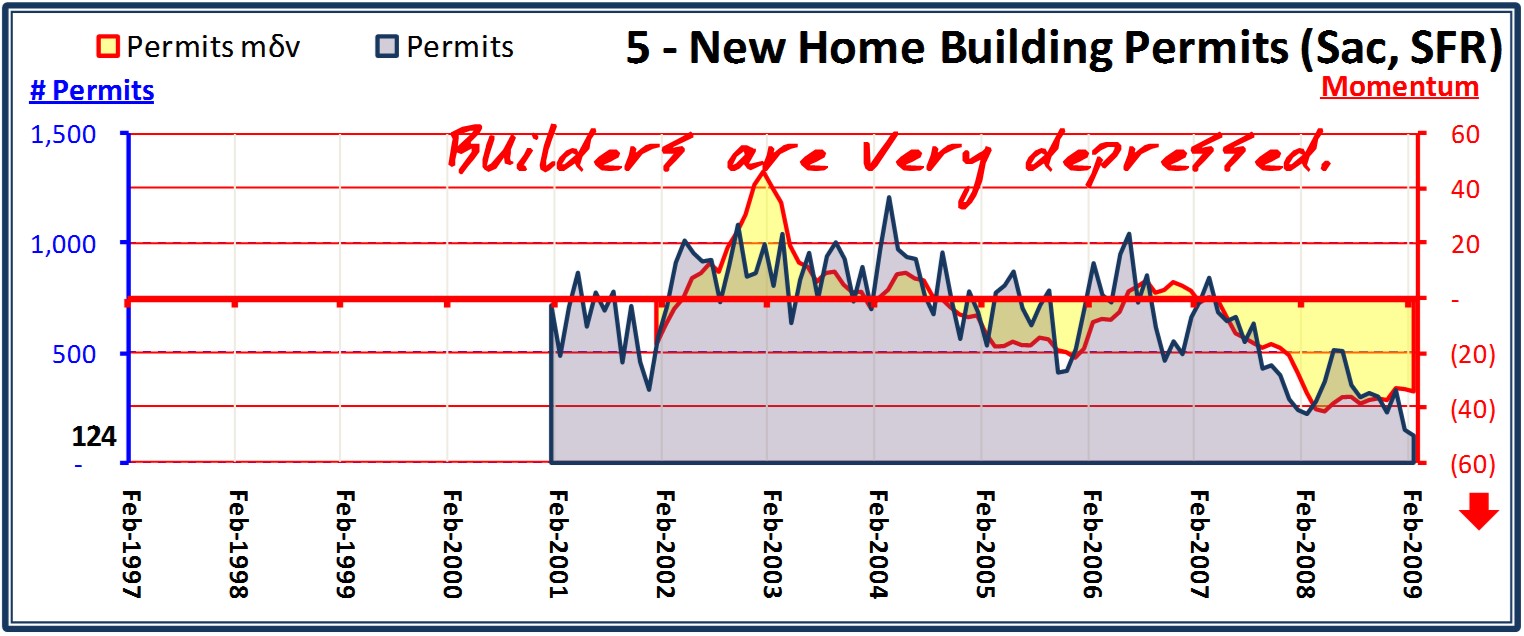
Thankfully, the builders are not adding idle product. They know they can’t compete with banks. Some of the builders have closed offices and terminated all internal sales positions. The builders are outsourcing to real estate brokers. It’s a funny relationship. And now short sales will start to get more attention.
Whatever the charts tell you, please call with your opinion or feedback. I’m making an educational show on these charts so watch your mail.