No B.S. Real Estate - June 2022
Massive Appreciation = Growing Bubble
Caveat: We all notice patterns in life. I see them in data. If that qualifies me as a geek, so be it.
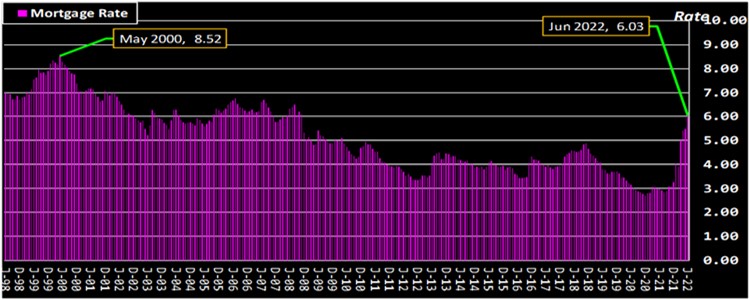
By the way, rates went up again – 30yr Fixed Rate 6.03% – that’s a 10% increase from last month (5.47%) and a 102% increase from last year (2.98%). Last year, the monthly mortgage payment for a $400k house was $2,131. Now, that house may appraise for $450k and the monthly payment would be $3,212. To maintain a payment under $2,200, the buyer is now qualified for a house price of $300k. That means sellers who COULD expect $450k can NOW expect to lose those potential buyers. The good news is that those who were qualified for $550k may now be $450k buyers [with a lingering $550k appetite]. Yeah, that doesn’t work that way. You’re welcome to correct my math.
Mortgage Rate
Jun 2022: 30yr fixed rate was 6.03%, UP 10.2% from last month and UP 102.3% from last year. The 10-year average is 3.8%. The 24-year average is 5.1%. Cost of money has a major effect on the market. www.JayEmerson.com/major
Composite Average Summary
This table shows each data element for the current month and the same month for the last 11 years. Showing the specific month each year should reflect the seasonality of residential real estate. Believe me, that seasonality is like clockwork; I’m up for a discussion about the “chicken or egg” reason for that seasonality and whether it’s changing (climate change? Grin). Average of each element is shown at the bottom so we can gauge how the month is faring but excluding the current month in that average.
May 2022 – Composite Average
SUPPLY = [New] + [Active] listings was 88, 80% of its [10yr May Avg].
[New] listings was 47, DOWN 6.0% YoY, and is 85% of its [10yr May Avg], favoring SELLERS.
[Active] listings was 41, UP 70.8% YoY, and is 74% of its [10yr May Avg], favoring SELLERS.
DEMAND = [Pended] + [Sold] listings was 73, 92% of its [10yr May Avg].
[Pended] listings was 39, DOWN 11.4% YoY, and is 95% of its [10yr May Avg], favoring BUYERS.
[Sold] listings was 34, DOWN 19.0% YoY, and is 89% of its [10yr May Avg], favoring BUYERS.
Consumption of listings was 83% – ([DEMAND]/[SUPPLY]) or 73/88 – the [10yr May Avg] is 74%
Appetite for listings was 83% – [Pended]/[New] or 39/47 – the [10yr May Avg] is 75%
Turnover of listings was 83% – [Sold]/[Active] or 34/41 – the [10yr May Avg] is 77%

Composite Average Median Price
Whether you track price, momentum, or moving average, the appreciation that has occurred in the last 2 years has been great for sellers [and listing agents] and bad for buyers [and buyer agents]. It got much worse for both sellers AND buyers when mortgage rates increased. (When demand is weakened, supply must adjust.)
Several of these charts (also at www.JayEmerson.com/Averages) show the Average Median Price (“Med”, average of 52 local zip codes), its Average Momentum (“Median Þ”), and its Average 12 Month Exponential Moving Average (“Med 12-mo EMA”). The Price data is used to calculate the other two. And each of the other two are mathematical calculations that merely depict the Price movement; they don’t redefine it.
May 2022 – Composite Average [Median Price] was $629,404, UP 1.3% MoM and UP 12.1% YoY. Composite Average [Median Price] was $238,096 10 years ago. The last [Median Price] high was $629,404 set in May 2022. THIS MONTH!
[Median Price] was 8.3% higher than the [12 mo EMA] of $581,397. The gap last month was 8.4%, last year was 11.9%.
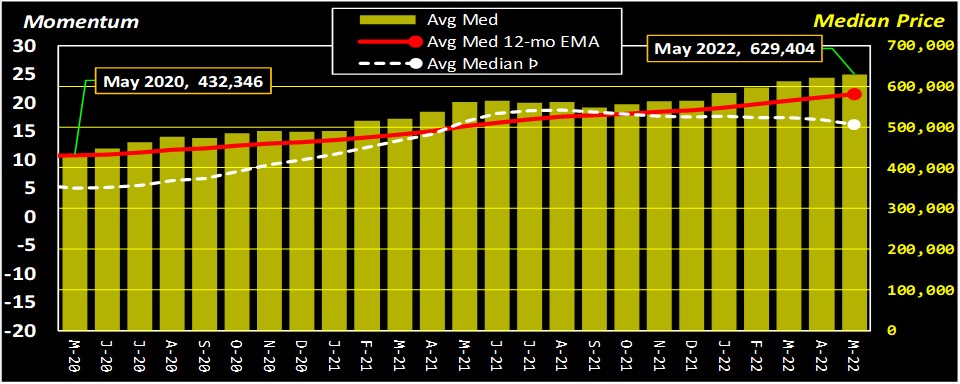
May 2022 – Average Median Price = $629,404 – Average 12-mo EMA = $581,397 – Average Median Price Momentum (Þ) = 16.14
May 2020 – Average Median Price = $432,346 – Average 12-mo EMA = $429,694 – Average Median Price Momentum (Þ) = 4.97
When prices are rising each month, the EMA is lower (math). Conversely, if prices are declining, the EMA can soon be higher. Likewise, although on a different scale and can be negative, the Momentum of a price change can show reductions while prices are still rising. The Momentum shows that the price is changing more slowly and, hence, Momentum changes before the trend of the price.
May 2009 – Composite Average [Median Price] was $272,308, DOWN 0.2% MoM and DOWN 14.9% YoY. Composite Average [Median Price] was $87,220 10 years ago. The last [Median Price] high was $415,250 set in May 2006.
[Median Price] was -7.2% lower than the [12 mo EMA] of $293,547. The gap last month was -8.3%, last year was -7.5%.
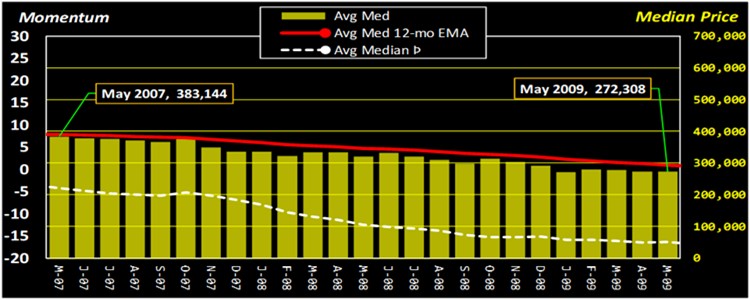
May 2009 – Average Median Price = $272,308 – Average 12-mo EMA = $293,547 – Average Median Price Momentum (Þ) = -16.42
May 2007 – Average Median Price = $383,144 – Average 12-mo EMA = $389,194 – Average Median Price Momentum (Þ) = -4.22
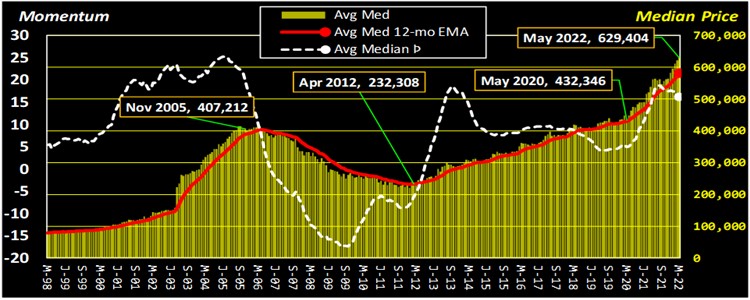
The chart for 24 years of price data shows how Price, EMA, and Momentum have behaved. Because Momentum can be used to produce profits [and avoid losses], although a family’s home shouldn’t be considered an investment, tracking and acting on the signals can be the perfect strategy for “timing the sell/buy actions” of a client.
Supply and Demand
When asked, everyone with a real estate or lender license knew that Supply was our issue for the last 18 months. And their next opinion is that Demand was much greater than usual. I created 3 simple indicators that showed how Supply and Demand resulted from the market conditions each month. The “balance sheet” indicator I call TURNOVER shows the balance of Active listings at the end of the month compared to the number of Sold listings in that month. The “cash flow” type indicator I call APPETITE shows the number of New listings in a month compared to the number of Pended listings in that same month. The final “combined” indicator I call CONSUMPTION is a combination of TURNOVER and APPETITE showing numbers of New+Active listings (Supply) compared to Pended+Sold listings (Demand).
TURNOVER
May 2022 – Composite Average [Active] listings was 41, UP 24.2% MoM and UP 70.8% YoY. [Sold] listings was 34, DOWN 12.8% MoM and DOWN 19.0% YoY. Turnover is at 83%, favoring BUYERS. Last month’s Turnover was 118%.
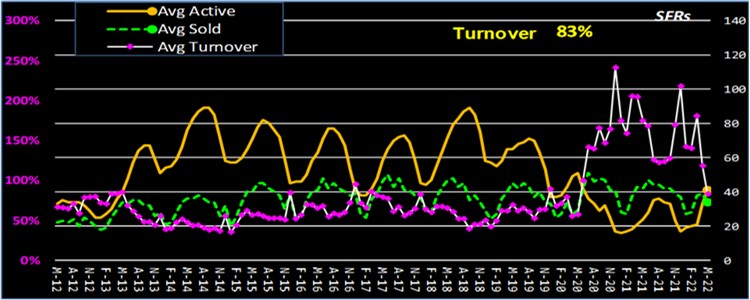
APPETITE
May 2022 – Composite Average [New] listings was 47, DOWN 6.0% MoM and DOWN 6.0% YoY. [Pended] listings was 39, UP 5.4% MoM and DOWN 11.4% YoY. Appetite is at 83% favoring BUYERS. Last month’s Appetite was 74%.

CONSUMPTION
May 2022 – Composite Average Consumption is at 83% favoring BUYERS. The calculation is (Pending+Sold)/(New+Active) and roughly represents Demand over Supply.

Trends and Friends
Inventory is how. Price is what. Psychology is why. These are forces that affect any market for any product. Buyers have a product called money. The forces affecting their money are interest rates, employment, savings, and others that are only known to the buyers. Sellers, in turn, are affected by the worthiness of buyers, market conventions, rules and regulations, and others that are only known to the sellers. When this is all combined for a particular buyer, a particular seller, for a particular house, we hopefully can reach a “meeting of the minds” and reach the buyer and seller goal.
Market Forces Model
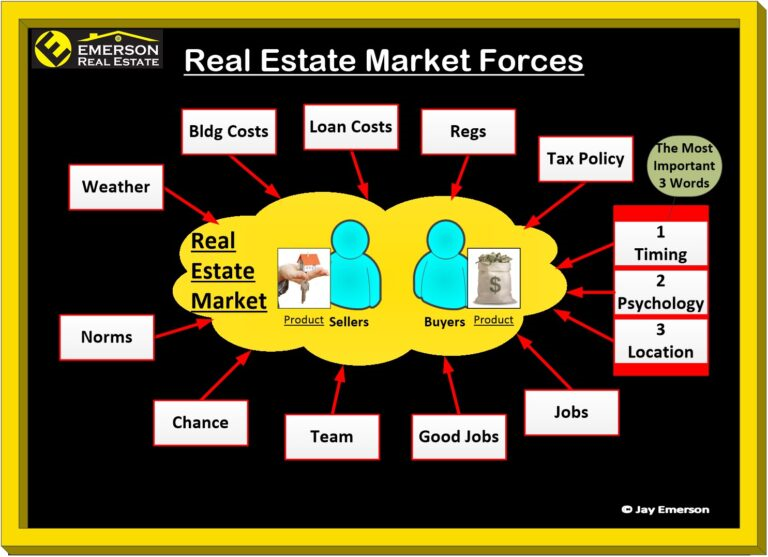
The forces affecting supply and demand are rarely tangible. Loan rates and supply are tangible. Psychology and the consequences of bad policy are not.
The most important 3 words in real estate: 1 Timing, 2 Psychology, 3 Location
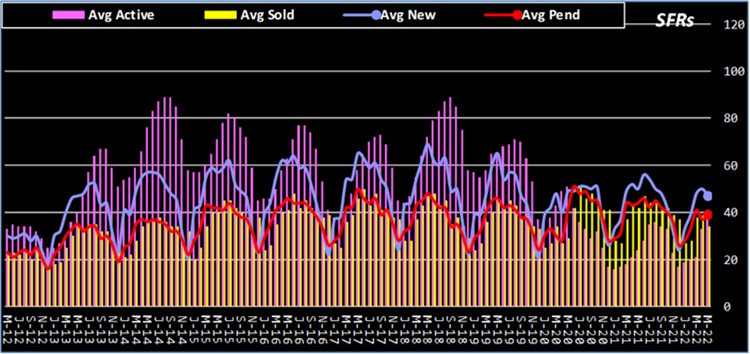
The Inventory Story
May 2022 – Composite Average
SUPPLY = [New] + [Active] listings was 88, 80% of its [10yr May Avg].
[New] listings was 47, DOWN 6.0% YoY, and is 85% of its [10yr May Avg], favoring SELLERS.
[Active] listings was 41, UP 70.8% YoY, and is 74% of its [10yr May Avg], favoring SELLERS.
DEMAND = [Pended] + [Sold] listings was 73, 92% of its [10yr May Avg].
[Pended] listings was 39, DOWN 11.4% YoY, and is 95% of its [10yr May Avg], favoring BUYERS.
[Sold] listings was 34, DOWN 19.0% YoY, and is 89% of its [10yr May Avg], favoring BUYERS.
Consumption of listings was 83% – ([DEMAND]/[SUPPLY]) or 73/88 – the [10yr May Avg] is 74%
Appetite for listings was 83% – [Pended]/[New] or 39/47 – the [10yr May Avg] is 75%
Turnover of listings was 83% – [Sold]/[Active] or 34/41 – the [10yr May Avg] is 77%
ALL INVENTORY
Showing all inventory “stages” in one chart can hide trends in any one data point. In short, a listing can be NEW, PENDED, ACTIVE, and SOLD in 1 month (rare). But also rare in this market is escrow failure (PENDING becoming ACTIVE again).
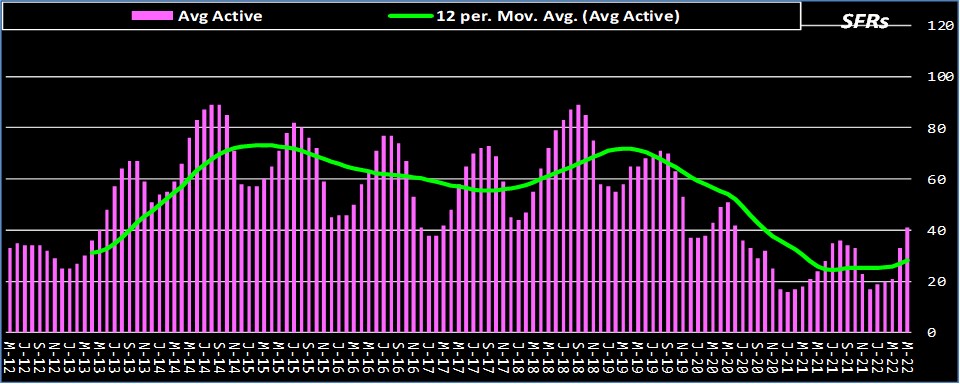
ACTIVE INVENTORY
This single data element is shown with moving average trend. This makes changes more obvious. Because of how this data is tabulated, an ACTIVE listing could have previously been PENDING. In general, these listings are outliers so double-counting may happen but it’s immaterial. This trend line is showing the drastic reduction in inventory that boosted the price appreciation in the last 2 years.
SOLD INVENTORY
When a listing is SOLD (new owner), it cannot go back to PENDING or ACTIVE.

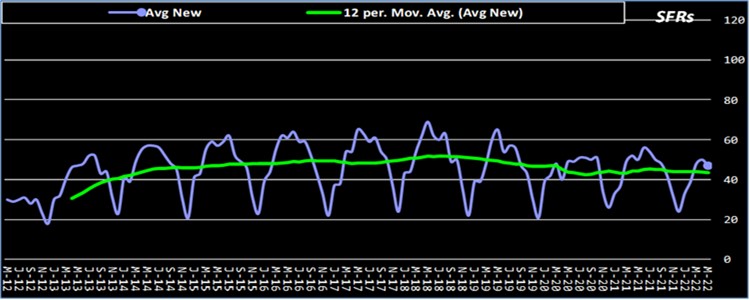
NEW INVENTORY
When a seller puts their house on the market, it is a NEW listing (ACTIVE, technically). If no sellers list their houses and, yet, there are SOLD listings, the diminishing supply puts upward pressure on prices. Although the trend line is lower in the recent years, it in no way compares to the reduction of ACTIVE listings.
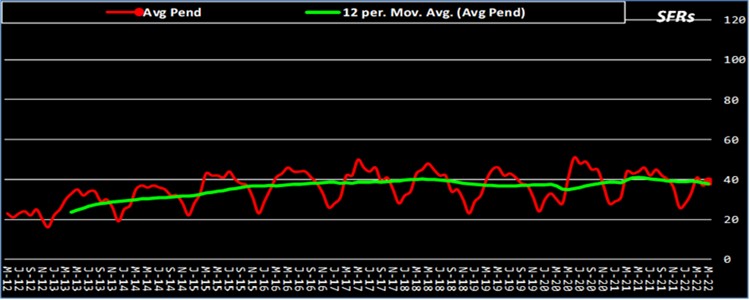
PENDED INVENTORY
When a seller and buyer reach agreement on the buyers offer, the listing becomes PENDING. Whether that buyer performs per their contractual promises or not, that listing is counted as a PENDED listing. In short, a listing can be NEW, PENDED, ACTIVE, and SOLD in 1 month (rare).
When considering Mortgage applications, interest rate movement, supply and demand trends, sentiment and confidence of buyers/sellers, my expected near-term business prospects (aka my “pipeline”), and geo-political events, it is difficult to foresee more appreciation. In fact, my opinion is that prices will start coming down.
From what I see, unless there is a drastic change, prices will come down, supply will increase. What I can’t see is how much prices will drop and where is the next “bottom”. As I am advising my sellers, if you get an offer, the bird in the hand is worth more than 3 in the bush. For my buyers, I advise that sellers will be reducing their prices EVEN THOUGH they will 1) have a choice to cancel their listing, and 2) reduce more slowly than desired.
I would love to know your thoughts. By the way, I’m never too busy for your referrals.