Preliminary October 2022 data as of 10/23/22 — 6 of 21 (29%) work days left in October (only on work days can a listing become SOLD). PENDED listings are not shown since they cannot be easily associated with this month; it could easily be last month’s data or they could once have been Pending and now Active again.
Every County and almost every zip code is showing drastic year-over-year increases in SUPPLY and drastic decreases in DEMAND (I think 95661 has some “under-reporting”). Mathematically, that difference (Turnover = SOLD/ACTIVE) pushes prices down until SUPPLY and DEMAND are in “equilibrium”. This is the classic “whipsaw” situation when SUPPLY is limited for an extended period then DEMAND drops and we have a glut of inventory. This is a known phenomenon in manufacturing. It will return to normal but there are external forces that must allow “free market” to happen again, organically.
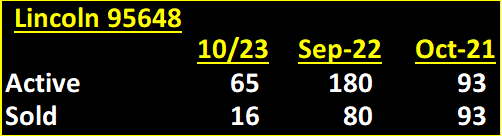
Some zip codes, my guess also preliminary, like Lincoln, are already seeing a correction to their whipsaw/glut. But it’s not looking like prices are moving higher anywhere.
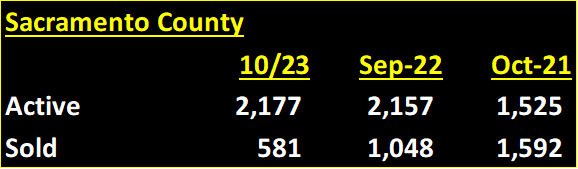
2,177 Active listings on MLS, +0.9% MoM, and +42.8% YoY.
581 Sold listings on MLS, -44.6% MoM, and -63.5% YoY.
Turnover is 27%. Last month’s Turnover was 49%. Last year was 104%.
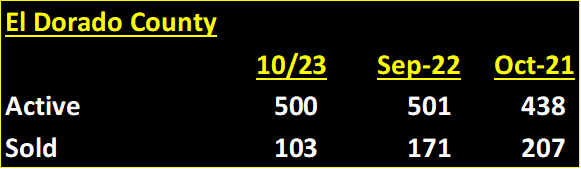
500 Active listings on MLS, -0.2% MoM, and +14.2% YoY.
103 Sold listings on MLS, -39.8% MoM, and -50.2% YoY.
Turnover is 21%. Last month’s Turnover was 34%. Last year was 47%.
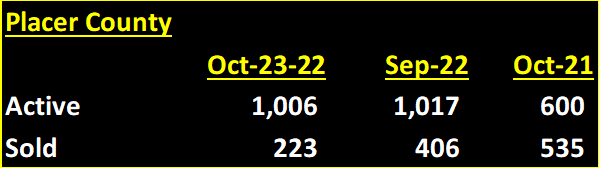
1,006 Active listings on MLS, -1.1% MoM, and +67.7% YoY.
223 Sold listings on MLS, -45.1% MoM, and -58.3% YoY.
Turnover is 22%. Last month’s Turnover was 40%. Last year was 89%.
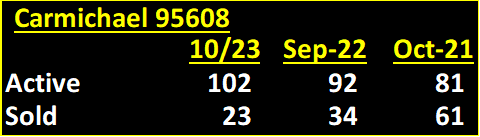
102 Active listings on MLS, +10.9% MoM, and +25.9% YoY.
23 Sold listings on MLS, -32.4% MoM, and -62.3% YoY.
Turnover is 23%. Last month’s Turnover was 37%. Last year was 75%.
69 Active listings on MLS, 0.0% MoM, and +38.0% YoY.
18 Sold listings on MLS, -48.6% MoM, and -66.7% YoY.
Turnover is 26%. Last month’s Turnover was 51%. Last year was 108%.
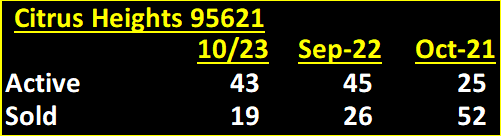
43 Active listings on MLS, -4.4% MoM, and +72.0% YoY.
19 Sold listings on MLS, -26.9% MoM, and -63.5% YoY.
Turnover is 44%. Last month’s Turnover was 58%. Last year was 208%.
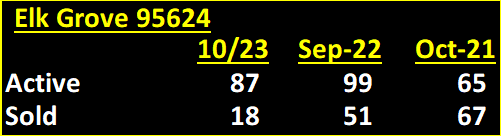
87 Active listings on MLS, -12.1% MoM, and +33.8% YoY.
18 Sold listings on MLS, -64.7% MoM, and -73.1% YoY.
Turnover is 21%. Last month’s Turnover was 52%. Last year was 103%.
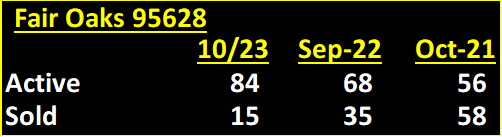
84 Active listings on MLS, +23.5% MoM, and +50.0% YoY.
15 Sold listings on MLS, -57.1% MoM, and -74.1% YoY.
Turnover is 18%. Last month’s Turnover was 51%. Last year was 104%.
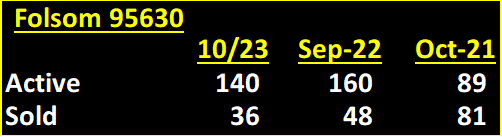
140 Active listings on MLS, -12.5% MoM, and +57.3% YoY.
36 Sold listings on MLS, -25.0% MoM, and -55.6% YoY.
Turnover is 26%. Last month’s Turnover was 30%. Last year was 91%.
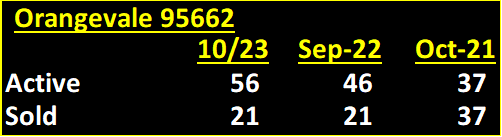
56 Active listings on MLS, +21.7% MoM, and +51.4% YoY.
21 Sold listings on MLS, 0.0% MoM, and -43.2% YoY.
Turnover is 38%. Last month’s Turnover was 46%. Last year was 100%.
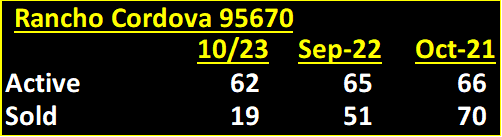
62 Active listings on MLS, -4.6% MoM, and -6.1% YoY.
19 Sold listings on MLS, -62.7% MoM, and -72.9% YoY.
Turnover is 31%. Last month’s Turnover was 78%. Last year was 106%.
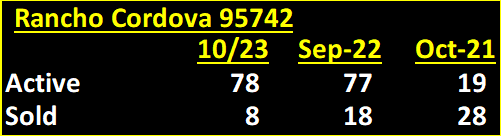
78 Active listings on MLS, +1.3% MoM, and +310.5% YoY.
8 Sold listings on MLS, -55.6% MoM, and -71.4% YoY.
Turnover is 10%. Last month’s Turnover was 23%. Last year was 147%.
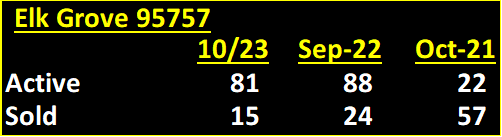
81 Active listings on MLS, -8.0% MoM, and +268.2% YoY.
15 Sold listings on MLS, -37.5% MoM, and -73.7% YoY.
Turnover is 19%. Last month’s Turnover was 27%. Last year was 259%.
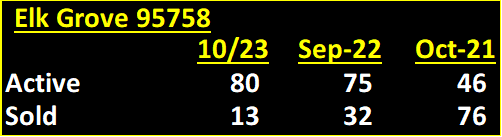
80 Active listings on MLS, +6.7% MoM, and +73.9% YoY.
13 Sold listings on MLS, -59.4% MoM, and -82.9% YoY.
Turnover is 16%. Last month’s Turnover was 43%. Last year was 165%.
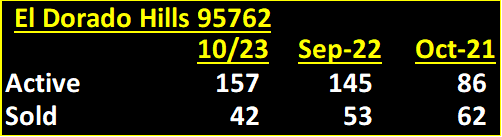
157 Active listings on MLS, +8.3% MoM, and +82.6% YoY.
42 Sold listings on MLS, -20.8% MoM, and -32.3% YoY.
Turnover is 27%. Last month’s Turnover was 37%. Last year was 72%.
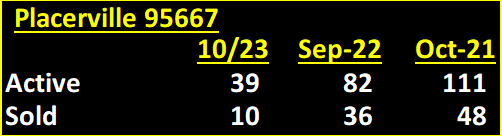
39 Active listings on MLS, -52.4% MoM, and -64.9% YoY.
10 Sold listings on MLS, -72.2% MoM, and -79.2% YoY.
Turnover is 26%. Last month’s Turnover was 44%. Last year was 43%.
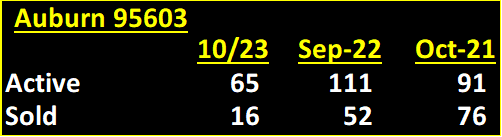
65 Active listings on MLS, -41.4% MoM, and -28.6% YoY.
16 Sold listings on MLS, -69.2% MoM, and -78.9% YoY.
Turnover is 25%. Last month’s Turnover was 47%. Last year was 84%.
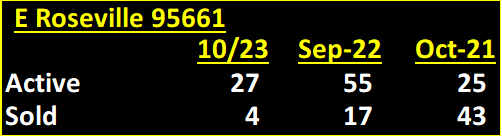
27 Active listings on MLS, -50.9% MoM, and +8.0% YoY.
4 Sold listings on MLS, -76.5% MoM, and -90.7% YoY.
Turnover is 15%. Last month’s Turnover was 31%. Last year was 172%.
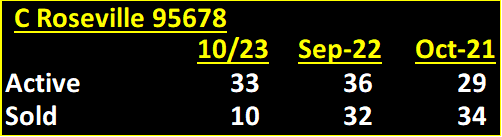
33 Active listings on MLS, -8.3% MoM, and +13.8% YoY.
10 Sold listings on MLS, -68.8% MoM, and -70.6% YoY.
Turnover is 30%. Last month’s Turnover was 89%. Last year was 117%.
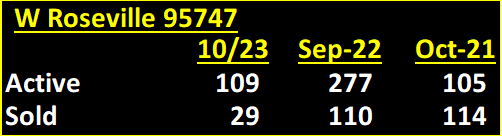
109 Active listings on MLS, -60.6% MoM, and +3.8% YoY.
29 Sold listings on MLS, -73.6% MoM, and -74.6% YoY.
Turnover is 27%. Last month’s Turnover was 40%. Last year was 109%.
65 Active listings on MLS, -63.9% MoM, and -30.1% YoY.
16 Sold listings on MLS, -80.0% MoM, and -82.8% YoY.
Turnover is 25%. Last month’s Turnover was 44%. Last year was 100%.
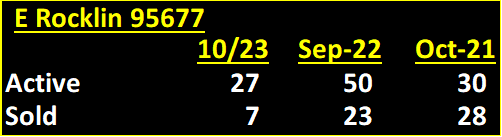
27 Active listings on MLS, -46.0% MoM, and -10.0% YoY.
7 Sold listings on MLS, -69.6% MoM, and -75.0% YoY.
Turnover is 26%. Last month’s Turnover was 46%. Last year was 93%.
(this space intentionally left blank)
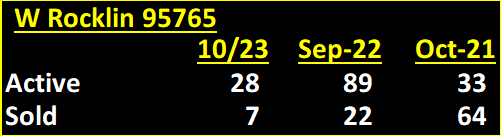
28 Active listings on MLS, -68.5% MoM, and -15.2% YoY.
7 Sold listings on MLS, -68.2% MoM, and -89.1% YoY.
Turnover is 25%. Last month’s Turnover was 25%. Last year was 194%.