
Major Real Estate Market Forces - Employment
Having a job improves sentiment, confidence and home sales.
Monthly Data through August 31, 2026
Housing does not move in isolation. Mortgage rates determine buying power. Employment supports qualification. Confidence and sentiment influence willingness to act. Construction measures reveal what future supply may look like. Together, these major forces explain why a market can have stable prices, cautious buyers, and restrained transaction volume at the same time.
Employment
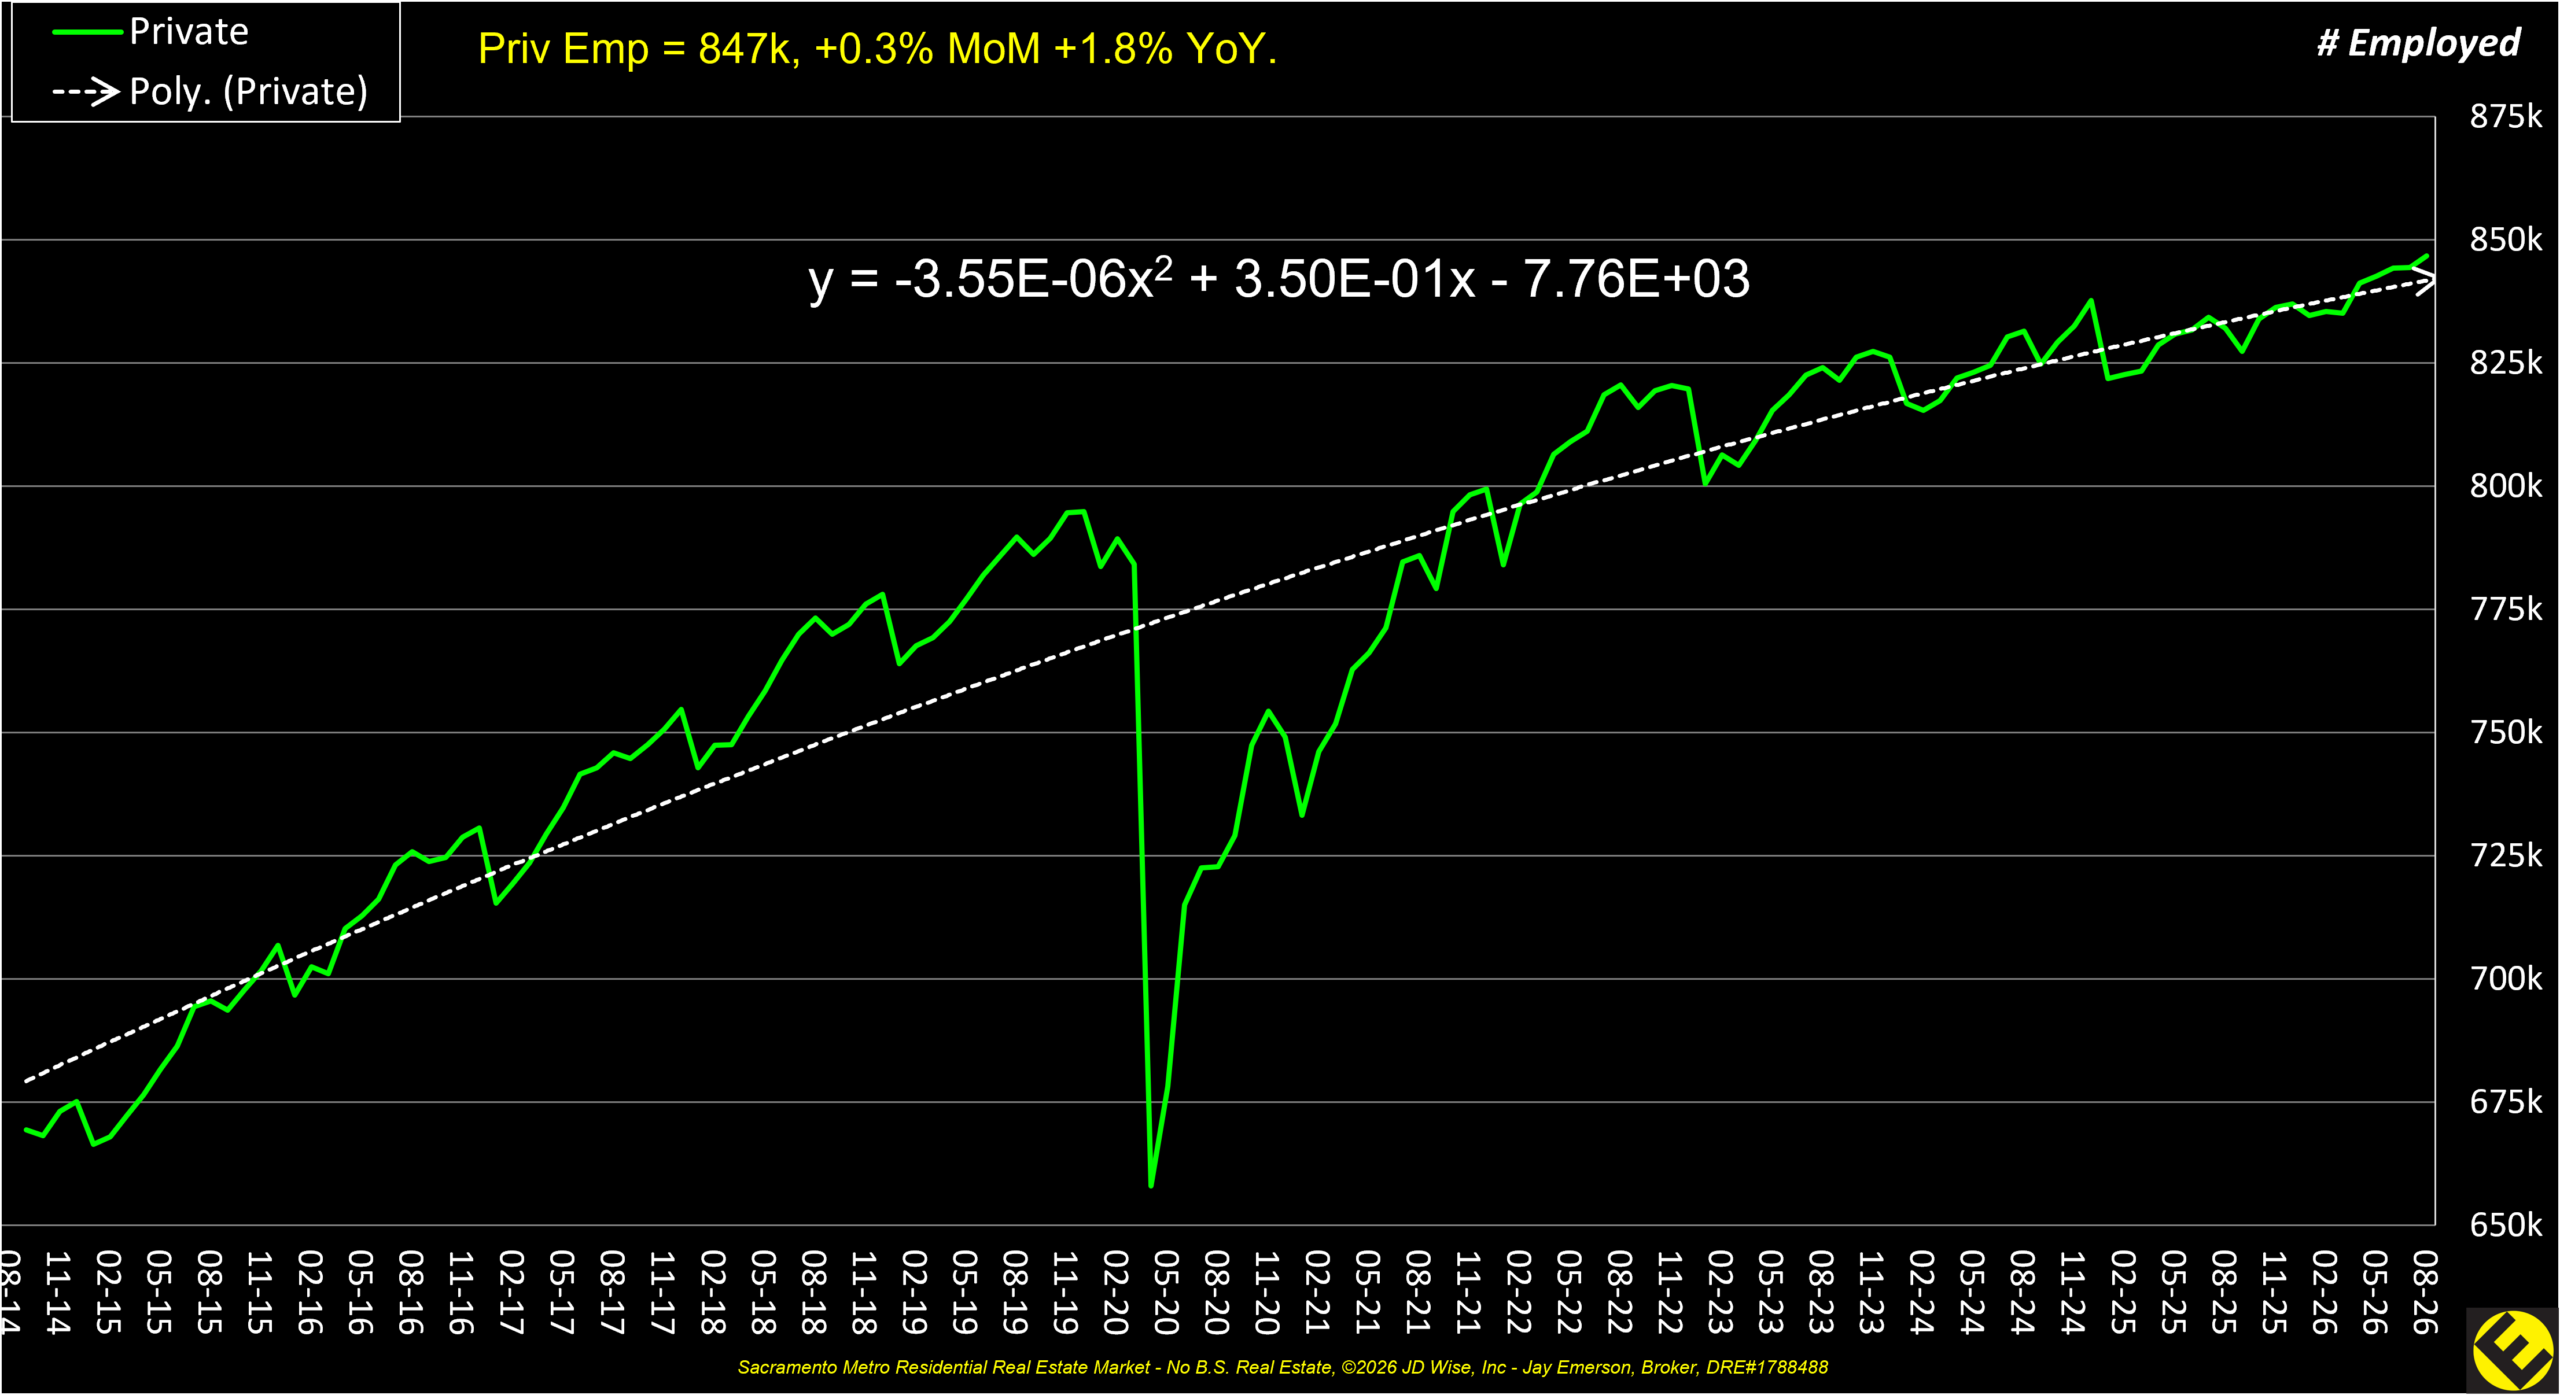
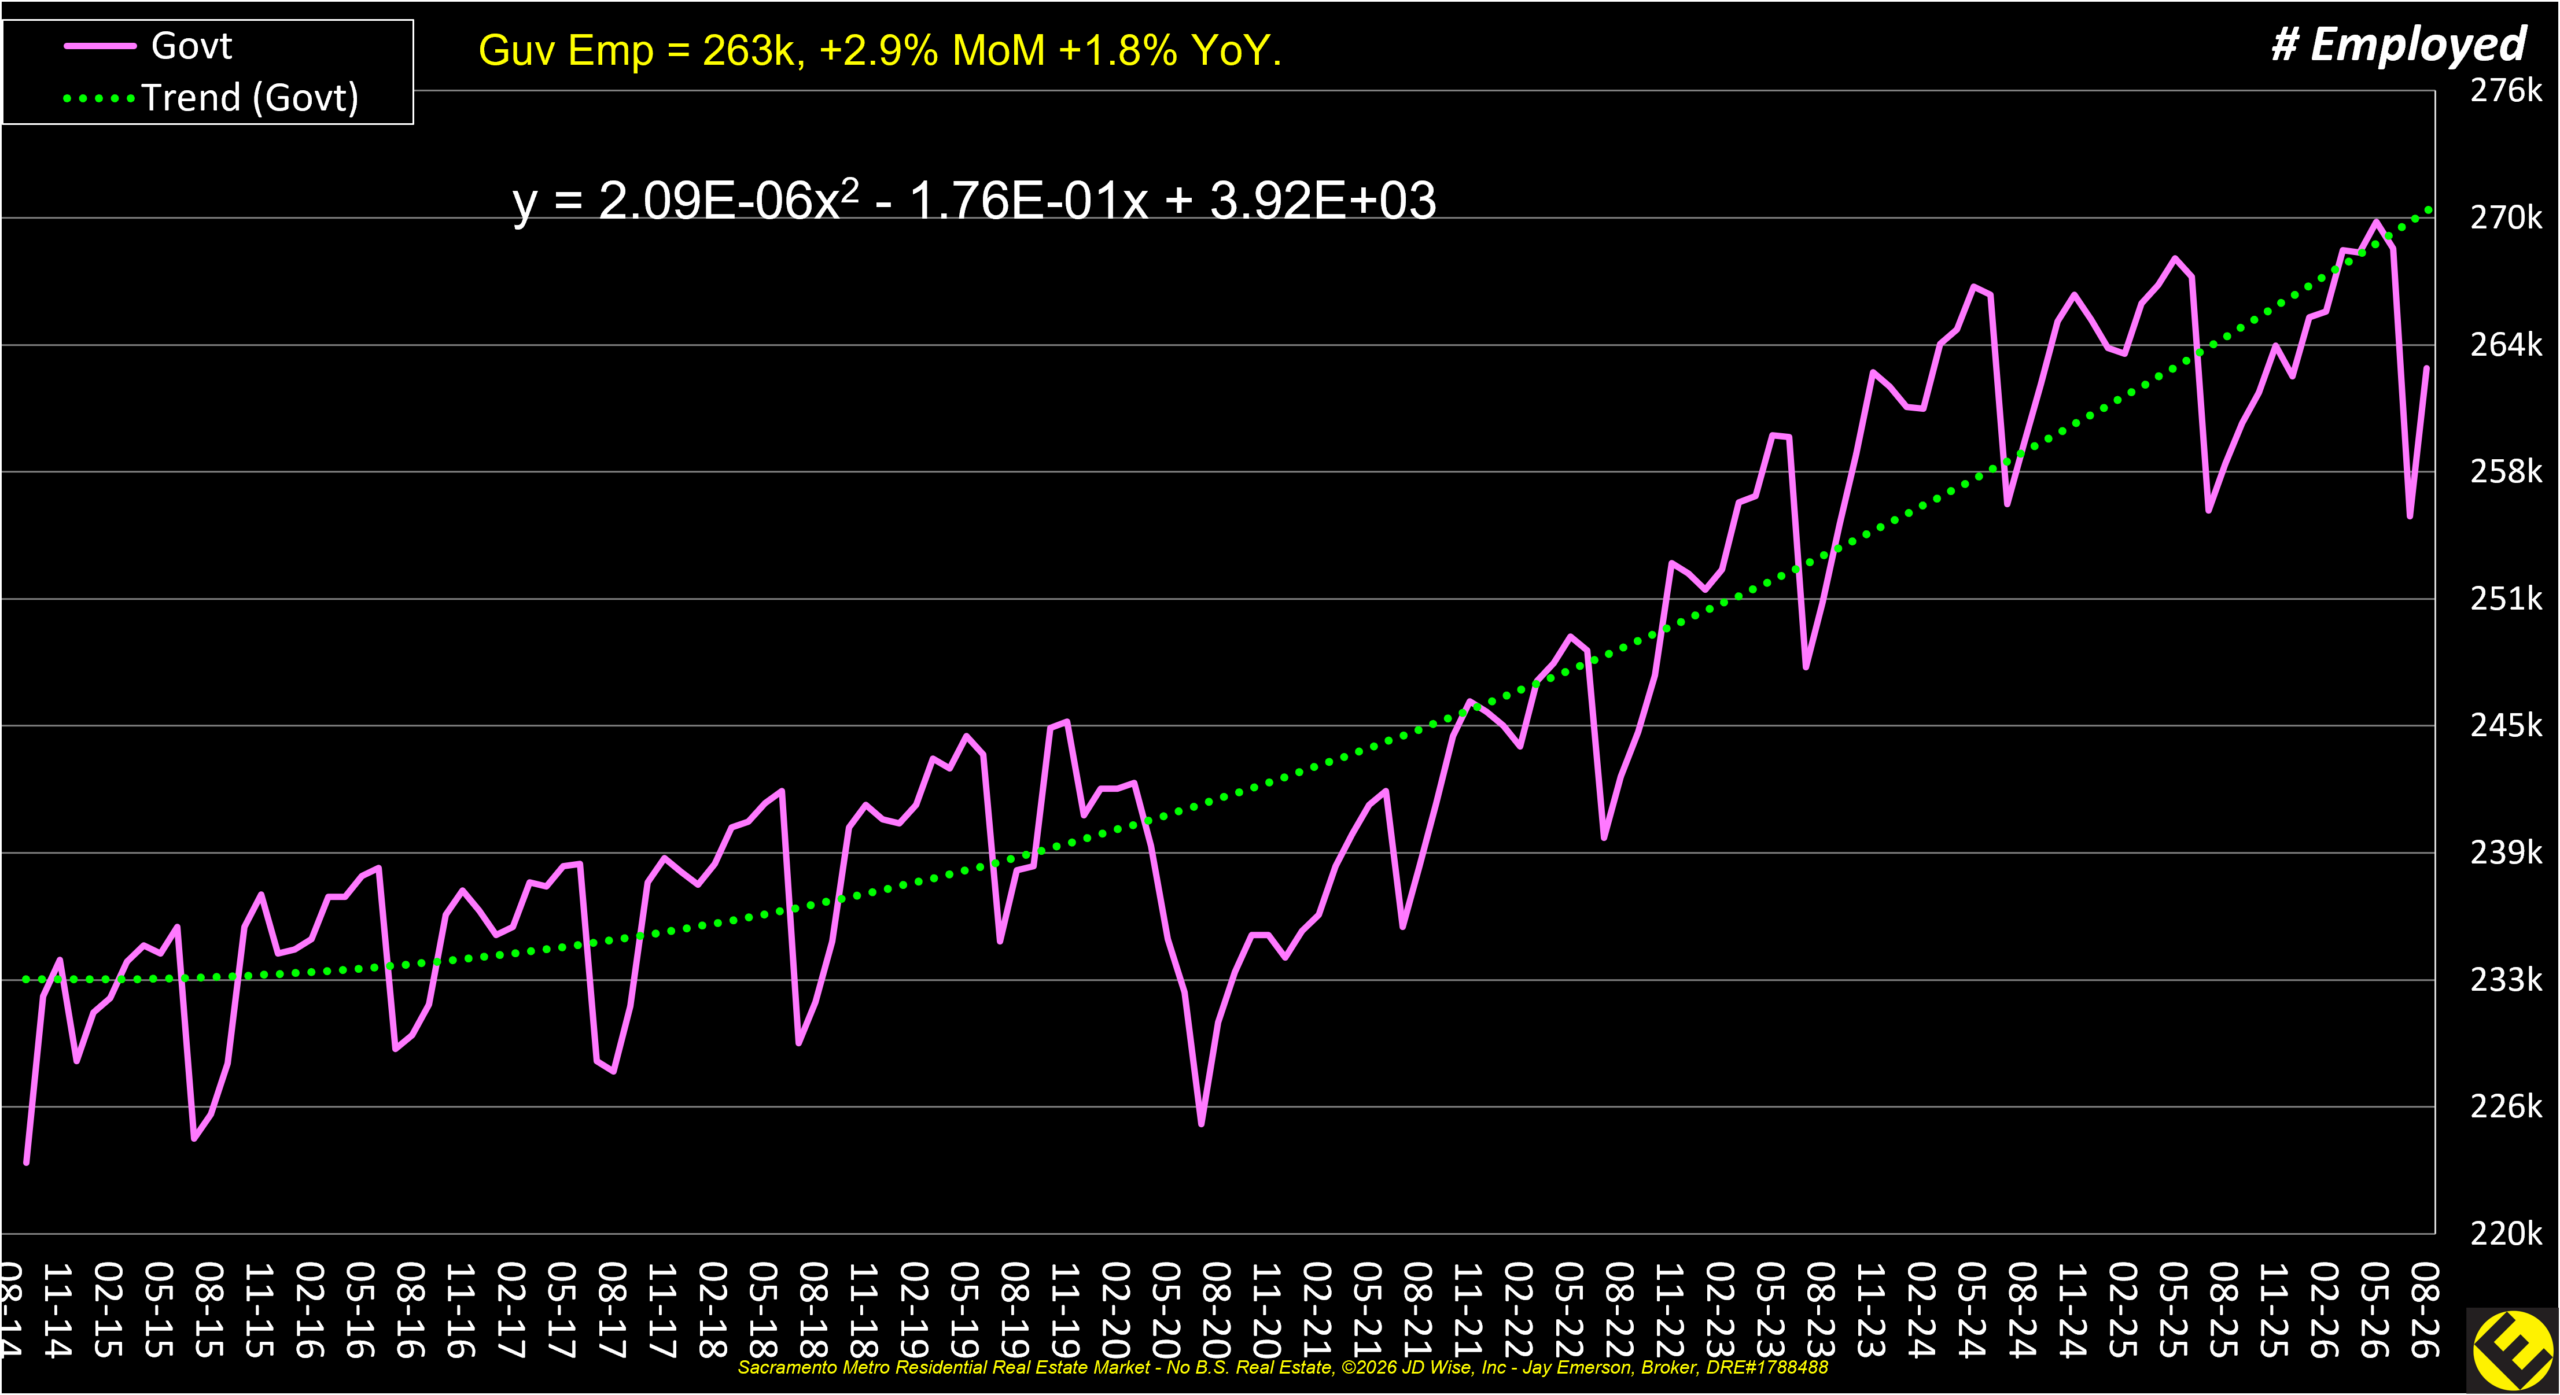
Both curves are still rising through August 2026. Neither equation is a forecast. Each is the smooth line drawn through the monthly counts from August 2014 to August 2026. The spring 2020 drop is real on both charts. The curve does not follow that hole. It runs through it.
Private employment. August is 847,000. That is up 0.3% from July and up 1.8% from August 2025. The fitted curve at August is about 834,000, so the actual count sits about 13,000 above the line. The bend in the equation is slightly downward. The climb has not stopped. It has slowed. In 2014 the curve was adding roughly 1,600 jobs a month. By August 2026 it is adding roughly 650 a month. The last year rose faster than that current pace.
Government employment. August is 263,000. That is up 2.9% from July and up 1.8% from August 2025. The 2.9% is one month, the jump at the right edge after a dip. It is not the speed of the long curve. The fitted curve at August is about 250,000, so the actual count sits about 13,000 above the line. The bend is upward. Around 2015 the curve was flat. By August 2026 it is adding roughly 500 jobs a month, and that pace has been increasing.
Private Employment Share
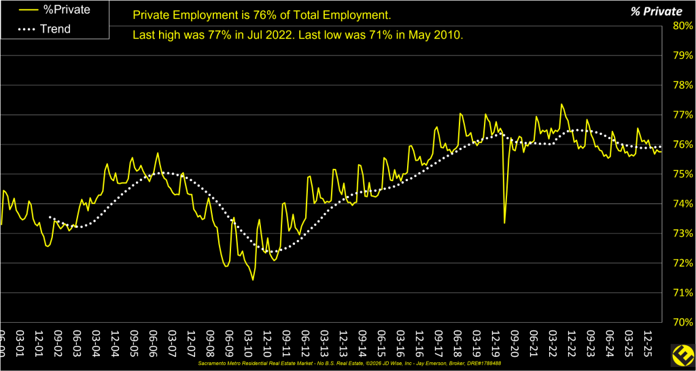
Private employment share is the percentage of total employment supplied by private-sector employers rather than government. It helps show the balance between market-driven employment and the public-sector base.
Private employment represents 76% of total employment, close to the long-run high of 77%. This indicates that the regional economy is not dependent on government employment alone. A broad private-sector base generally improves housing resilience because demand is supported by a wider range of industries and incomes.
Nonfarm Payroll - Third Estimate
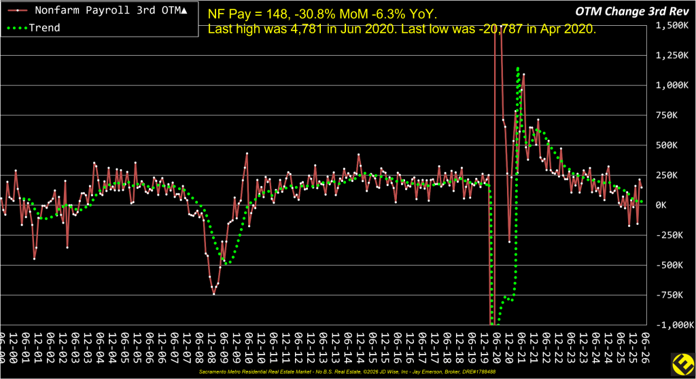
Nonfarm payroll growth is a broad measure of job creation outside the farm sector. Employment growth supports household formation, loan qualification, and the ability to carry housing costs. This chart uses the third available estimate, which incorporates later revisions.
June 2026 is on the two payroll charts. Nonfarm payrolls read 31k, −50.8% MoM, +338.5% YoY. The revision reads −26k, +76.1% MoM, +83.8% YoY. Both are the third estimate, dated 06-26, two months behind the August housing report.
June jobs were a small gain. The big percent is not a boom.
Nonfarm payrolls are the national count of jobs added or lost, in thousands. They are not a Sacramento MLS number and not a count of local closings.
June 2026 is on the two payroll charts. Nonfarm payrolls read **31k**, **−50.8% MoM**, **+338.5% YoY**. The revision reads **−26k**, **+76.1% MoM**, **+83.8% YoY**. Both are the third estimate, dated 06-26, two months behind the August housing report.
| Jun-26 | Versus May | Versus June 2025 | |
| Payroll change, 3rd estimate | 31,000 | −50.8% (May was +63,000) | +338.5% (June 2025 was −13,000) |
| Revision of that change | −26,000 | +76.1% (May’s revision was −109,000) | +83.8% (June 2025’s revision was −160,000) |
**June jobs were a small gain. The big percent is not a boom.**
Nonfarm payrolls are the national count of jobs added or lost, in thousands. They are not a Sacramento MLS number and not a count of local closings.
The year-over-year percent looks large because June 2025 was a loss. Going from a loss of 13,000 to a gain of 31,000 is a swing of 44,000 jobs. That is a small month on a national payroll of more than 150 million. Half of May’s gain disappeared in June.
The revision is still negative. A negative revision means the first report counted too many jobs, and a later report took them off. June’s cut is 26,000. May’s cut was 109,000. June 2025’s cut was 160,000. The correction got smaller. It did not turn into added jobs.
Across the 12-year charts, the 2020 break is the spike and the crash. After the 2021 rebound, monthly job gains stepped down toward zero. June sits just above zero, on that flatter stretch. Revisions over the last few years have mostly been at or below zero. The first headline has often been the high one.
For housing, a paycheck is what clears a mortgage payment. A month that adds few jobs, then revises some of them away, is a softer national backdrop for buyer demand than a month that adds several hundred thousand. It does not set the Sacramento median, the months of inventory, or a zip-code Lean Score. Those are local counts. This is the national jobs print, and it is two months older than the August MLS report.
This is not a prediction and not advice.
Jay Emerson, Broker, Emerson Real Estate. Cal DRE# 01788488.
Payroll revisions show how much the third estimate changed from earlier estimates. Revisions matter because the first release can overstate or understate the true pace of hiring.
Price, condition, financing strategy, and timing matter more than ever.
Jay Emerson, Broker Masters Club – Outstanding Life Member – DRE#1788488 |