
Major Real Estate Market Forces
What is shaping the Sacramento Metro housing market?
Monthly Data through June 30, 2026
Housing does not move in isolation. Mortgage rates determine buying power. Employment supports qualification. Confidence and sentiment influence willingness to act. Construction measures reveal what future supply may look like. Together, these major forces explain why a market can have stable prices, cautious buyers, and restrained transaction volume at the same time.
June 2026 in one sentence
The market is being held back by financing costs and cautious consumers, supported by stable employment, and protected from excess supply by restrained permitting and single-family construction.
Mortgage Rate
The 30-year mortgage rate is the cost of borrowing for a typical long-term home loan. It directly affects monthly payments, purchasing power, refinancing activity, and the number of buyers who can qualify.
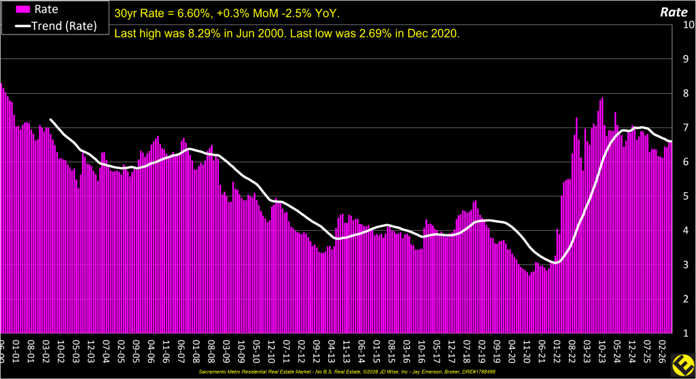
At 6.60%, the rate is still far above the 2.69% low reached in December 2020. The month-over-month increase of 0.3% means affordability became slightly tighter in June, while the 2.5% year-over-year decline offers modest relief compared with last year. For buyers, financing remains the central constraint. For sellers, the rate environment continues to limit the pool of qualified purchasers and encourages realistic pricing.
Consumer Confidence
The Consumer Confidence Index measures how households view current business and labor conditions and what they expect in the near future. Confidence influences willingness to make large commitments such as buying or selling a home.
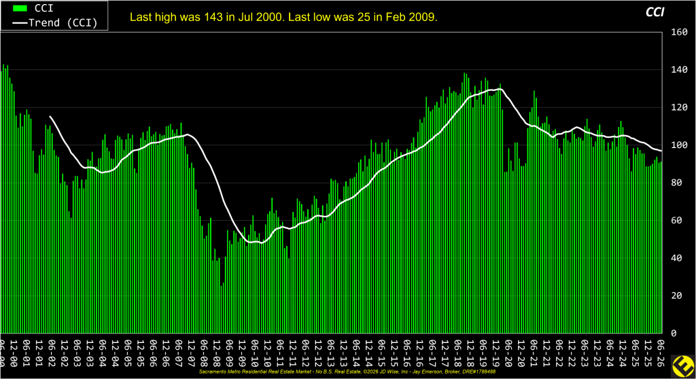
The index is well below its long-term high of 143 and the trend has been easing. That suggests households remain cautious rather than broadly optimistic. Caution does not eliminate housing demand, but it can delay discretionary moves, reduce bidding intensity, and increase sensitivity to price and monthly payment.
Consumer Sentiment
Consumer Sentiment measures how households feel about their personal finances, inflation, and the economy. It differs from confidence in methodology, but it serves a similar purpose: it helps explain whether consumers feel secure enough to act.
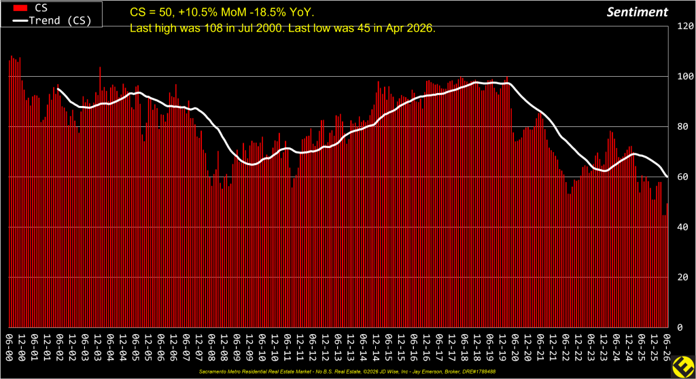
Sentiment improved to 50 in June, up 10.5% from May, but remains 18.5% below a year earlier and only slightly above the April 2026 low of 45. The rebound is encouraging, yet the level still reflects a guarded consumer. Housing decisions are therefore more likely to be necessity-driven than enthusiasm-driven.
Government Employment
Government employment is an important stabilizing force in the Sacramento region because state, local, and federal jobs support a large base of relatively dependable household income. But, “we the people” does not mean “we the government”.
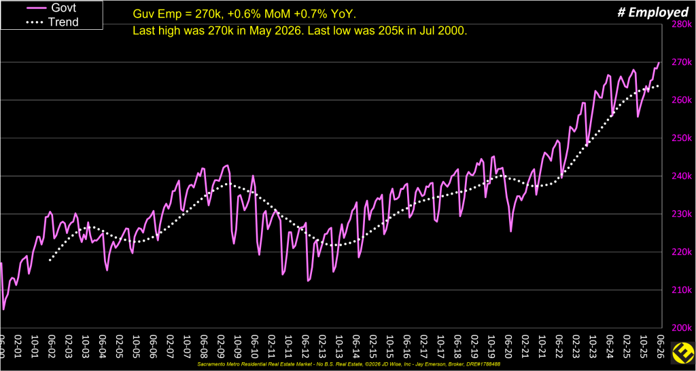
Government employment reached 270,000, up 0.6% month over month and 0.7% year over year. A growing public-sector workforce supports housing demand by adding income stability and reducing the risk of a broad local employment shock. It does not guarantee stronger sales, but it strengthens the region’s underlying capacity to absorb housing costs.
My opinion of government is not that it shouldn’t exist. Rather,
- public servants should be temporary workers,
- colleges should not offer a degree for “Public Administration/Service”,
- government workers, being temporary, should not rely on that stint for a pension [Lois Lerner],
- if a legislature leads a municipality into “the red”, their pay should be ceased,
- every new law requires that an old law be revoked,
- every program should measure and PROVE its return on spending EVERY year.
We will have to get serious about this absence of logic. The math doesn’t work.
Housing Market Index
The Housing Market Index reflects home-builder confidence in current sales, expected sales, and buyer traffic. Builders respond quickly to changes in demand, financing costs, land costs, and regulation, so this index is a useful forward-looking housing signal.
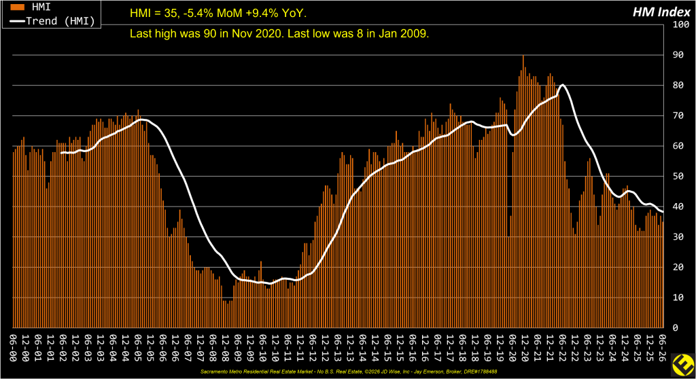
The index is 35, down 5.4% from May but 9.4% above last year. A reading below 50 indicates more builders view conditions as poor than good. The year-over-year improvement suggests conditions are better than a year ago, but the monthly decline shows that builders are still encountering meaningful resistance from affordability and buyer traffic.
Home Permits
Building permits are approvals that allow future residential construction to begin. They are an early indicator of the housing supply pipeline because permits usually precede starts and completions.
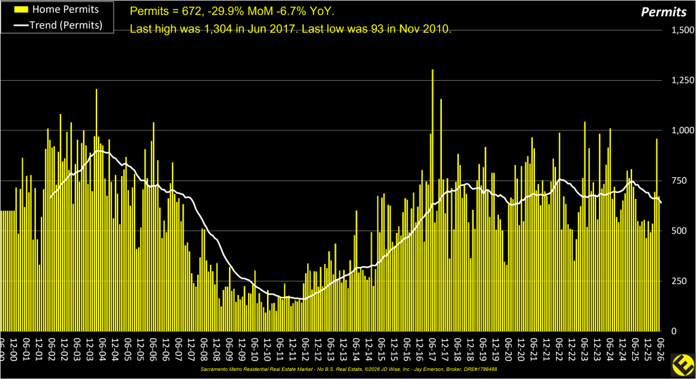
Permits fell to 672, down 29.9% from May and 6.7% from a year ago. That is a meaningful short-term contraction in the future supply pipeline. Fewer permits can limit new inventory later, which may support existing-home prices, but it also signals caution among builders and developers.
Construction Spending
Construction spending measures the dollar value of construction put in place. It reflects activity across labor, materials, land development, and project execution, and therefore captures both physical building and the effects of construction-cost inflation.
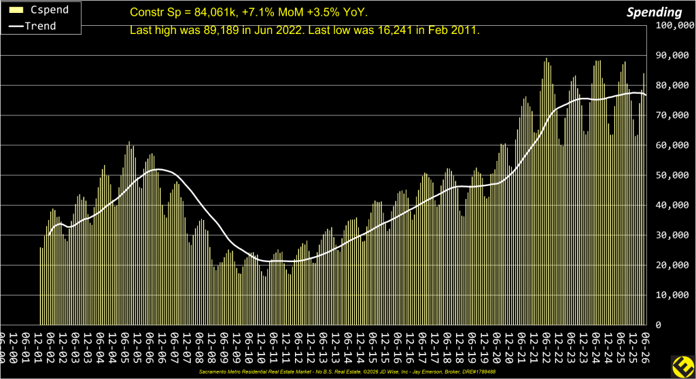
Spending rose to 84,061, up 7.1% month over month and 3.5% year over year, and remains near the June 2022 high of 89,189. Strong spending indicates substantial construction activity and/or high input costs. In housing terms, this supports employment and economic activity, but it does not necessarily mean that a large volume of affordable homes is being produced.
New Homes Sold
New-home sales measure purchases of newly constructed homes. The series is especially sensitive to mortgage rates, builder incentives, and the availability of resale inventory.
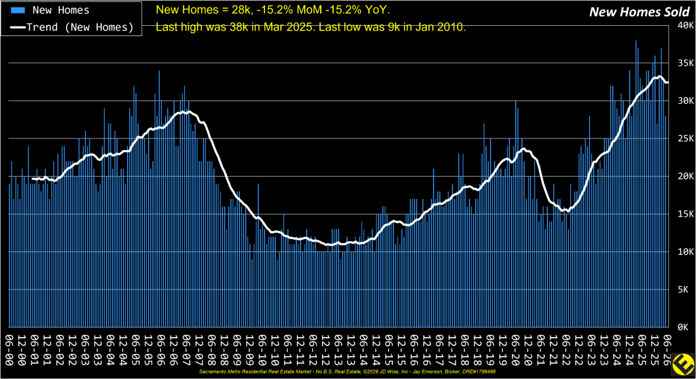
Sales declined to 28,000, down 15.2% from both May and a year ago. The drop indicates weaker buyer absorption of new construction despite the longer-term expansion visible in the trend. Builders may respond with incentives, smaller plans, price adjustments, or slower production.
Nonfarm Payroll - Third Estimate
Nonfarm payroll growth is a broad measure of job creation outside the farm sector. Employment growth supports household formation, loan qualification, and the ability to carry housing costs. This chart uses the third available estimate, which incorporates later revisions.
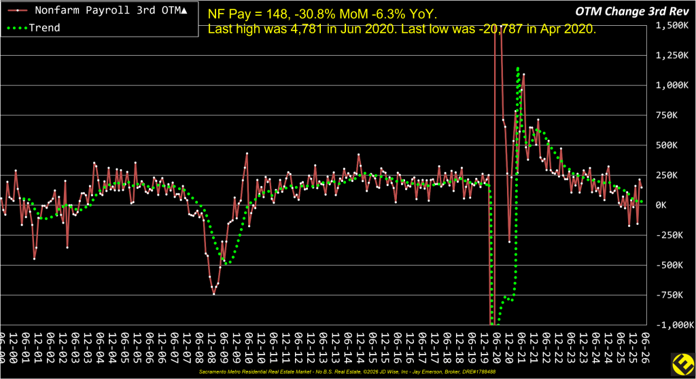
The latest reading is 148, down 30.8% from May and 6.3% from a year ago. Job growth remains positive, but the pace has slowed. That means the economy is still adding employment, yet with less momentum. For housing, slower job creation can reduce the number of new buyers entering the market and make households more cautious.
Nonfarm Payroll - Third Revision
Payroll revisions show how much the third estimate changed from earlier estimates. Revisions matter because the first release can overstate or understate the true pace of hiring.
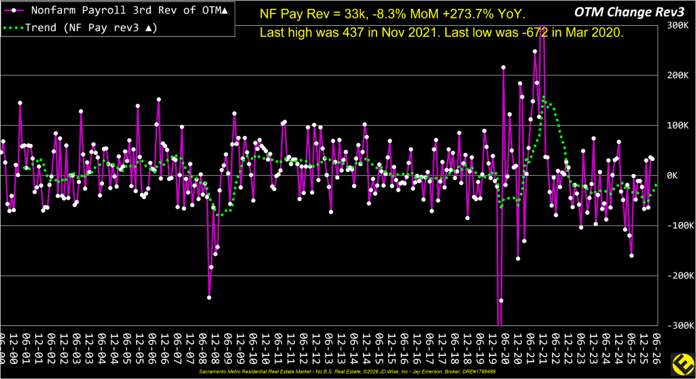
The revision is positive at 33,000, although it is 8.3% lower than the prior month. The very large year-over-year percentage reflects comparison with a weak or negative base. A positive revision means the employment picture was somewhat stronger than initially reported, but the volatility of this series argues for using it as a confirmation signal rather than a stand-alone forecast.
Private Employment Share
Private employment share is the percentage of total employment supplied by private-sector employers rather than government. It helps show the balance between market-driven employment and the public-sector base.
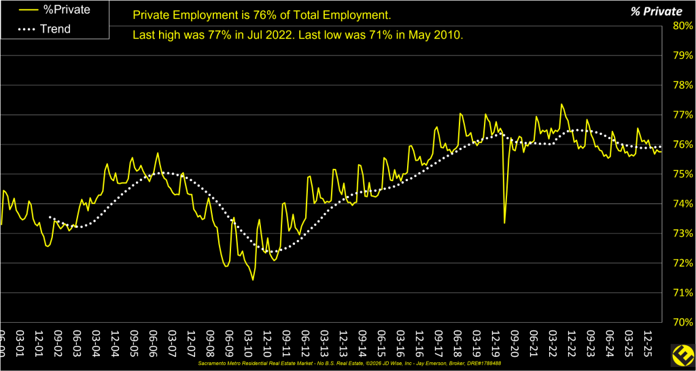
Private employment represents 76% of total employment, close to the long-run high of 77%. This indicates that the regional economy is not dependent on government employment alone. A broad private-sector base generally improves housing resilience because demand is supported by a wider range of industries and incomes.
Single-Family Starts
Single-family starts measure homes on which construction has actually begun. Starts come after permits and are a direct indicator of future additions to the detached-home supply.
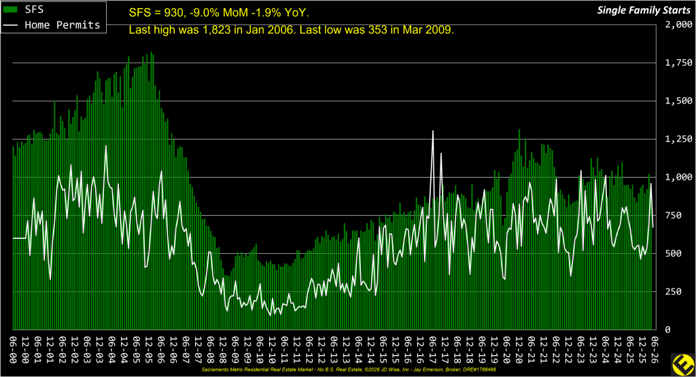
Starts declined to 930, down 9.0% from May and 1.9% from a year ago. The decline shows builders are proceeding more cautiously. Slower starts can help prevent overbuilding, but they also limit future supply in a region where affordability depends partly on adding more homes.
What these forces mean together
Affordability remains the first gate. A 6.60% mortgage rate keeps monthly payments high and limits the number of households that can qualify at today’s prices.
Demand is cautious, not absent. Confidence is subdued and sentiment remains weak, but positive payroll growth and stable government employment continue to support underlying housing demand.
Supply is unlikely to surge. Permits and single-family starts both declined, reducing the risk of overbuilding but also limiting the future inventory needed to improve affordability.
Builders face a mixed environment. Construction spending is strong, yet builder confidence and new-home sales are weak. That combination points to elevated costs, selective construction, and likely continued use of incentives.
The Sacramento region remains comparatively resilient. A broad private-employment base and expanding government employment help stabilize household income even as national growth slows.
Price, condition, financing strategy, and timing matter more than ever.
Jay Emerson, Broker Masters Club – Outstanding Life Member – DRE#1788488 |